Matplotlib中使用Artist.set_sketch_params()方法实现草图效果
参考:Matplotlib.artist.Artist.set_sketch_params() in Python
Matplotlib是Python中最流行的数据可视化库之一,它提供了丰富的绘图功能和自定义选项。在Matplotlib中,Artist是所有可视化元素的基类,包括线条、文本、图形等。Artist类中的set_sketch_params()方法是一个强大的工具,可以为绘图元素添加草图效果,使图形看起来更加自然和手绘风格。本文将详细介绍如何在Matplotlib中使用Artist.set_sketch_params()方法来实现各种有趣的草图效果。
1. Artist.set_sketch_params()方法简介
Artist.set_sketch_params()方法是Matplotlib中Artist类的一个成员函数,用于设置绘图元素的草图参数。通过调整这些参数,我们可以为图形添加不同程度的草图效果,使其看起来更像手绘或素描风格。
该方法的基本语法如下:
Artist.set_sketch_params(scale=None, length=None, randomness=None)
参数说明:
– scale:控制草图效果的整体比例,默认为1。
– length:控制草图线条的长度,默认为None。
– randomness:控制草图效果的随机程度,默认为None。
下面我们来看一个简单的示例,了解如何使用set_sketch_params()方法:
import matplotlib.pyplot as plt

fig, ax = plt.subplots()
circle = plt.Circle((0.5, 0.5), 0.2)
circle.set_sketch_params(scale=5, length=100, randomness=0.3)
ax.add_artist(circle)
ax.set_title("How to use set_sketch_params() - how2matplotlib.com")
plt.show()
Output:
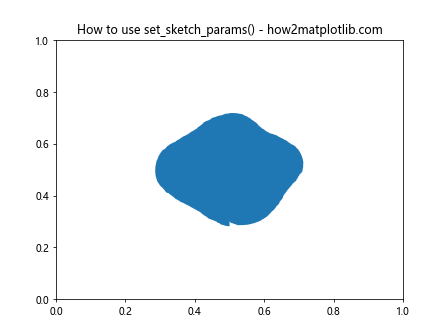
在这个例子中,我们创建了一个圆形,并使用set_sketch_params()方法为其添加草图效果。通过调整scale、length和randomness参数,我们可以控制草图效果的强度和特征。
2. 调整草图效果的比例
scale参数用于控制草图效果的整体比例。较大的scale值会使草图效果更加明显,而较小的值则会使效果更加细腻。让我们通过一系列示例来探索不同scale值的效果:
import matplotlib.pyplot as plt

fig, axs = plt.subplots(2, 2, figsize=(10, 10))
scales = [1, 3, 5, 10]

for ax, scale in zip(axs.flat, scales):
    circle = plt.Circle((0.5, 0.5), 0.3, fill=False)
    circle.set_sketch_params(scale=scale)
    ax.add_artist(circle)
    ax.set_title(f"Scale: {scale} - how2matplotlib.com")
    ax.set_xlim(0, 1)
    ax.set_ylim(0, 1)

plt.tight_layout()
plt.show()
Output:
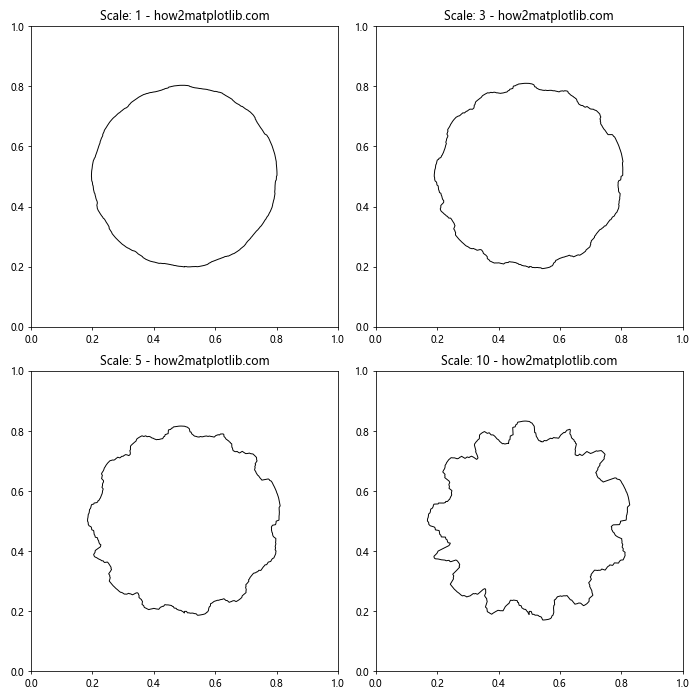
在这个例子中,我们创建了一个2×2的子图网格,每个子图中绘制一个圆,并使用不同的scale值。通过比较这些子图,我们可以清楚地看到scale参数对草图效果的影响。
3. 调整草图线条的长度
length参数用于控制草图线条的长度。较长的线条会使草图效果更加明显,而较短的线条则会使效果更加细腻。让我们来看一些示例:
import matplotlib.pyplot as plt
import numpy as np

fig, axs = plt.subplots(2, 2, figsize=(10, 10))
lengths = [50, 100, 200, 400]

x = np.linspace(0, 10, 100)
y = np.sin(x)

for ax, length in zip(axs.flat, lengths):
    line, = ax.plot(x, y)
    line.set_sketch_params(scale=5, length=length)
    ax.set_title(f"Length: {length} - how2matplotlib.com")

plt.tight_layout()
plt.show()
Output:
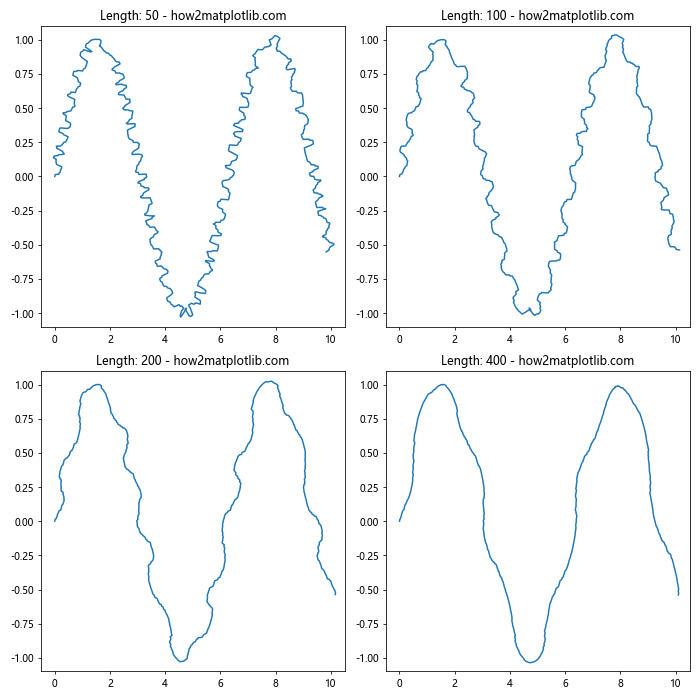
在这个例子中,我们绘制了一条正弦曲线,并使用不同的length值来设置草图效果。通过比较这些子图,我们可以观察到length参数如何影响草图线条的外观。
4. 调整草图效果的随机程度
randomness参数用于控制草图效果的随机程度。较大的randomness值会使草图效果更加不规则和自然,而较小的值则会使效果更加均匀和可预测。让我们通过一些示例来探索不同randomness值的效果:
import matplotlib.pyplot as plt

fig, axs = plt.subplots(2, 2, figsize=(10, 10))
randomness_values = [0.1, 0.3, 0.5, 0.8]

for ax, randomness in zip(axs.flat, randomness_values):
    rect = plt.Rectangle((0.2, 0.2), 0.6, 0.6, fill=False)
    rect.set_sketch_params(scale=5, length=100, randomness=randomness)
    ax.add_artist(rect)
    ax.set_title(f"Randomness: {randomness} - how2matplotlib.com")
    ax.set_xlim(0, 1)
    ax.set_ylim(0, 1)

plt.tight_layout()
plt.show()
Output:
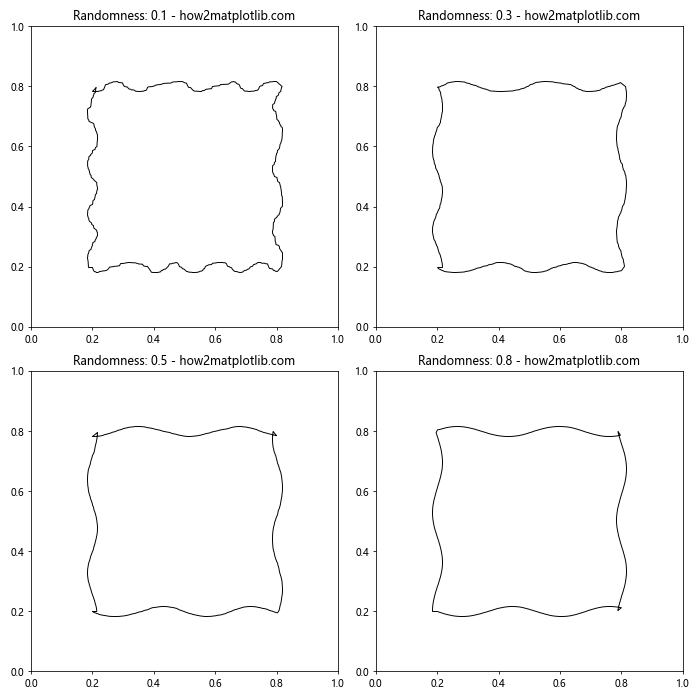
在这个例子中,我们绘制了一系列矩形,并使用不同的randomness值来设置草图效果。通过比较这些子图,我们可以清楚地看到randomness参数如何影响草图效果的自然度和不规则性。
5. 为不同类型的图形元素添加草图效果
set_sketch_params()方法可以应用于各种Matplotlib图形元素,包括线条、标记、填充区域等。让我们来看一些示例,展示如何为不同类型的图形元素添加草图效果:
5.1 为线条添加草图效果
import matplotlib.pyplot as plt
import numpy as np

fig, ax = plt.subplots()

x = np.linspace(0, 10, 100)
y1 = np.sin(x)
y2 = np.cos(x)

line1, = ax.plot(x, y1, label='Sin')
line2, = ax.plot(x, y2, label='Cos')

line1.set_sketch_params(scale=5, length=100, randomness=0.3)
line2.set_sketch_params(scale=3, length=50, randomness=0.2)

ax.legend()
ax.set_title("Sketch effect on lines - how2matplotlib.com")
plt.show()
Output:
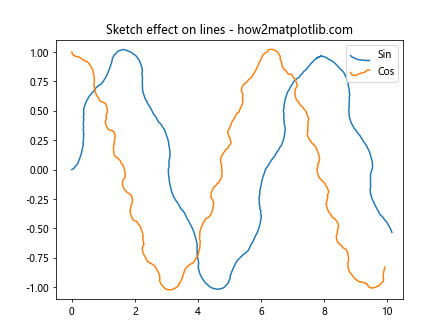
在这个例子中,我们绘制了正弦和余弦曲线,并为它们分别设置了不同的草图效果参数。这展示了如何为线条图添加草图效果,使其看起来更加自然和手绘风格。
5.2 为散点图添加草图效果
import matplotlib.pyplot as plt
import numpy as np

fig, ax = plt.subplots()

x = np.random.rand(50)
y = np.random.rand(50)

scatter = ax.scatter(x, y, s=100)
scatter.set_sketch_params(scale=5, length=30, randomness=0.5)

ax.set_title("Sketch effect on scatter plot - how2matplotlib.com")
plt.show()
Output:
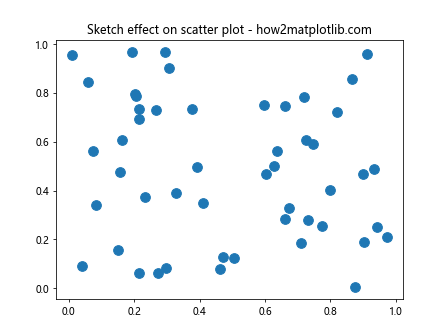
这个例子展示了如何为散点图添加草图效果。通过设置适当的草图参数,我们可以使散点看起来更像手绘的标记。
5.3 为柱状图添加草图效果
import matplotlib.pyplot as plt
import numpy as np

fig, ax = plt.subplots()

x = ['A', 'B', 'C', 'D', 'E']
y = np.random.randint(1, 10, 5)

bars = ax.bar(x, y)

for bar in bars:
    bar.set_sketch_params(scale=5, length=100, randomness=0.3)

ax.set_title("Sketch effect on bar plot - how2matplotlib.com")
plt.show()
Output:
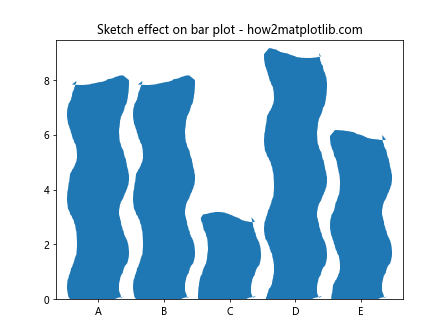
这个例子展示了如何为柱状图添加草图效果。通过为每个柱子设置草图参数,我们可以创建一个看起来更加手绘风格的柱状图。
6. 组合使用草图效果和其他样式设置
set_sketch_params()方法可以与其他Matplotlib样式设置结合使用,以创建更加独特和吸引人的可视化效果。让我们来看一些示例:
6.1 结合线条样式和草图效果
import matplotlib.pyplot as plt
import numpy as np

fig, ax = plt.subplots()

x = np.linspace(0, 10, 100)
y1 = np.sin(x)
y2 = np.cos(x)

line1, = ax.plot(x, y1, linestyle='--', linewidth=2, color='red', label='Sin')
line2, = ax.plot(x, y2, linestyle='-.', linewidth=2, color='blue', label='Cos')

line1.set_sketch_params(scale=5, length=100, randomness=0.3)
line2.set_sketch_params(scale=3, length=50, randomness=0.2)

ax.legend()
ax.set_title("Combining line styles and sketch effects - how2matplotlib.com")
plt.show()
Output:
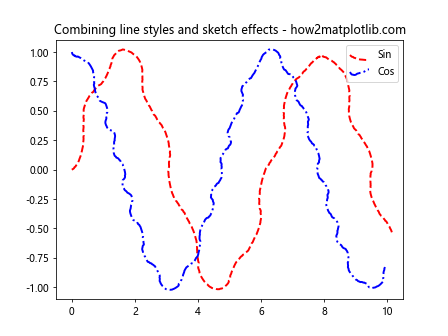
在这个例子中,我们结合了不同的线条样式(虚线和点划线)和草图效果,创造出更加丰富和有趣的视觉效果。
6.2 结合标记和草图效果
import matplotlib.pyplot as plt
import numpy as np

fig, ax = plt.subplots()

x = np.linspace(0, 10, 20)
y1 = np.sin(x)
y2 = np.cos(x)

line1, = ax.plot(x, y1, marker='o', markersize=10, linestyle='-', label='Sin')
line2, = ax.plot(x, y2, marker='s', markersize=10, linestyle='-', label='Cos')

line1.set_sketch_params(scale=5, length=100, randomness=0.3)
line2.set_sketch_params(scale=3, length=50, randomness=0.2)

ax.legend()
ax.set_title("Combining markers and sketch effects - how2matplotlib.com")
plt.show()
Output:
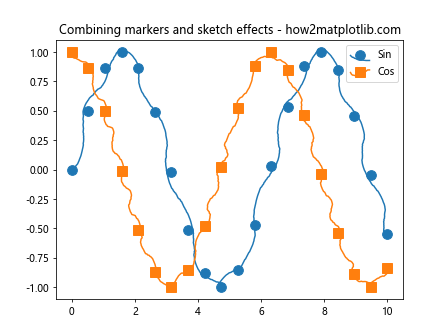
这个例子展示了如何将标记(圆形和方形)与草图效果结合使用,创造出独特的手绘风格图表。
7. 为复杂图形添加草图效果
set_sketch_params()方法不仅可以应用于简单的图形元素,还可以用于更复杂的图形和图表。让我们来看一些更高级的示例:
7.1 为饼图添加草图效果
import matplotlib.pyplot as plt

fig, ax = plt.subplots()

sizes = [30, 25, 20, 15, 10]
labels = ['A', 'B', 'C', 'D', 'E']

wedges, texts, autotexts = ax.pie(sizes, labels=labels, autopct='%1.1f%%', startangle=90)

for wedge in wedges:
    wedge.set_sketch_params(scale=5, length=100, randomness=0.3)

ax.set_title("Sketch effect on pie chart - how2matplotlib.com")
plt.show()
Output:
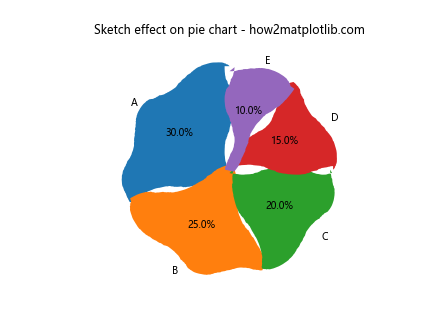
这个例子展示了如何为饼图的每个扇形添加草图效果,创造出一个独特的手绘风格饼图。
7.2 为填充区域图添加草图效果
import matplotlib.pyplot as plt
import numpy as np

fig, ax = plt.subplots()

x = np.linspace(0, 10, 100)
y1 = np.sin(x)
y2 = np.cos(x)

fill = ax.fill_between(x, y1, y2, alpha=0.5)
fill.set_sketch_params(scale=5, length=100, randomness=0.3)

ax.set_title("Sketch effect on filled area - how2matplotlib.com")
plt.show()
Output:
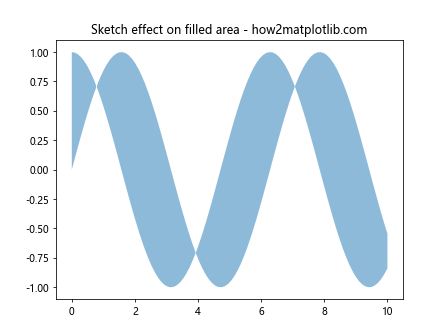
这个例子展示了如何为填充区域添加草图效果,使其看起来更加自然和手绘风格。
8. 在子图中使用草图效果
当使用子图时,我们可以为每个子图中的元素单独设置草图效果。这允许我们在一个图形中创建多个具有不同草图风格的可视化。让我们来看一个示例:
import matplotlib.pyplot as plt
import numpy as np

fig, axs = plt.subplots(2, 2, figsize=(12, 12))

x = np.linspace(0, 10, 100)
y = np.sin(x)

# 子图1:线条图
axs[0, 0].plot(x, y)
axs[0, 0].set_title("Normal Line Plot - how2matplotlib.com")

# 子图2:带草图效果的线条图
line, = axs[0, 1].plot(x, y)
line.set_sketch_params(scale=5, length=100, randomness=0.3)
axs[0, 1].set_title("Sketchy Line Plot - how2matplotlib.com")

# 子图3:散点图
axs[1, 0].scatter(x, y)
axs[1, 0].set_title("Normal Scatter Plot - how2matplotlib.com")

# 子图4:带草图效果的散点图
scatter = axs[1, 1].scatter(x, y)
scatter.set_sketch_params(scale=3, length=50, randomness=0.5)
axs[1, 1].set_title("Sketchy Scatter Plot - how2matplotlib.com")

plt.tight_layout()
plt.show()
Output:
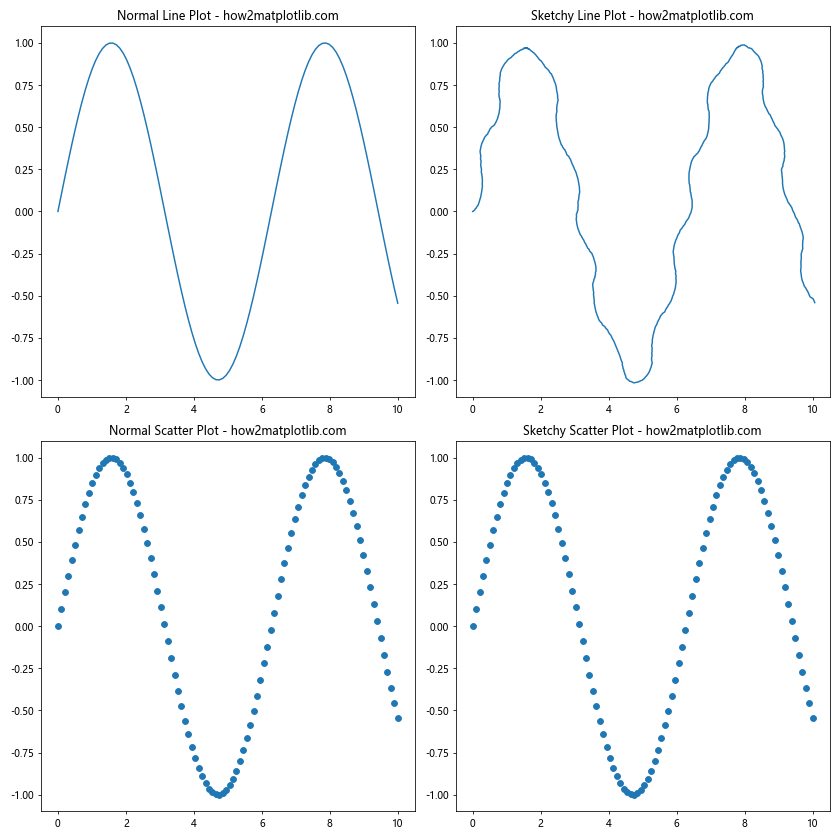
在这个例子中,我们创建了一个2×2的子图网格,并在不同的子图中展示了普通的线条图和散点图,以及添加了草图效果的线条图和散点图。这种方法允许我们直观地比较草图效果对不同类型图表的影响。
9. 动态调整草图效果
在某些情况下,我们可能希望根据数据或用户输入动态调整草图效果。以下是一个示例,展示如何使用滑块来实时调整草图效果的参数:
import matplotlib.pyplot as plt
from matplotlib.widgets import Slider
import numpy as np

fig, ax = plt.subplots()
plt.subplots_adjust(bottom=0.25)

x = np.linspace(0, 10, 100)
y = np.sin(x)
line, = ax.plot(x, y)

ax_scale = plt.axes([0.1, 0.1, 0.65, 0.03])
ax_length = plt.axes([0.1, 0.15, 0.65, 0.03])
ax_randomness = plt.axes([0.1, 0.2, 0.65, 0.03])

s_scale = Slider(ax_scale, 'Scale', 0.1, 10.0, valinit=1)
s_length = Slider(ax_length, 'Length', 1, 200, valinit=100)
s_randomness = Slider(ax_randomness, 'Randomness', 0, 1, valinit=0.3)

def update(val):
    scale = s_scale.val
    length = s_length.val
    randomness = s_randomness.val
    line.set_sketch_params(scale=scale, length=length, randomness=randomness)
    fig.canvas.draw_idle()

s_scale.on_changed(update)
s_length.on_changed(update)
s_randomness.on_changed(update)

ax.set_title("Dynamic sketch effect adjustment - how2matplotlib.com")
plt.show()
Output:
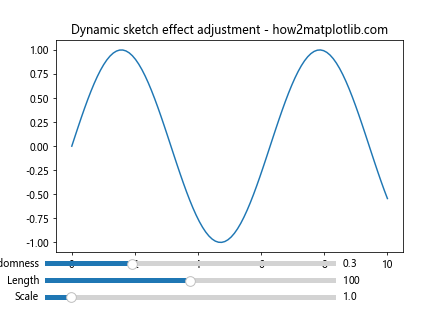
这个示例创建了一个交互式图形,用户可以通过滑块实时调整草图效果的scale、length和randomness参数。这种方法对于探索不同参数组合的效果非常有用。
10. 在3D图形中使用草图效果
set_sketch_params()方法也可以应用于3D图形。虽然效果可能不如2D图形明显,但仍然可以为3D可视化添加一些独特的风格。以下是一个在3D表面图上应用草图效果的示例:
import matplotlib.pyplot as plt
from mpl_toolkits.mplot3d import Axes3D
import numpy as np

fig = plt.figure()
ax = fig.add_subplot(111, projection='3d')

x = np.arange(-5, 5, 0.25)
y = np.arange(-5, 5, 0.25)
x, y = np.meshgrid(x, y)
r = np.sqrt(x**2 + y**2)
z = np.sin(r)

surface = ax.plot_surface(x, y, z, cmap='viridis')
surface.set_sketch_params(scale=5, length=100, randomness=0.3)

ax.set_title("3D surface with sketch effect - how2matplotlib.com")
plt.show()
Output:
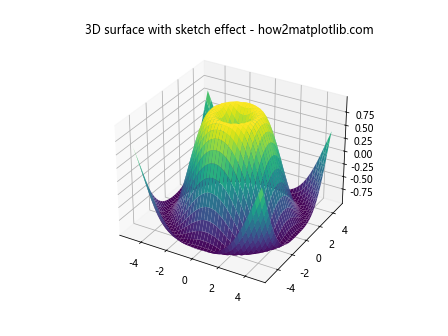
这个例子展示了如何为3D表面图添加草图效果。虽然效果可能不如2D图形那么明显,但它仍然可以为3D可视化添加一些独特的手绘风格。
11. 结合其他Matplotlib特性
set_sketch_params()方法可以与Matplotlib的其他特性结合使用,以创建更加复杂和有趣的可视化效果。以下是一些示例:
11.1 结合颜色映射和草图效果
import matplotlib.pyplot as plt
import numpy as np

fig, ax = plt.subplots()

x = np.linspace(0, 10, 100)
y = np.sin(x)
colors = plt.cm.viridis(np.linspace(0, 1, 100))

for i in range(len(x)-1):
    line = plt.Line2D([x[i], x[i+1]], [y[i], y[i+1]], color=colors[i])
    line.set_sketch_params(scale=5, length=10, randomness=0.3)
    ax.add_artist(line)

ax.set_title("Combining color mapping and sketch effect - how2matplotlib.com")
plt.show()
Output:
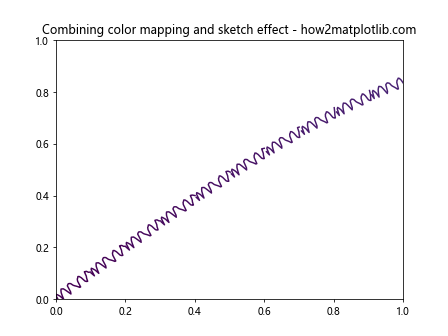
这个例子展示了如何将颜色映射与草图效果结合,创造出一个既有手绘风格又有丰富色彩的可视化效果。
11.2 结合阴影和草图效果
import matplotlib.pyplot as plt
import numpy as np

fig, ax = plt.subplots()

circle = plt.Circle((0.5, 0.5), 0.3, fill=False)
circle.set_sketch_params(scale=5, length=100, randomness=0.3)

shadow = plt.Circle((0.52, 0.48), 0.3, fill=True, facecolor='gray', alpha=0.3)
shadow.set_sketch_params(scale=5, length=100, randomness=0.3)

ax.add_artist(shadow)
ax.add_artist(circle)

ax.set_xlim(0, 1)
ax.set_ylim(0, 1)
ax.set_title("Combining shadow and sketch effect - how2matplotlib.com")
plt.show()
Output:
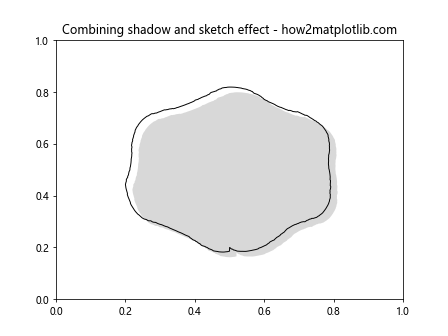
这个例子展示了如何将阴影效果与草图效果结合,创造出一个具有深度感的手绘风格图形。
12. 在自定义图形中使用草图效果
除了Matplotlib提供的标准图形元素,我们还可以为自定义图形添加草图效果。以下是一个创建自定义多边形并添加草图效果的示例:
import matplotlib.pyplot as plt
import numpy as np
from matplotlib.patches import Polygon

fig, ax = plt.subplots()

vertices = np.array([[0.1, 0.1], [0.9, 0.1], [0.5, 0.9]])
polygon = Polygon(vertices, closed=True, fill=False)
polygon.set_sketch_params(scale=5, length=100, randomness=0.3)

ax.add_patch(polygon)
ax.set_xlim(0, 1)
ax.set_ylim(0, 1)
ax.set_title("Custom polygon with sketch effect - how2matplotlib.com")
plt.show()
Output:
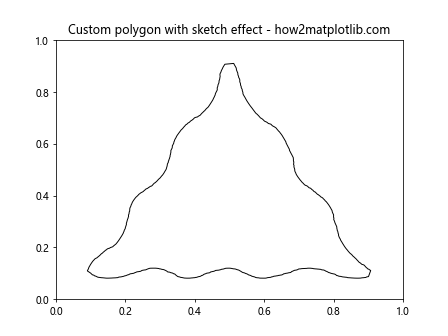
这个例子展示了如何创建一个自定义的三角形,并为其添加草图效果。这种方法可以扩展到任何自定义形状或图形。
13. 在动画中使用草图效果
草图效果也可以应用于动画,为动态可视化添加独特的手绘风格。以下是一个简单的动画示例,展示了如何在动画中使用草图效果:
import matplotlib.pyplot as plt
import numpy as np
from matplotlib.animation import FuncAnimation

fig, ax = plt.subplots()

x = np.linspace(0, 2*np.pi, 100)
line, = ax.plot(x, np.sin(x))
line.set_sketch_params(scale=5, length=100, randomness=0.3)

def update(frame):
    line.set_ydata(np.sin(x + frame/10))
    return line,

ani = FuncAnimation(fig, update, frames=np.linspace(0, 2*np.pi, 128),
                    interval=50, blit=True)

ax.set_title("Animated sketch effect - how2matplotlib.com")
plt.show()
Output:
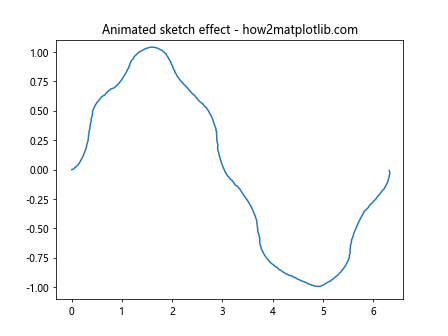
这个例子创建了一个简单的正弦波动画,并为线条添加了草图效果。随着动画的进行,草图效果会给人一种手绘动画的感觉。
14. 总结
通过本文的详细介绍和丰富的示例,我们深入探讨了Matplotlib中Artist.set_sketch_params()方法的使用。这个强大的工具允许我们为各种图形元素添加草图效果,创造出独特的手绘风格可视化。
我们学习了如何:
1. 调整草图效果的比例、线条长度和随机程度
2. 为不同类型的图形元素添加草图效果
3. 将草图效果与其他样式设置结合使用
4. 在复杂图形和子图中应用草图效果
5. 动态调整草图效果
6. 在3D图形中使用草图效果
7. 结合其他Matplotlib特性,如颜色映射和阴影
8. 为自定义图形添加草图效果
9. 在动画中应用草图效果
通过灵活运用set_sketch_params()方法,我们可以为数据可视化添加独特的艺术风格,使图表更加生动有趣。这不仅可以增加可视化的吸引力,还可以在某些情况下帮助突出重要信息或创造特定的视觉效果。
在实际应用中,建议根据具体的数据和目标受众来调整草图效果的参数。适度使用草图效果可以增加图表的趣味性,但过度使用可能会影响数据的清晰度和可读性。因此,在使用这个功能时,需要在艺术效果和数据呈现之间找到适当的平衡。
总之,Artist.set_sketch_params()方法为Matplotlib用户提供了一个强大的工具,可以创造出独特而富有表现力的数据可视化。通过本文的学习,相信读者已经掌握了如何在自己的项目中灵活运用这个功能,为数据可视化增添新的维度和魅力。
 极客笔记
极客笔记