Matplotlib.pyplot.barh()函数:轻松创建水平条形图
参考:Matplotlib.pyplot.barh() function in Python
Matplotlib是Python中最流行的数据可视化库之一,而pyplot是Matplotlib中的一个子模块,提供了一系列用于创建各种图表的函数。在这篇文章中,我们将深入探讨pyplot模块中的barh()函数,这是一个用于创建水平条形图的强大工具。
1. barh()函数简介
barh()函数是Matplotlib.pyplot模块中用于创建水平条形图的函数。与垂直条形图不同,水平条形图将数据值表示为从左到右延伸的矩形条,非常适合展示类别之间的比较或排序数据。
让我们从一个简单的例子开始:
import matplotlib.pyplot as plt

categories = ['Category A', 'Category B', 'Category C', 'Category D']
values = [4, 7, 2, 5]

plt.figure(figsize=(10, 6))
plt.barh(categories, values)
plt.title('Simple Horizontal Bar Chart - how2matplotlib.com')
plt.xlabel('Values')
plt.ylabel('Categories')
plt.show()
Output:
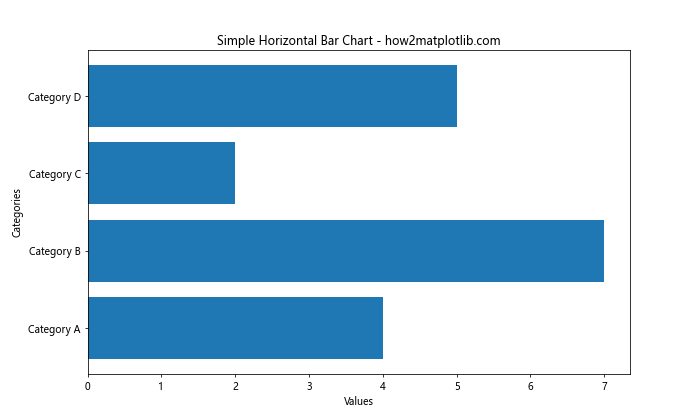
在这个例子中,我们创建了一个简单的水平条形图,展示了四个类别的数值。barh()函数接受两个主要参数:类别标签和对应的数值。
2. barh()函数的基本语法
barh()函数的基本语法如下:
plt.barh(y, width, height=0.8, left=None, *, align='center', **kwargs)
主要参数说明:
– y:条形的y坐标(通常是类别标签)
– width:条形的长度(即数据值)
– height:条形的高度(默认为0.8)
– left:条形的起始x坐标(默认为0)
– align:条形的对齐方式(’center’或’edge’)
让我们通过一个更复杂的例子来展示这些参数的使用:
import matplotlib.pyplot as plt
import numpy as np

categories = ['A', 'B', 'C', 'D', 'E']
values = [15, 30, 45, 10, 25]
y_pos = np.arange(len(categories))

plt.figure(figsize=(12, 6))
plt.barh(y_pos, values, height=0.5, align='center', color='skyblue', edgecolor='navy')
plt.yticks(y_pos, categories)
plt.xlabel('Values')
plt.title('Customized Horizontal Bar Chart - how2matplotlib.com')
plt.xlim(0, max(values) * 1.1)
plt.show()
Output:
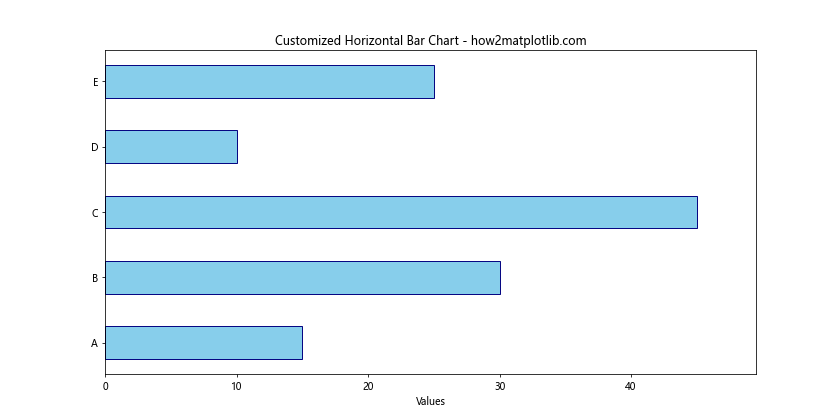
在这个例子中,我们使用了numpy的arange()函数来创建y坐标,并自定义了条形的高度、颜色和边框颜色。
3. 自定义条形颜色
barh()函数允许我们为每个条形指定不同的颜色,这对于强调特定数据或创建更具视觉吸引力的图表非常有用。
import matplotlib.pyplot as plt

categories = ['Product A', 'Product B', 'Product C', 'Product D', 'Product E']
sales = [120, 98, 145, 89, 132]
colors = ['red', 'green', 'blue', 'orange', 'purple']

plt.figure(figsize=(12, 6))
plt.barh(categories, sales, color=colors)
plt.title('Sales by Product - how2matplotlib.com')
plt.xlabel('Sales')
plt.ylabel('Products')
plt.show()
Output:
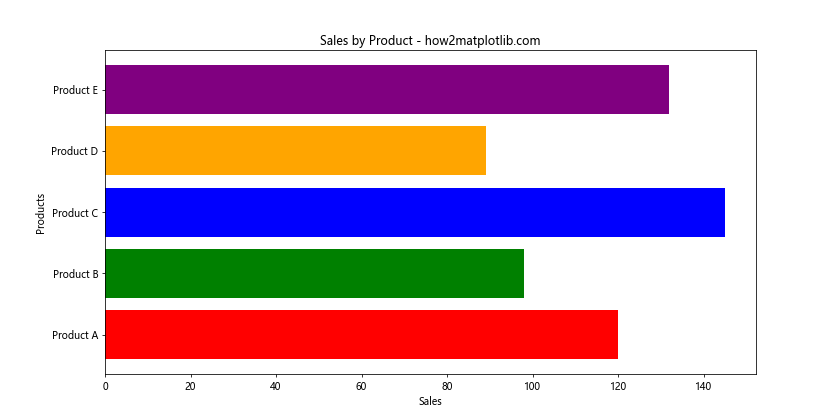
在这个例子中,我们为每个产品的销售数据指定了不同的颜色,使图表更加生动。
4. 添加数据标签
为了使水平条形图更加信息丰富,我们可以在每个条形的末端添加数值标签:
import matplotlib.pyplot as plt

countries = ['USA', 'China', 'Japan', 'Germany', 'UK']
gdp = [21.43, 14.34, 5.08, 3.86, 2.67]

plt.figure(figsize=(12, 6))
bars = plt.barh(countries, gdp, color='lightblue')
plt.title('GDP by Country (in trillion USD) - how2matplotlib.com')
plt.xlabel('GDP (trillion USD)')

for bar in bars:
    width = bar.get_width()
    plt.text(width, bar.get_y() + bar.get_height()/2, f'{width:.2f}',
             ha='left', va='center')

plt.tight_layout()
plt.show()
Output:
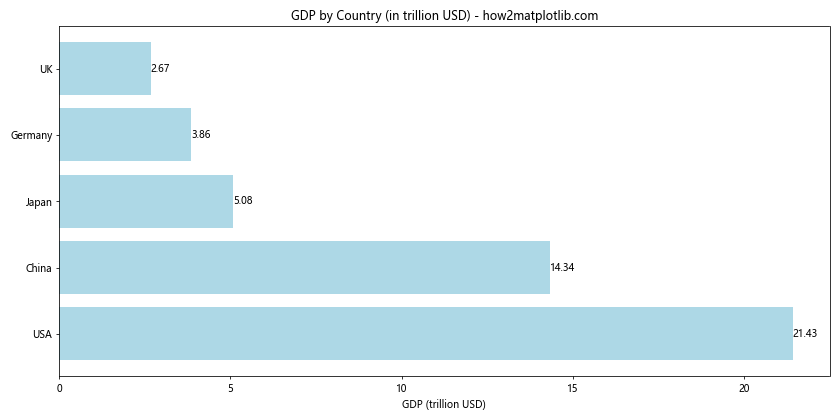
这个例子展示了如何在每个条形的末端添加精确的数值标签,使读者能够快速获取具体数据。
5. 创建堆叠水平条形图
堆叠水平条形图可以用来展示多个类别的组成部分:
import matplotlib.pyplot as plt
import numpy as np

categories = ['Category A', 'Category B', 'Category C', 'Category D']
men_means = [20, 35, 30, 35]
women_means = [25, 32, 34, 20]

y_pos = np.arange(len(categories))

plt.figure(figsize=(12, 6))
plt.barh(y_pos, men_means, align='center', color='skyblue', label='Men')
plt.barh(y_pos, women_means, align='center', left=men_means, color='lightpink', label='Women')

plt.yticks(y_pos, categories)
plt.xlabel('Values')
plt.title('Stacked Horizontal Bar Chart - how2matplotlib.com')
plt.legend()

plt.tight_layout()
plt.show()
Output:
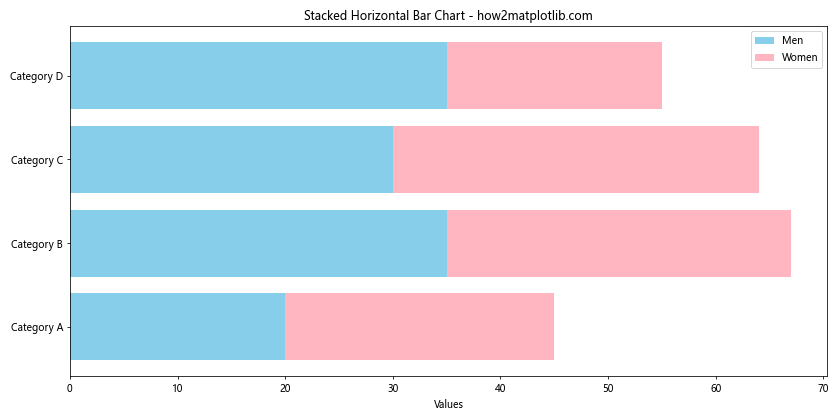
这个例子创建了一个堆叠水平条形图,展示了男性和女性在不同类别中的分布情况。
6. 使用误差条
在某些情况下,我们可能需要在水平条形图中显示误差范围:
import matplotlib.pyplot as plt
import numpy as np

categories = ['A', 'B', 'C', 'D', 'E']
values = [20, 35, 30, 35, 27]
errors = [2, 3, 4, 1, 2]

y_pos = np.arange(len(categories))

plt.figure(figsize=(12, 6))
plt.barh(y_pos, values, xerr=errors, align='center', alpha=0.8, capsize=5)
plt.yticks(y_pos, categories)
plt.xlabel('Values')
plt.title('Horizontal Bar Chart with Error Bars - how2matplotlib.com')

plt.tight_layout()
plt.show()
Output:
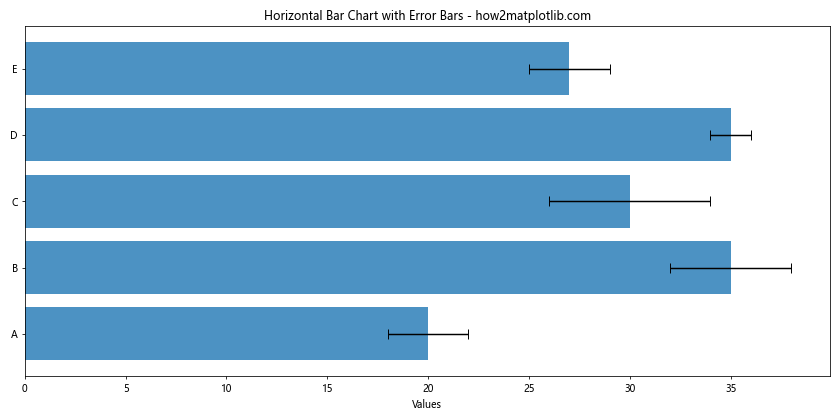
这个例子展示了如何在水平条形图中添加误差条,这在展示科学数据或统计结果时特别有用。
7. 创建分组水平条形图
分组水平条形图可以用来比较多个类别的多个子类别:
import matplotlib.pyplot as plt
import numpy as np

categories = ['Group A', 'Group B', 'Group C', 'Group D']
men_means = [20, 35, 30, 35]
women_means = [25, 32, 34, 20]

y_pos = np.arange(len(categories))
height = 0.35

plt.figure(figsize=(12, 6))
plt.barh(y_pos - height/2, men_means, height, align='center', color='skyblue', label='Men')
plt.barh(y_pos + height/2, women_means, height, align='center', color='lightpink', label='Women')

plt.yticks(y_pos, categories)
plt.xlabel('Values')
plt.title('Grouped Horizontal Bar Chart - how2matplotlib.com')
plt.legend()

plt.tight_layout()
plt.show()
Output:
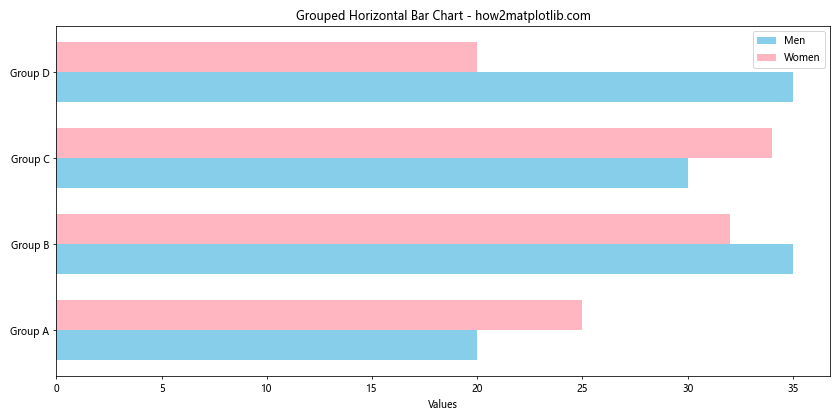
这个例子创建了一个分组水平条形图,直观地比较了男性和女性在不同组别中的数据。
8. 添加网格线
为了提高图表的可读性,我们可以添加网格线:
import matplotlib.pyplot as plt

categories = ['Product A', 'Product B', 'Product C', 'Product D', 'Product E']
sales = [120, 98, 145, 89, 132]

plt.figure(figsize=(12, 6))
plt.barh(categories, sales, color='lightgreen')
plt.title('Sales by Product with Grid - how2matplotlib.com')
plt.xlabel('Sales')
plt.ylabel('Products')
plt.grid(axis='x', linestyle='--', alpha=0.7)

plt.tight_layout()
plt.show()
Output:
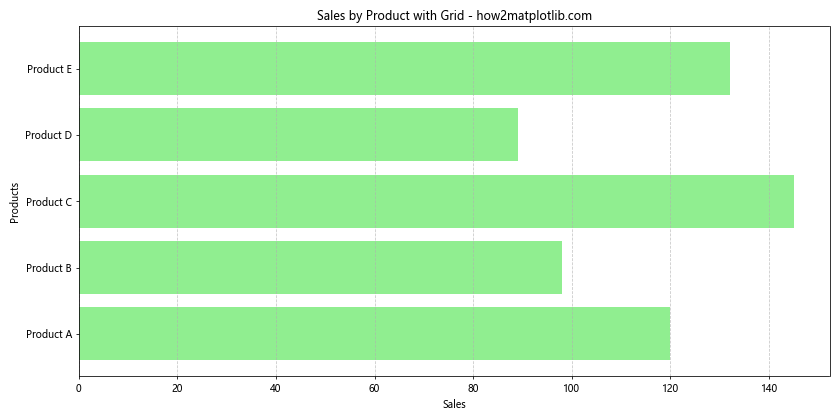
这个例子展示了如何在水平条形图中添加垂直网格线,使数值比较更加容易。
9. 自定义条形样式
我们可以通过调整条形的样式来创建更具视觉吸引力的图表:
import matplotlib.pyplot as plt

categories = ['A', 'B', 'C', 'D', 'E']
values = [15, 30, 45, 10, 25]

plt.figure(figsize=(12, 6))
plt.barh(categories, values, height=0.5, color='lightblue', edgecolor='navy',
         linewidth=2, alpha=0.8, hatch='//')
plt.title('Styled Horizontal Bar Chart - how2matplotlib.com')
plt.xlabel('Values')
plt.ylabel('Categories')

plt.tight_layout()
plt.show()
Output:
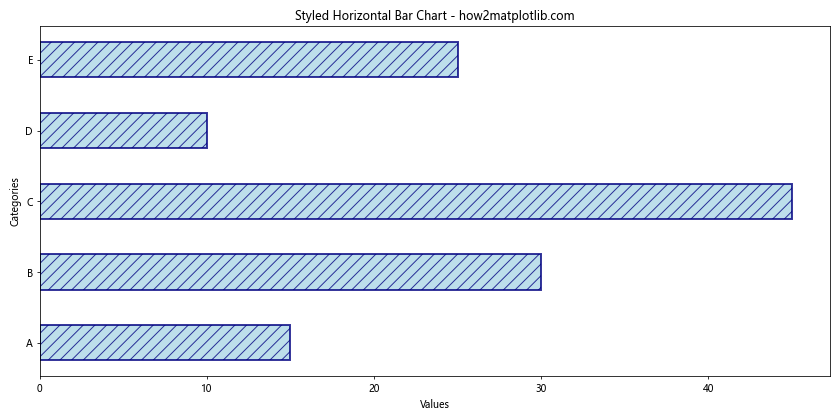
在这个例子中,我们自定义了条形的高度、颜色、边框和填充样式,创造出一个独特的视觉效果。
10. 使用颜色映射
颜色映射可以根据数值大小自动为条形分配颜色:
import matplotlib.pyplot as plt
import numpy as np

categories = ['A', 'B', 'C', 'D', 'E', 'F', 'G', 'H']
values = np.random.randint(10, 100, size=len(categories))

plt.figure(figsize=(12, 6))
bars = plt.barh(categories, values, color=plt.cm.viridis(values/max(values)))
plt.colorbar(plt.cm.ScalarMappable(cmap=plt.cm.viridis), label='Value')
plt.title('Horizontal Bar Chart with Color Mapping - how2matplotlib.com')
plt.xlabel('Values')
plt.ylabel('Categories')

plt.tight_layout()
plt.show()
这个例子使用了viridis颜色映射来根据数值大小为条形分配颜色,并添加了一个颜色条来解释颜色的含义。
11. 创建多子图水平条形图
有时我们可能需要在一个图形中展示多个相关的水平条形图:
import matplotlib.pyplot as plt

categories = ['A', 'B', 'C', 'D']
data1 = [10, 20, 15, 25]
data2 = [15, 25, 20, 30]
data3 = [5, 15, 10, 20]

fig, (ax1, ax2, ax3) = plt.subplots(3, 1, figsize=(12, 15))

ax1.barh(categories, data1, color='skyblue')
ax1.set_title('Data Set 1 - how2matplotlib.com')

ax2.barh(categories, data2, color='lightgreen')
ax2.set_title('Data Set 2 - how2matplotlib.com')

ax3.barh(categories, data3, color='salmon')
ax3.set_title('Data Set 3 - how2matplotlib.com')

for ax in (ax1, ax2, ax3):
    ax.set_xlabel('Values')
    ax.set_ylabel('Categories')

plt.tight_layout()
plt.show()
Output:
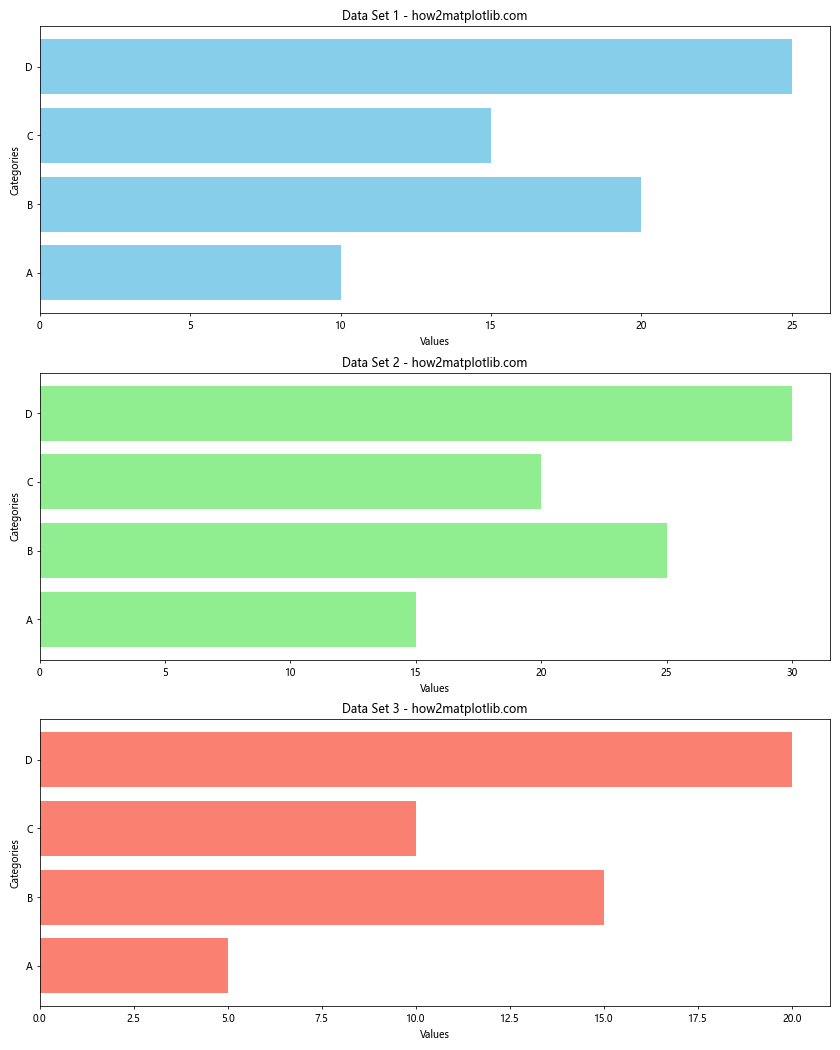
这个例子创建了三个子图,每个子图都是一个独立的水平条形图,允许我们在同一个图形中比较多组数据。
12. 添加条形标注
为了提供更多上下文信息,我们可以在条形上添加文本标注:
import matplotlib.pyplot as plt

products = ['Product A', 'Product B', 'Product C', 'Product D']
sales = [150, 200, 125, 175]
growth = ['+10%', '+15%', '-5%', '+20%']

plt.figure(figsize=(12, 6))
bars = plt.barh(products, sales, color='lightblue')
plt.title('Product Sales with Growth Rate - how2matplotlib.com')
plt.xlabel('Sales')

for i, (bar, growth_rate) in enumerate(zip(bars, growth)):
    plt.text(bar.get_width(), bar.get_y() + bar.get_height()/2,
             f'{sales[i]} ({growth_rate})', va='center')

plt.tight_layout()
plt.show()
Output:
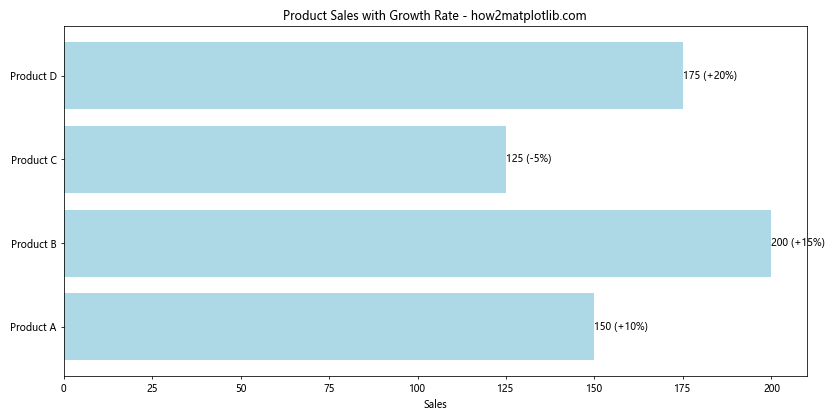
这个例子在每个条形的末端添加了销售额和增长率信息,提供了更丰富的数据上下文。
13. 创建水平条形图和折线图的组合
有时,将水平条形图与其他类型的图表结合可以提供更全面的数据视图:
import matplotlib.pyplot as plt

categories = ['A', 'B', 'C', 'D', 'E']
values1 = [20, 35, 30, 35, 27]
values2 = [25, 32, 34, 20, 25]

fig, ax1 = plt.subplots(figsize=(12, 6))

ax1.barh(categories, values1, color='lightblue', label='Data 1')
ax1.set_xlabel('Values for Data 1')
ax1.set_title('Combined Horizontal Bar and Line Chart - how2matplotlib.com')

ax2 = ax1.twiny()
ax2.plot(values2, categories, color='red', marker='o', label='Data 2')
ax2.set_xlabel('Values for Data 2')

ax1.legend(loc='lower right')
ax2.legend(loc='upper right')

plt.tight_layout()
plt.show()
Output:
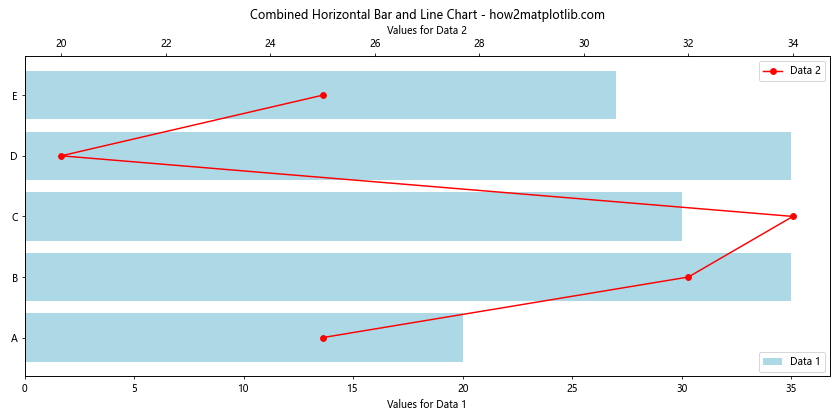
这个例子展示了如何将水平条形图和折线图结合在一起,在同一个图表中展示两组相关但不同的数据。
14. 使用对数刻度
当数据范围很大时,使用对数刻度可以更好地展示数据:
import matplotlib.pyplot as plt
import numpy as np

categories = ['A', 'B', 'C', 'D', 'E']
values = [100, 1000, 10000, 100000, 1000000]

plt.figure(figsize=(12, 6))
plt.barh(categories, values, color='lightgreen', log=True)
plt.title('Horizontal Bar Chart with Logarithmic Scale - how2matplotlib.com')
plt.xlabel('Values (log scale)')
plt.ylabel('Categories')

for i, v in enumerate(values):
    plt.text(v, i, f' {v:,}', va='center')

plt.tight_layout()
plt.show()
Output:
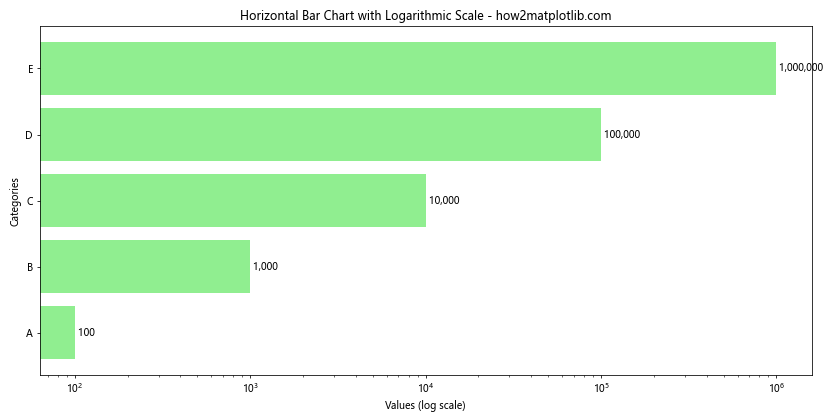
这个例子使用了对数刻度来展示跨越多个数量级的数据,同时在每个条形上添加了实际的数值标签。
15. 创建水平条形图的动画
虽然静态图表很有用,但有时动画可以更好地展示数据的变化趋势:
import matplotlib.pyplot as plt
import matplotlib.animation as animation
import numpy as np

fig, ax = plt.subplots(figsize=(12, 6))

categories = ['A', 'B', 'C', 'D', 'E']
data = np.random.randint(1, 100, (100, 5))

def animate(frame):
    ax.clear()
    ax.barh(categories, data[frame], color='skyblue')
    ax.set_xlim(0, 100)
    ax.set_title(f'Animated Horizontal Bar Chart - Frame {frame} - how2matplotlib.com')
    ax.set_xlabel('Values')
    ax.set_ylabel('Categories')

ani = animation.FuncAnimation(fig, animate, frames=100, interval=100, repeat=False)

plt.tight_layout()
plt.show()
Output:
这个例子创建了一个简单的动画,展示了5个类别的数值随时间变化的情况。注意,这个动画在某些环境中可能无法直接显示,可能需要保存为视频文件。
16. 使用渐变色
我们可以使用渐变色来增强水平条形图的视觉效果:
import matplotlib.pyplot as plt
import numpy as np

categories = ['A', 'B', 'C', 'D', 'E']
values = [25, 40, 30, 55, 45]

fig, ax = plt.subplots(figsize=(12, 6))

for i, (c, v) in enumerate(zip(categories, values)):
    gradient = np.linspace(0, 1, 256).reshape(1, -1)
    colors = plt.cm.Blues(gradient)
    ax.barh(c, v, color=colors[0, int(v/max(values)*255)])

ax.set_title('Horizontal Bar Chart with Gradient Colors - how2matplotlib.com')
ax.set_xlabel('Values')
ax.set_ylabel('Categories')

plt.tight_layout()
plt.show()
Output:
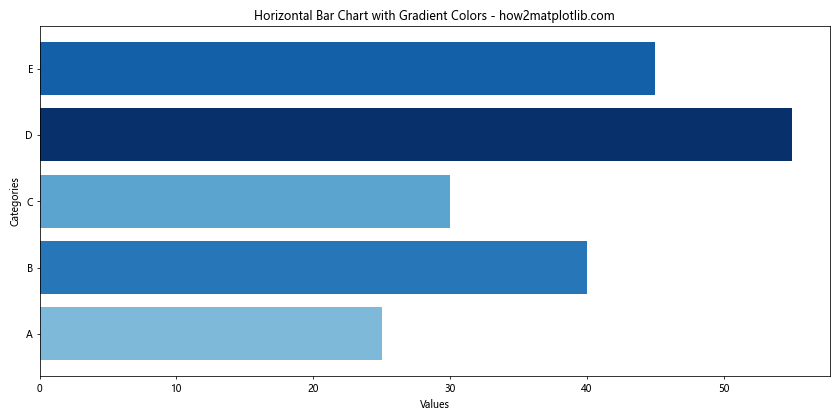
这个例子为每个条形使用了不同深浅的蓝色,颜色深浅与数值大小成正比,创造出一种渐变效果。
17. 添加图例和注释
为了使图表更加信息丰富,我们可以添加图例和注释:
import matplotlib.pyplot as plt

categories = ['Product A', 'Product B', 'Product C', 'Product D']
sales = [150, 200, 125, 175]
profits = [30, 45, 20, 35]

fig, ax = plt.subplots(figsize=(12, 6))

bars1 = ax.barh(categories, sales, color='skyblue', label='Sales')
bars2 = ax.barh(categories, profits, left=sales, color='lightgreen', label='Profit')

ax.set_title('Sales and Profits by Product - how2matplotlib.com')
ax.set_xlabel('Amount ()')
ax.legend()

for i, (s, p) in enumerate(zip(sales, profits)):
    ax.text(s/2, i, f'{s}', ha='center', va='center')
    ax.text(s+p/2, i, f'${p}', ha='center', va='center')

ax.annotate('Best selling product', xy=(200, 1), xytext=(220, 2),
            arrowprops=dict(facecolor='black', shrink=0.05))

plt.tight_layout()
plt.show()
Output:
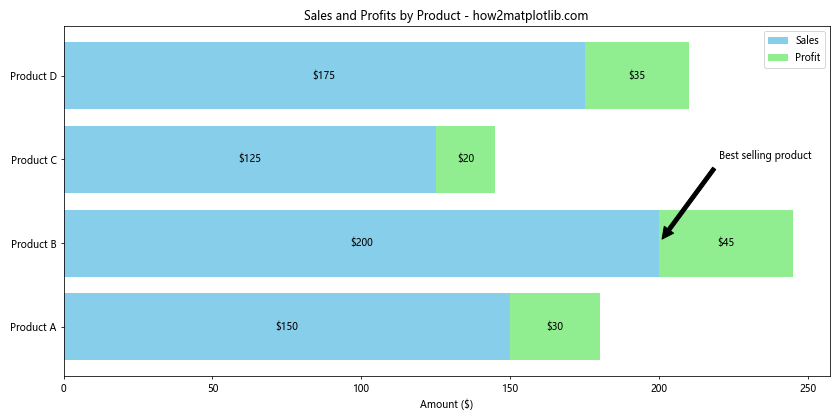
这个例子不仅展示了销售额和利润,还添加了图例和一个指向最畅销产品的注释。
18. 使用极坐标系
虽然不太常见,但我们也可以在极坐标系中创建”水平”条形图:
import matplotlib.pyplot as plt
import numpy as np

categories = ['A', 'B', 'C', 'D', 'E', 'F', 'G', 'H']
values = np.random.randint(10, 100, len(categories))

fig, ax = plt.subplots(figsize=(10, 10), subplot_kw=dict(projection='polar'))

theta = np.linspace(0, 2*np.pi, len(categories), endpoint=False)
width = 2*np.pi / len(categories)

bars = ax.bar(theta, values, width=width, bottom=20)

ax.set_xticks(theta)
ax.set_xticklabels(categories)
ax.set_title('Polar Horizontal Bar Chart - how2matplotlib.com')

# 为每个条形设置不同的颜色
for bar, color in zip(bars, plt.cm.viridis(np.linspace(0, 1, len(categories)))):
    bar.set_facecolor(color)

plt.tight_layout()
plt.show()
Output:
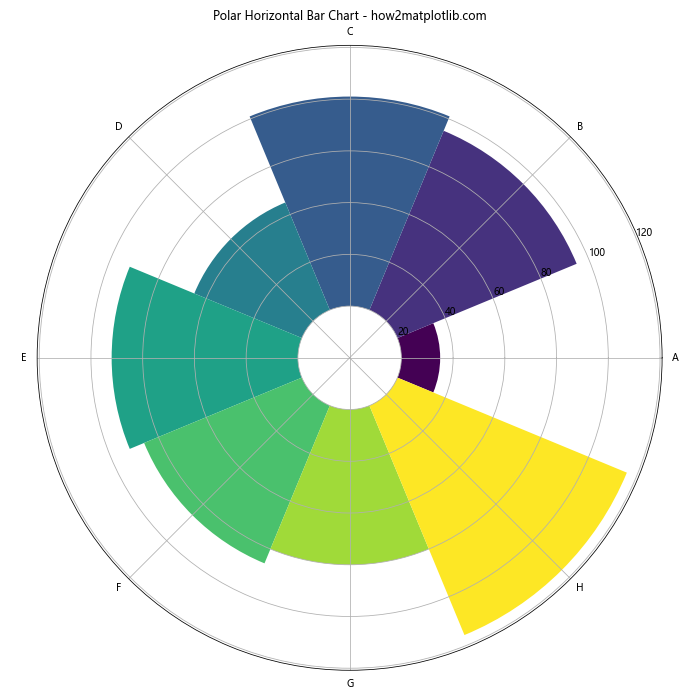
这个例子创建了一个极坐标系下的”水平”条形图,每个类别占据圆周的一个扇形区域。
19. 创建堆叠和分组的组合水平条形图
有时我们可能需要同时展示堆叠和分组的数据:
import matplotlib.pyplot as plt
import numpy as np

categories = ['Group 1', 'Group 2', 'Group 3', 'Group 4']
men_data = {'A': [20, 35, 30, 35], 'B': [25, 32, 34, 20]}
women_data = {'A': [25, 32, 34, 20], 'B': [20, 25, 30, 35]}

fig, ax = plt.subplots(figsize=(12, 6))

y_pos = np.arange(len(categories))
height = 0.35

ax.barh(y_pos - height/2, men_data['A'], height, label='Men A', color='skyblue')
ax.barh(y_pos - height/2, men_data['B'], height, left=men_data['A'], label='Men B', color='lightblue')
ax.barh(y_pos + height/2, women_data['A'], height, label='Women A', color='pink')
ax.barh(y_pos + height/2, women_data['B'], height, left=women_data['A'], label='Women B', color='lightpink')

ax.set_yticks(y_pos)
ax.set_yticklabels(categories)
ax.set_xlabel('Values')
ax.set_title('Stacked and Grouped Horizontal Bar Chart - how2matplotlib.com')
ax.legend()

plt.tight_layout()
plt.show()
Output:
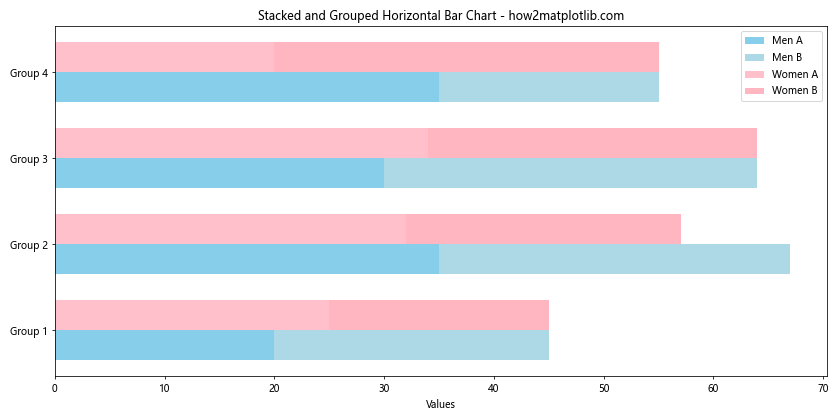
这个例子展示了如何创建一个既有堆叠又有分组的复杂水平条形图,可以同时比较多个群体和子类别的数据。
20. 使用自定义样式
最后,我们可以使用Matplotlib的样式设置来创建具有特定视觉风格的图表:
import matplotlib.pyplot as plt
import numpy as np

plt.style.use('seaborn-darkgrid')

categories = ['Category A', 'Category B', 'Category C', 'Category D', 'Category E']
values = np.random.randint(50, 100, len(categories))

fig, ax = plt.subplots(figsize=(12, 6))

bars = ax.barh(categories, values, color='lightseagreen', edgecolor='darkgreen', linewidth=2, alpha=0.8)

ax.set_title('Stylized Horizontal Bar Chart - how2matplotlib.com', fontsize=16, fontweight='bold')
ax.set_xlabel('Values', fontsize=12)
ax.set_ylabel('Categories', fontsize=12)

for bar in bars:
    width = bar.get_width()
    ax.text(width, bar.get_y() + bar.get_height()/2, f'{width}',
            ha='left', va='center', fontweight='bold')

plt.tight_layout()
plt.show()
这个例子使用了seaborn-darkgrid样式,并进一步自定义了标题、标签和数据标注的字体样式,创造出一个独特的视觉效果。
通过以上20个详细的示例,我们全面探讨了Matplotlib.pyplot.barh()函数的各种用法和技巧。从基本的水平条形图到复杂的堆叠和分组图表,从静态图表到动画,从默认样式到自定义设计,这些例子展示了barh()函数的强大功能和灵活性。无论是数据分析、科学研究还是商业报告,掌握这些技巧都能帮助你创建更加丰富、直观和有说服力的数据可视化图表。
 极客笔记
极客笔记