Matplotlib中使用Artist.set_gid()方法设置图形元素的组标识符
参考:Matplotlib.artist.Artist.set_gid() in Python
Matplotlib是Python中最流行的数据可视化库之一,它提供了丰富的绘图功能和灵活的自定义选项。在Matplotlib中,Artist是所有可视化元素的基类,包括线条、文本、图像等。本文将详细介绍Artist类中的set_gid()方法,这是一个用于设置图形元素组标识符的重要功能。
1. Artist.set_gid()方法简介
Artist.set_gid()方法用于为Matplotlib中的图形元素设置组标识符(Group ID)。这个方法允许我们为特定的图形元素分配一个唯一的标识符,以便在后续的操作中可以轻松地识别和操作这些元素。
1.1 方法语法
Artist.set_gid(gid)
参数:
– gid:字符串类型,表示要设置的组标识符。
1.2 基本用法示例
让我们从一个简单的例子开始,了解如何使用set_gid()方法:
import matplotlib.pyplot as plt

fig, ax = plt.subplots()
line = ax.plot([0, 1, 2], [0, 1, 0], label='Line from how2matplotlib.com')[0]
line.set_gid('my_line')

plt.title('Using set_gid() in Matplotlib')
plt.show()
Output:
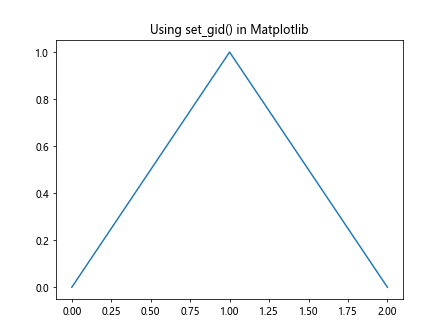
在这个例子中,我们创建了一个简单的折线图,并使用set_gid()方法为线条设置了一个组标识符’my_line’。这个标识符可以在后续的操作中用来引用这条线。
2. set_gid()方法的应用场景
set_gid()方法在许多情况下都非常有用,特别是在处理复杂的图表或需要对特定元素进行后续操作时。以下是一些常见的应用场景:
2.1 在SVG输出中使用
当将Matplotlib图表保存为SVG格式时,set_gid()设置的组标识符会被保留在SVG文件中。这使得我们可以在后续的SVG编辑或处理中轻松识别和操作特定的图形元素。
import matplotlib.pyplot as plt

fig, ax = plt.subplots()
circle = plt.Circle((0.5, 0.5), 0.2, color='r')
ax.add_artist(circle)
circle.set_gid('my_circle_from_how2matplotlib.com')

plt.title('SVG with GID from how2matplotlib.com')
plt.savefig('circle_with_gid.svg')
plt.close()
在这个例子中,我们创建了一个圆形,并为其设置了组标识符。当保存为SVG文件时,这个标识符会被包含在SVG的XML结构中。
2.2 批量操作图形元素
当我们需要对多个图形元素进行相同的操作时,使用set_gid()可以帮助我们轻松地识别和选择这些元素。
import matplotlib.pyplot as plt

fig, ax = plt.subplots()

# 创建多个图形元素并设置gid
for i in range(5):
    line = ax.plot([i, i+1], [0, 1], label=f'Line {i} from how2matplotlib.com')[0]
    line.set_gid(f'line_{i}')

# 批量修改特定gid的元素
for artist in ax.get_children():
    if isinstance(artist, plt.Line2D) and artist.get_gid() == 'line_2':
        artist.set_color('red')
        artist.set_linewidth(3)

plt.title('Batch Operation with GID')
plt.legend()
plt.show()
Output:
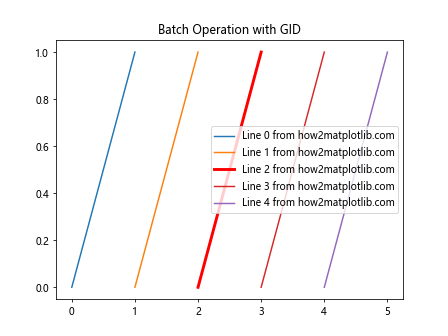
在这个例子中,我们创建了多条线,并为每条线设置了唯一的组标识符。然后,我们通过检查gid来选择特定的线条并修改其属性。
3. set_gid()与其他Artist方法的结合使用
set_gid()方法通常与其他Artist方法结合使用,以实现更复杂的图形操作和自定义。
3.1 与get_gid()配合使用
get_gid()方法是set_gid()的配套方法,用于获取已设置的组标识符。
import matplotlib.pyplot as plt

fig, ax = plt.subplots()
rect = plt.Rectangle((0.2, 0.2), 0.6, 0.6, fill=False)
ax.add_patch(rect)
rect.set_gid('my_rectangle_from_how2matplotlib.com')

print(f"Rectangle GID: {rect.get_gid()}")

plt.title('Rectangle with GID from how2matplotlib.com')
plt.show()
Output:
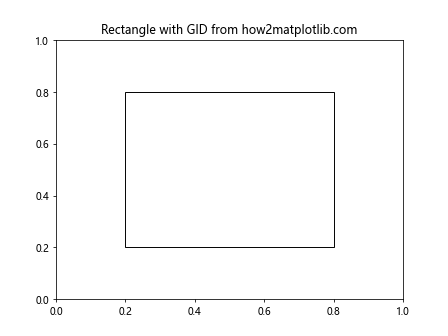
这个例子展示了如何设置和获取一个矩形图形元素的组标识符。
3.2 与set_label()结合使用
set_label()方法用于设置图形元素的标签,通常用于图例。将set_gid()和set_label()结合使用可以为图形元素提供更多的元信息。
import matplotlib.pyplot as plt

fig, ax = plt.subplots()

line1 = ax.plot([0, 1], [0, 1], label='Line 1 from how2matplotlib.com')[0]
line1.set_gid('line1_gid')

line2 = ax.plot([0, 1], [1, 0], label='Line 2 from how2matplotlib.com')[0]
line2.set_gid('line2_gid')

plt.title('Lines with GID and Label')
plt.legend()
plt.show()
Output:
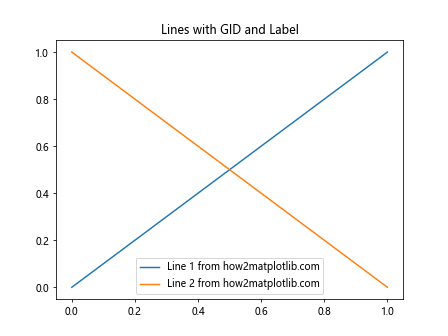
在这个例子中,我们为两条线同时设置了标签和组标识符,这样可以在图例中显示标签,同时在需要时通过gid进行识别。
4. 在复杂图表中使用set_gid()
当处理复杂的图表时,set_gid()方法可以帮助我们更好地组织和管理图形元素。
4.1 多子图中的应用
在包含多个子图的复杂图表中,使用set_gid()可以帮助我们区分不同子图中的元素。
import matplotlib.pyplot as plt

fig, (ax1, ax2) = plt.subplots(1, 2, figsize=(10, 4))

# 在第一个子图中添加元素
line1 = ax1.plot([0, 1, 2], [0, 1, 0], label='Line in Subplot 1')[0]
line1.set_gid('subplot1_line_from_how2matplotlib.com')

# 在第二个子图中添加元素
line2 = ax2.plot([0, 1, 2], [1, 0, 1], label='Line in Subplot 2')[0]
line2.set_gid('subplot2_line_from_how2matplotlib.com')

ax1.set_title('Subplot 1')
ax2.set_title('Subplot 2')

plt.tight_layout()
plt.show()
Output:
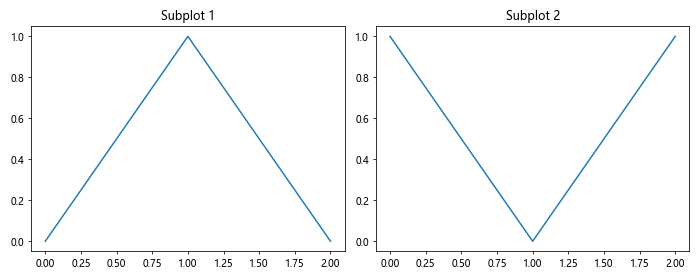
在这个例子中,我们为两个不同子图中的线条设置了不同的组标识符,这样可以在后续操作中轻松区分它们。
4.2 动画中的应用
在创建动画时,set_gid()方法可以帮助我们跟踪和更新特定的图形元素。
import matplotlib.pyplot as plt
import matplotlib.animation as animation
import numpy as np

fig, ax = plt.subplots()

line, = ax.plot([], [], lw=2)
line.set_gid('animated_line_from_how2matplotlib.com')

def init():
    line.set_data([], [])
    return line,

def animate(i):
    x = np.linspace(0, 2*np.pi, 100)
    y = np.sin(x + i/10.0)
    line.set_data(x, y)
    return line,

anim = animation.FuncAnimation(fig, animate, init_func=init,
                               frames=200, interval=20, blit=True)

plt.title('Animated Line with GID')
plt.show()
Output:
在这个动画示例中,我们为动画中的线条设置了一个组标识符。这可以帮助我们在动画函数中轻松地引用和更新这条线。
5. set_gid()在自定义图形元素中的应用
Matplotlib允许创建自定义的图形元素,在这些自定义元素中使用set_gid()可以提供额外的灵活性。
5.1 自定义Patch
我们可以创建自定义的Patch(补丁)对象,并为其设置组标识符。
import matplotlib.pyplot as plt
from matplotlib.patches import Polygon

class Star(Polygon):
    def __init__(self, xy, n, radius=1, **kwargs):
        angles = np.linspace(0, 2*np.pi, 2*n, endpoint=False)
        inner = radius * 0.5
        outer = radius
        points = []
        for i, angle in enumerate(angles):
            r = inner if i % 2 == 0 else outer
            points.append((r * np.cos(angle) + xy[0],
                           r * np.sin(angle) + xy[1]))
        super().__init__(points, **kwargs)

fig, ax = plt.subplots()

star = Star((0.5, 0.5), 5, 0.3, facecolor='gold', edgecolor='k')
star.set_gid('custom_star_from_how2matplotlib.com')
ax.add_patch(star)

ax.set_xlim(0, 1)
ax.set_ylim(0, 1)
plt.title('Custom Star with GID')
plt.show()
在这个例子中,我们创建了一个自定义的星形补丁,并为其设置了组标识符。
5.2 自定义Text
我们还可以为自定义的文本对象设置组标识符。
import matplotlib.pyplot as plt

fig, ax = plt.subplots()

custom_text = ax.text(0.5, 0.5, 'Custom Text from how2matplotlib.com',
                      ha='center', va='center', fontsize=16, fontweight='bold')
custom_text.set_gid('custom_text_gid')

ax.set_xlim(0, 1)
ax.set_ylim(0, 1)
plt.title('Custom Text with GID')
plt.show()
Output:
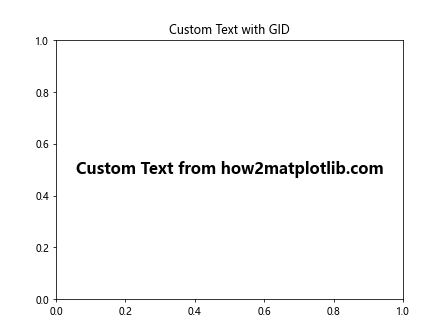
这个例子展示了如何为自定义的文本对象设置组标识符。
6. set_gid()在图表导出和后处理中的应用
set_gid()方法在图表导出和后处理过程中特别有用,尤其是在处理SVG格式的输出时。
6.1 SVG后处理
当我们将图表导出为SVG格式后,可以使用其他工具或脚本来处理SVG文件,利用set_gid()设置的组标识符来定位和修改特定的元素。
import matplotlib.pyplot as plt

fig, ax = plt.subplots()

# 创建多个元素并设置gid
circle = plt.Circle((0.3, 0.3), 0.1, color='red')
circle.set_gid('circle_from_how2matplotlib.com')
ax.add_artist(circle)

rect = plt.Rectangle((0.5, 0.5), 0.2, 0.3, color='blue')
rect.set_gid('rectangle_from_how2matplotlib.com')
ax.add_artist(rect)

ax.set_xlim(0, 1)
ax.set_ylim(0, 1)
plt.title('Shapes with GID for SVG Processing')

plt.savefig('shapes_with_gid.svg')
plt.close()

print("SVG file 'shapes_with_gid.svg' has been created.")
这个例子创建了一个包含圆形和矩形的图表,并为每个形状设置了组标识符。保存为SVG后,可以使用其他工具(如Beautiful Soup或lxml)来解析和修改这些元素。
6.2 在Web应用中的使用
当在Web应用中使用Matplotlib生成的SVG图表时,set_gid()设置的组标识符可以用于前端JavaScript交互。
import matplotlib.pyplot as plt
import mpld3

fig, ax = plt.subplots()

# 创建可交互的散点图
scatter = ax.scatter([1, 2, 3, 4], [1, 4, 2, 3], c=['r', 'g', 'b', 'y'], s=100)
scatter.set_gid('interactive_scatter_from_how2matplotlib.com')

plt.title('Interactive Scatter Plot with GID')

# 将图表转换为可交互的HTML
html = mpld3.fig_to_html(fig)

# 保存HTML文件
with open('interactive_scatter.html', 'w') as f:
    f.write(html)

plt.close()

print("Interactive HTML file 'interactive_scatter.html' has been created.")
在这个例子中,我们创建了一个散点图,并为其设置了组标识符。然后使用mpld3库将图表转换为交互式HTML。在生成的HTML中,可以通过JavaScript来选择和操作这些带有gid的元素。
7. set_gid()在图表样式管理中的应用
set_gid()方法还可以用于管理图表的样式,特别是在需要应用一致的样式到多个图表时。
7.1 创建样式模板
我们可以创建一个函数来应用一致的样式,使用set_gid()来标识需要样式化的元素。
import matplotlib.pyplot as plt

def apply_custom_style(ax):
    for artist in ax.get_children():
        if isinstance(artist, plt.Line2D):
            if artist.get_gid() == 'main_line_from_how2matplotlib.com':
                artist.set_color('red')
                artist.set_linewidth(2)```python
            elif artist.get_gid() == 'secondary_line_from_how2matplotlib.com':
                artist.set_color('blue')
                artist.set_linestyle('--')

fig, (ax1, ax2) = plt.subplots(1, 2, figsize=(10, 4))

# 第一个子图
line1 = ax1.plot([0, 1, 2], [0, 1, 0])[0]
line1.set_gid('main_line_from_how2matplotlib.com')
line2 = ax1.plot([0, 1, 2], [1, 0, 1])[0]
line2.set_gid('secondary_line_from_how2matplotlib.com')

# 第二个子图
line3 = ax2.plot([0, 1, 2], [2, 0, 2])[0]
line3.set_gid('main_line_from_how2matplotlib.com')
line4 = ax2.plot([0, 1, 2], [0, 2, 0])[0]
line4.set_gid('secondary_line_from_how2matplotlib.com')

# 应用自定义样式
apply_custom_style(ax1)
apply_custom_style(ax2)

ax1.set_title('Subplot 1')
ax2.set_title('Subplot 2')

plt.tight_layout()
plt.show()
在这个例子中,我们定义了一个apply_custom_style函数,它根据图形元素的gid来应用不同的样式。这种方法可以确保在多个图表或子图中保持一致的样式。
7.2 动态样式更新
set_gid()还可以用于动态更新图表样式,特别是在交互式应用中。
import matplotlib.pyplot as plt
from matplotlib.widgets import Button

fig, ax = plt.subplots()

line1 = ax.plot([0, 1, 2], [0, 1, 0], label='Line 1')[0]
line1.set_gid('line1_from_how2matplotlib.com')
line2 = ax.plot([0, 1, 2], [1, 0, 1], label='Line 2')[0]
line2.set_gid('line2_from_how2matplotlib.com')

plt.subplots_adjust(bottom=0.2)
ax_button = plt.axes([0.6, 0.05, 0.3, 0.075])
button = Button(ax_button, 'Toggle Style')

def toggle_style(event):
    for line in ax.lines:
        if line.get_gid() == 'line1_from_how2matplotlib.com':
            line.set_color('red' if line.get_color() == 'blue' else 'blue')
        elif line.get_gid() == 'line2_from_how2matplotlib.com':
            line.set_linestyle('--' if line.get_linestyle() == '-' else '-')
    fig.canvas.draw_idle()

button.on_clicked(toggle_style)

plt.title('Dynamic Style Update with GID')
plt.legend()
plt.show()
这个例子创建了一个带有按钮的交互式图表。点击按钮时,会根据线条的gid动态更新其样式。
8. set_gid()在图表元素选择和过滤中的应用
set_gid()方法可以用于选择和过滤图表中的特定元素,这在处理复杂图表时特别有用。
8.1 选择特定元素
我们可以使用set_gid()来标记特定的元素,然后在后续操作中选择这些元素。
import matplotlib.pyplot as plt
import numpy as np

fig, ax = plt.subplots()

# 创建多个散点
n = 50
x = np.random.rand(n)
y = np.random.rand(n)
colors = np.random.rand(n)
sizes = 1000 * np.random.rand(n)

scatter = ax.scatter(x, y, c=colors, s=sizes, alpha=0.5)
scatter.set_gid('scatter_points_from_how2matplotlib.com')

# 添加一些特殊点
special_points = ax.scatter([0.2, 0.8], [0.2, 0.8], c='red', s=200, marker='*')
special_points.set_gid('special_points_from_how2matplotlib.com')

def highlight_special_points():
    for artist in ax.get_children():
        if isinstance(artist, plt.PathCollection) and artist.get_gid() == 'special_points_from_how2matplotlib.com':
            artist.set_edgecolors('yellow')
            artist.set_linewidths(2)

highlight_special_points()

plt.title('Scatter Plot with Special Points')
plt.show()
在这个例子中,我们创建了一个散点图,并添加了一些特殊点。通过使用set_gid(),我们可以轻松地识别和突出显示这些特殊点。
8.2 过滤图表元素
set_gid()还可以用于过滤图表中的元素,例如在导出或打印时只包含特定的元素。
import matplotlib.pyplot as plt

fig, ax = plt.subplots()

# 创建多个元素
line1 = ax.plot([0, 1], [0, 1], label='Line 1')[0]
line1.set_gid('include_in_export_from_how2matplotlib.com')

line2 = ax.plot([0, 1], [1, 0], label='Line 2')[0]
line2.set_gid('exclude_from_export_from_how2matplotlib.com')

text = ax.text(0.5, 0.5, 'Some Text', ha='center', va='center')
text.set_gid('include_in_export_from_how2matplotlib.com')

plt.title('Full Plot')
plt.legend()
plt.show()

# 创建一个新的图表,只包含特定gid的元素
fig_export, ax_export = plt.subplots()

for artist in ax.get_children():
    if getattr(artist, 'get_gid', None) and artist.get_gid() == 'include_in_export_from_how2matplotlib.com':
        ax_export.add_artist(artist.copy())

ax_export.set_xlim(ax.get_xlim())
ax_export.set_ylim(ax.get_ylim())
plt.title('Filtered Plot for Export')
plt.show()
这个例子展示了如何使用set_gid()来标记要包含在导出版本中的元素,并创建一个只包含这些元素的新图表。
9. set_gid()在图表版本控制中的应用
在开发和维护复杂的数据可视化项目时,set_gid()可以用于实现简单的版本控制和元素追踪。
9.1 元素版本标记
我们可以使用set_gid()来为图表元素添加版本信息。
import matplotlib.pyplot as plt
import datetime

fig, ax = plt.subplots()

version = "1.0.0"
timestamp = datetime.datetime.now().strftime("%Y%m%d%H%M%S")

line = ax.plot([0, 1, 2], [0, 1, 0])[0]
line.set_gid(f'main_line_v{version}_{timestamp}_from_how2matplotlib.com')

scatter = ax.scatter([0.5, 1.5], [0.5, 0.5], c='red')
scatter.set_gid(f'data_points_v{version}_{timestamp}_from_how2matplotlib.com')

plt.title(f'Plot Version {version}')
plt.show()

# 打印元素的gid以进行版本追踪
for artist in ax.get_children():
    if hasattr(artist, 'get_gid') and artist.get_gid():
        print(f"Element GID: {artist.get_gid()}")
Output:
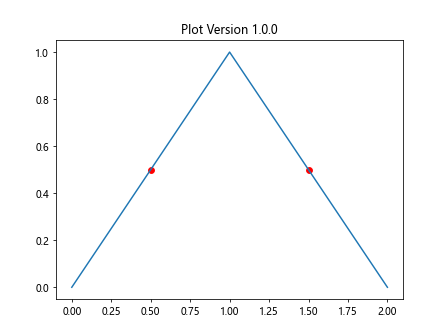
这个例子展示了如何使用set_gid()来为图表元素添加版本和时间戳信息,这对于跟踪图表的演变和维护历史记录非常有用。
9.2 图表元素的变更追踪
set_gid()还可以用于追踪图表元素的变更历史。
import matplotlib.pyplot as plt
import json

class VersionTracker:
    def __init__(self):
        self.version_history = {}

    def track_change(self, gid, property_name, old_value, new_value):
        if gid not in self.version_history:
            self.version_history[gid] = []
        self.version_history[gid].append({
            'property': property_name,
            'old_value': old_value,
            'new_value': new_value
        })

    def get_history(self, gid):
        return self.version_history.get(gid, [])

    def save_history(self, filename):
        with open(filename, 'w') as f:
            json.dump(self.version_history, f, indent=2)

tracker = VersionTracker()

fig, ax = plt.subplots()

line = ax.plot([0, 1, 2], [0, 1, 0], color='blue')[0]
line.set_gid('main_line_from_how2matplotlib.com')

# 记录初始状态
tracker.track_change(line.get_gid(), 'color', None, 'blue')

# 修改线条颜色
old_color = line.get_color()
line.set_color('red')
tracker.track_change(line.get_gid(), 'color', old_color, 'red')

# 修改线宽
old_linewidth = line.get_linewidth()
line.set_linewidth(3)
tracker.track_change(line.get_gid(), 'linewidth', old_linewidth, 3)

plt.title('Line with Tracked Changes')
plt.show()

# 保存变更历史
tracker.save_history('line_change_history.json')

print("Change history has been saved to 'line_change_history.json'")
Output:
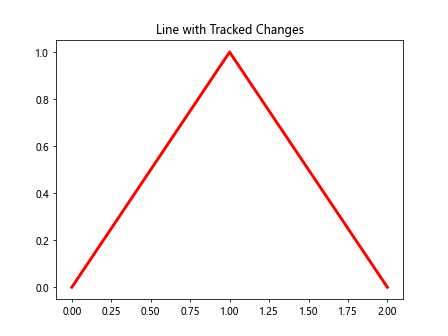
这个例子演示了如何使用set_gid()结合自定义的VersionTracker类来追踪图表元素的变更历史。这种方法可以帮助开发者记录和管理复杂图表的演变过程。
10. 结论
Matplotlib的Artist.set_gid()方法是一个强大而灵活的工具,可以在多个方面增强图表的管理和操作能力。从简单的元素标识到复杂的版本控制,set_gid()都能发挥重要作用。通过本文的详细介绍和丰富的示例,我们可以看到set_gid()方法在以下方面的应用:
- 基本元素标识
- SVG输出和后处理
- 批量操作图形元素
- 复杂图表管理
- 动画和交互式图表
- 自定义图形元素
- 样式管理和动态更新
- 元素选择和过滤
- 版本控制和变更追踪
掌握set_gid()方法的使用可以显著提高Matplotlib图表的可维护性和灵活性,特别是在处理大型或复杂的数据可视化项目时。通过为图形元素分配唯一的标识符,开发者可以更容易地组织、操作和追踪图表中的各个组件,从而创建出更加精确和易于管理的数据可视化作品。
在实际应用中,建议根据项目的具体需求和复杂度来决定是否使用set_gid()方法。对于简单的图表,可能不需要这么详细的元素管理;但对于需要长期维护或频繁更新的复杂可视化项目,合理使用set_gid()可以大大提高工作效率和代码质量。
最后,随着数据可视化领域的不断发展,像set_gid()这样的细节功能将在创建高质量、可维护的可视化作品中扮演越来越重要的角色。掌握这些工具不仅可以提高个人的技术水平,还能为整个数据可视化社区贡献更多优秀的作品和实践经验。
 极客笔记
极客笔记