Matplotlib中使用Artist.set_label()方法设置图形元素标签
参考:Matplotlib.artist.Artist.set_label() in Python
Matplotlib是Python中最流行的数据可视化库之一,它提供了丰富的绘图功能和灵活的自定义选项。在Matplotlib中,几乎所有可见的图形元素都是Artist对象的实例。Artist类是Matplotlib中的基础类,它定义了许多通用的属性和方法,其中set_label()方法是一个非常有用的功能,用于为图形元素设置标签。本文将深入探讨Artist.set_label()方法的使用,并通过多个示例来展示其在不同场景下的应用。
1. Artist.set_label()方法简介
Artist.set_label()是Matplotlib中Artist类的一个方法,用于为图形元素设置标签。这个标签可以用于图例、工具提示或其他标识目的。标签通常是一个字符串,用于描述或识别特定的图形元素。
基本语法
artist.set_label(label)
其中,artist是任何Artist对象的实例,label是要设置的标签字符串。
示例:为线条设置标签
import matplotlib.pyplot as plt
import numpy as np

x = np.linspace(0, 10, 100)
y = np.sin(x)

fig, ax = plt.subplots()
line, = ax.plot(x, y)
line.set_label('Sine Wave - how2matplotlib.com')

ax.legend()
plt.title('Simple Sine Wave with Label')
plt.show()
Output:
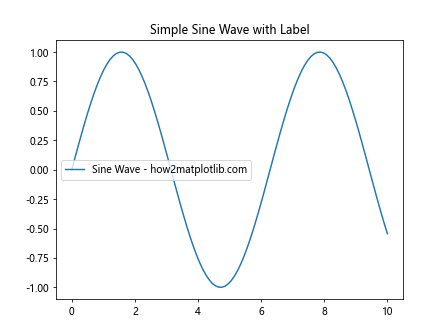
在这个示例中,我们创建了一个简单的正弦波图,并使用set_label()方法为线条设置了标签。通过调用ax.legend(),我们可以显示包含这个标签的图例。
2. 为不同类型的Artist对象设置标签
Matplotlib中的Artist对象包括线条、标记、文本、矩形等多种类型。我们可以为这些不同类型的对象设置标签,以便在图例或其他地方使用。
2.1 为散点图设置标签
import matplotlib.pyplot as plt
import numpy as np

x = np.random.rand(50)
y = np.random.rand(50)

fig, ax = plt.subplots()
scatter = ax.scatter(x, y, c='red', s=50)
scatter.set_label('Random Points - how2matplotlib.com')

ax.legend()
plt.title('Scatter Plot with Label')
plt.show()
Output:
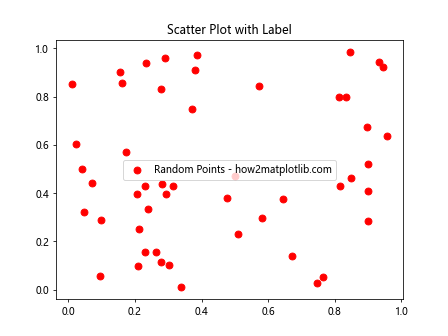
在这个例子中,我们创建了一个散点图,并为散点集合设置了标签。这个标签将出现在图例中。
2.2 为柱状图设置标签
import matplotlib.pyplot as plt
import numpy as np

categories = ['A', 'B', 'C', 'D']
values = [3, 7, 2, 5]

fig, ax = plt.subplots()
bars = ax.bar(categories, values)
for bar in bars:
    bar.set_label(f'Bar {bar.get_x()} - how2matplotlib.com')

ax.legend()
plt.title('Bar Chart with Labels')
plt.show()
Output:
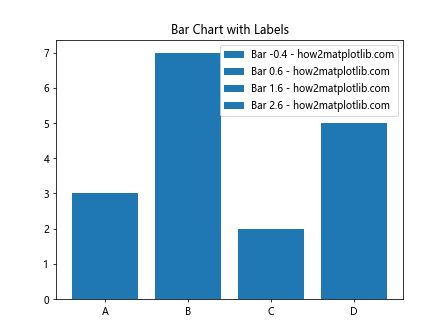
这个示例展示了如何为柱状图的每个柱子设置不同的标签。注意,我们需要遍历每个柱子对象来单独设置标签。
2.3 为文本对象设置标签
import matplotlib.pyplot as plt

fig, ax = plt.subplots()
text = ax.text(0.5, 0.5, 'Sample Text', ha='center', va='center')
text.set_label('Text Label - how2matplotlib.com')

ax.legend()
plt.title('Text with Label')
plt.axis('off')
plt.show()
Output:
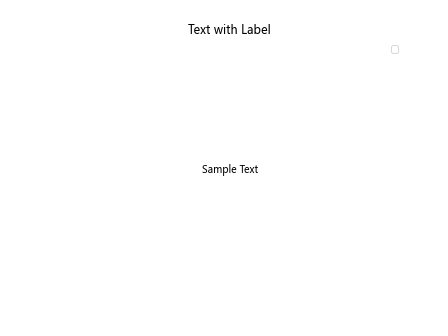
这个例子展示了如何为文本对象设置标签。虽然文本对象通常不会出现在图例中,但设置标签可以用于其他目的,如交互式工具提示。
3. 使用set_label()方法的高级技巧
3.1 动态更新标签
有时,我们可能需要根据数据或其他条件动态更新图形元素的标签。set_label()方法允许我们在绘图过程中随时更改标签。
import matplotlib.pyplot as plt
import numpy as np

x = np.linspace(0, 10, 100)
y = np.sin(x)

fig, ax = plt.subplots()
line, = ax.plot(x, y)
line.set_label('Initial Label - how2matplotlib.com')

ax.legend()
plt.title('Dynamic Label Update')

# 模拟数据更新
for i in range(5):
    y = np.sin(x + i)
    line.set_ydata(y)
    line.set_label(f'Updated Label {i} - how2matplotlib.com')
    ax.legend()
    plt.pause(1)

plt.show()
Output:
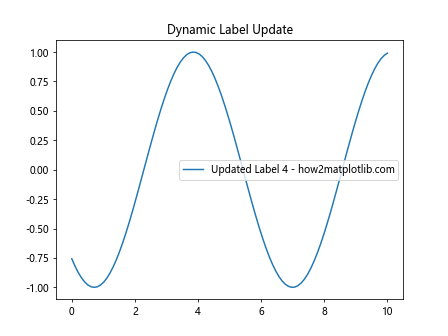
这个示例展示了如何在动画或实时数据更新的场景中动态更新线条的标签。
3.2 使用格式化字符串
我们可以使用格式化字符串来创建更复杂的标签,包含变量值或其他动态信息。
import matplotlib.pyplot as plt
import numpy as np

x = np.linspace(0, 10, 100)
amplitude = 2
frequency = 0.5
y = amplitude * np.sin(frequency * x)

fig, ax = plt.subplots()
line, = ax.plot(x, y)
line.set_label(f'A={amplitude}, f={frequency} - how2matplotlib.com')

ax.legend()
plt.title('Sine Wave with Formatted Label')
plt.show()
Output:
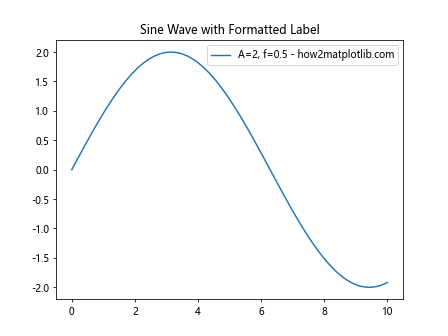
在这个例子中,我们使用格式化字符串在标签中包含了正弦波的振幅和频率信息。
3.3 使用LaTeX格式的标签
Matplotlib支持在标签中使用LaTeX格式,这对于显示数学公式特别有用。
import matplotlib.pyplot as plt
import numpy as np

x = np.linspace(0, 10, 100)
y = np.sin(x)

fig, ax = plt.subplots()
line, = ax.plot(x, y)
line.set_label(r'y = \sin(x) - how2matplotlib.com')

ax.legend()
plt.title('Sine Wave with LaTeX Label')
plt.show()
Output:
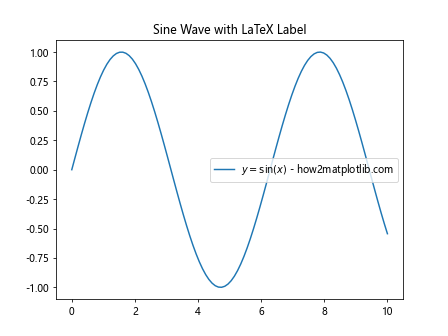
这个示例展示了如何使用LaTeX格式在标签中显示数学公式。注意字符串前的r前缀,它表示这是一个原始字符串,防止反斜杠被转义。
4. set_label()方法与其他Matplotlib功能的结合
4.1 与图例的结合使用
set_label()方法最常见的用途是与图例结合使用。通过为不同的图形元素设置标签,我们可以创建信息丰富的图例。
import matplotlib.pyplot as plt
import numpy as np

x = np.linspace(0, 10, 100)
y1 = np.sin(x)
y2 = np.cos(x)

fig, ax = plt.subplots()
line1, = ax.plot(x, y1, 'r-')
line2, = ax.plot(x, y2, 'b--')

line1.set_label('Sine - how2matplotlib.com')
line2.set_label('Cosine - how2matplotlib.com')

ax.legend(loc='upper right')
plt.title('Sine and Cosine with Legend')
plt.show()
Output:
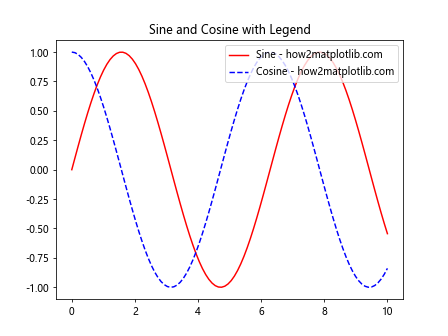
这个例子展示了如何为多条线设置不同的标签,并在图例中显示它们。
4.2 与子图的结合使用
当使用子图时,我们可以为每个子图中的元素单独设置标签。
import matplotlib.pyplot as plt
import numpy as np

x = np.linspace(0, 10, 100)
y1 = np.sin(x)
y2 = np.cos(x)

fig, (ax1, ax2) = plt.subplots(1, 2, figsize=(10, 4))

line1, = ax1.plot(x, y1, 'r-')
line1.set_label('Sine - how2matplotlib.com')
ax1.legend()
ax1.set_title('Sine Wave')

line2, = ax2.plot(x, y2, 'b--')
line2.set_label('Cosine - how2matplotlib.com')
ax2.legend()
ax2.set_title('Cosine Wave')

plt.tight_layout()
plt.show()
Output:
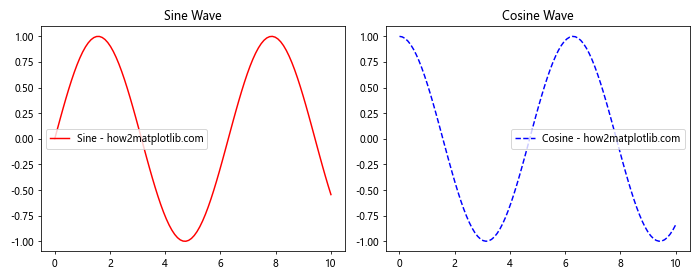
这个示例展示了如何在包含多个子图的图形中为每个子图的元素设置标签。
4.3 与颜色映射的结合使用
当使用颜色映射时,我们可以为不同颜色的元素设置标签。
import matplotlib.pyplot as plt
import numpy as np

x = np.random.rand(50)
y = np.random.rand(50)
colors = np.random.rand(50)

fig, ax = plt.subplots()
scatter = ax.scatter(x, y, c=colors, cmap='viridis')
scatter.set_label('Colored Points - how2matplotlib.com')

ax.legend()
plt.colorbar(scatter)
plt.title('Scatter Plot with Colormap and Label')
plt.show()
Output:
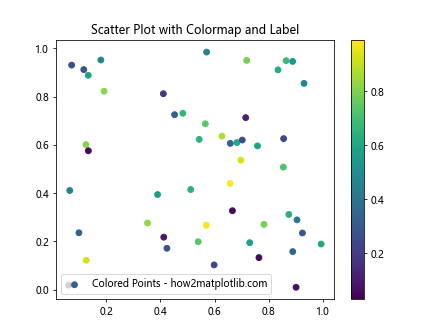
这个例子展示了如何为使用颜色映射的散点图设置标签,并同时显示颜色条。
5. set_label()方法的常见问题和解决方案
5.1 标签不显示在图例中
有时,即使设置了标签,图例中也可能不显示。这通常是因为忘记调用legend()方法或图例被其他元素遮挡。
解决方案:
import matplotlib.pyplot as plt
import numpy as np

x = np.linspace(0, 10, 100)
y = np.sin(x)

fig, ax = plt.subplots()
line, = ax.plot(x, y)
line.set_label('Sine Wave - how2matplotlib.com')

# 确保调用legend()方法
ax.legend()

# 如果图例被遮挡,可以尝试调整位置
# ax.legend(loc='upper left')

plt.title('Sine Wave with Visible Legend')
plt.show()
Output:
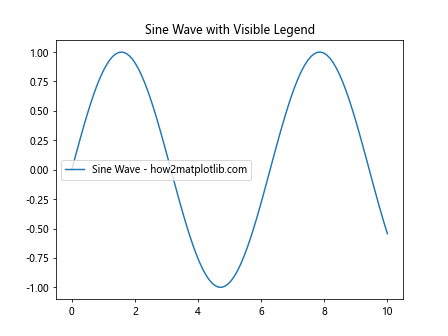
这个示例确保了图例被正确显示,并提供了调整图例位置的选项。
5.2 多个元素使用相同的标签
当多个图形元素使用相同的标签时,图例可能会显示重复的条目。
解决方案:
import matplotlib.pyplot as plt
import numpy as np

x = np.linspace(0, 10, 100)
y1 = np.sin(x)
y2 = np.sin(x + np.pi/4)
y3 = np.sin(x + np.pi/2)

fig, ax = plt.subplots()
lines = ax.plot(x, y1, 'r-', x, y2, 'g--', x, y3, 'b:')

# 为每条线设置不同的标签
lines[0].set_label('Phase 0 - how2matplotlib.com')
lines[1].set_label('Phase π/4 - how2matplotlib.com')
lines[2].set_label('Phase π/2 - how2matplotlib.com')

ax.legend()
plt.title('Multiple Sine Waves with Unique Labels')
plt.show()
Output:
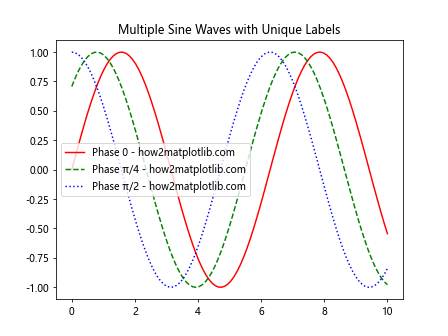
这个例子展示了如何为多个相似的元素设置不同的标签,以避免图例中的重复。
5.3 标签文本过长
当标签文本过长时,可能会导致图例溢出图形边界或变得难以阅读。
解决方案:
import matplotlib.pyplot as plt
import numpy as np

x = np.linspace(0, 10, 100)
y1 = np.sin(x)
y2 = np.cos(x)

fig, ax = plt.subplots()
line1, = ax.plot(x, y1, 'r-')
line2, = ax.plot(x, y2, 'b--')

long_label1 = 'This is a very long label for the sine wave - how2matplotlib.com'
long_label2 = 'This is another very long label for the cosine wave - how2matplotlib.com'

line1.set_label(long_label1)
line2.set_label(long_label2)

# 使用小字体和多列来处理长标签
ax.legend(fontsize='small', ncol=2)

plt.title('Handling Long Labels in Legend')
plt.show()
Output:
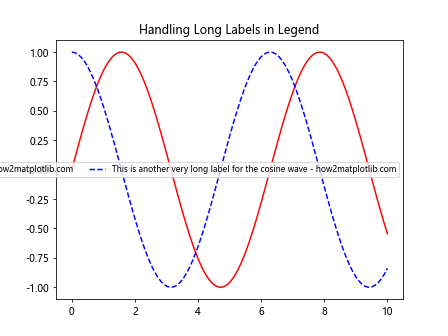
这个示例展示了如何通过调整字体大小和使用多列布局来处理长标签。
6. set_label()方法在不同类型图表中的应用
6.1 在饼图中使用set_label()
饼图是另一种常见的图表类型,我们可以为每个扇形设置标签。
import matplotlib.pyplot as plt

sizes = [30, 20, 25, 15, 10]
labels = ['A', 'B', 'C', 'D', 'E']

fig, ax = plt.subplots()
wedges, texts, autotexts = ax.pie(sizes, autopct='%1.1f%%', startangle=90)

for i, wedge in enumerate(wedges):
    wedge.set_label(f'{labels[i]} - how2matplotlib.com')

ax.legend(title="Categories")
plt.title('Pie Chart with Custom Labels')
plt.show()
Output:
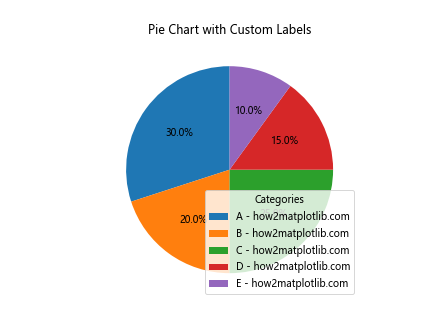
这个例子展示了如何在饼图中为每个扇形设置自定义标签,并在图例中显示这些标签。
6.2 在箱线图中使用set_label()
箱线图通常用于显示数据分布,我们可以为每个箱子设置标签。
import matplotlib.pyplot as plt
import numpy as np

data = [np.random.normal(0, std, 100) for std in range(1, 4)]

fig, ax = plt.subplots()
bplot = ax.boxplot(data)

for i, box in enumerate(bplot['boxes']):
    box.set_label(f'Distribution {i+1} - how2matplotlib.com')ax.legend()
plt.title('Box Plot with Custom Labels')
plt.show()
这个示例展示了如何为箱线图中的每个箱子设置自定义标签,并在图例中显示这些标签。
6.3 在热图中使用set_label()
虽然热图本身通常不使用图例,但我们可以为整个热图设置一个标签,这在比较多个热图时可能有用。
import matplotlib.pyplot as plt
import numpy as np

data = np.random.rand(10, 10)

fig, ax = plt.subplots()
im = ax.imshow(data, cmap='viridis')
im.set_label('Random Heat Map - how2matplotlib.com')

plt.colorbar(im)
ax.legend()
plt.title('Heat Map with Label')
plt.show()
这个例子展示了如何为热图设置标签,虽然在单个热图中可能不常用,但在比较多个热图时可能会有帮助。
7. set_label()方法与交互式图表的结合
7.1 在动态更新的图表中使用set_label()
在创建动态更新的图表时,我们可能需要根据数据的变化来更新标签。
import matplotlib.pyplot as plt
import numpy as np

fig, ax = plt.subplots()
x = np.linspace(0, 10, 100)
line, = ax.plot(x, np.sin(x))
line.set_label('Initial Sine Wave - how2matplotlib.com')

ax.legend()
plt.title('Dynamic Label Update')

for i in range(5):
    y = np.sin(x + i * np.pi / 4)
    line.set_ydata(y)
    line.set_label(f'Sine Wave (Phase: {i*45}°) - how2matplotlib.com')
    ax.legend()
    plt.pause(1)

plt.show()
Output:
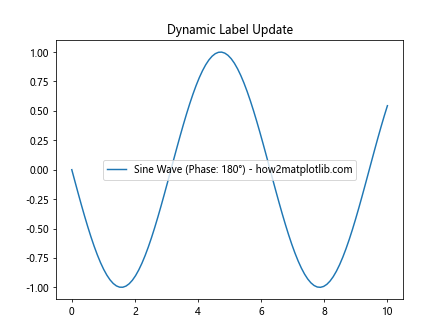
这个示例展示了如何在动态更新的图表中实时更新线条的标签。
7.2 在交互式工具提示中使用标签信息
我们可以利用set_label()设置的标签信息来创建更丰富的交互式工具提示。
import matplotlib.pyplot as plt
import numpy as np
from matplotlib.widgets import Cursor

x = np.linspace(0, 10, 100)
y1 = np.sin(x)
y2 = np.cos(x)

fig, ax = plt.subplots()
line1, = ax.plot(x, y1, 'r-')
line2, = ax.plot(x, y2, 'b--')

line1.set_label('Sine - how2matplotlib.com')
line2.set_label('Cosine - how2matplotlib.com')

ax.legend()

def on_hover(event):
    if event.inaxes:
        for line in ax.get_lines():
            if line.contains(event)[0]:
                ax.set_title(f'Hovering over: {line.get_label()}')
                fig.canvas.draw_idle()
                return

fig.canvas.mpl_connect('motion_notify_event', on_hover)

plt.title('Hover over lines to see labels')
plt.show()
Output:
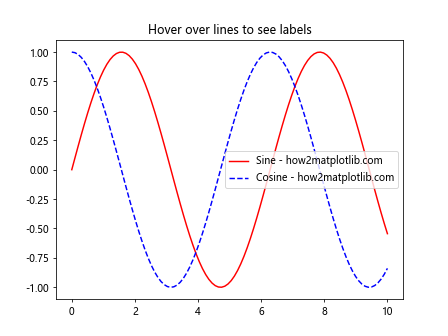
这个例子展示了如何使用set_label()设置的标签信息来创建交互式的悬停效果,当鼠标悬停在线条上时,标题会显示该线条的标签。
8. set_label()方法在自定义图例中的应用
8.1 创建自定义图例
有时,我们可能需要创建一个完全自定义的图例,而不是使用Matplotlib的默认图例。在这种情况下,set_label()方法设置的标签可以作为重要的信息源。
import matplotlib.pyplot as plt
import numpy as np

x = np.linspace(0, 10, 100)
y1 = np.sin(x)
y2 = np.cos(x)

fig, ax = plt.subplots()
line1, = ax.plot(x, y1, 'r-')
line2, = ax.plot(x, y2, 'b--')

line1.set_label('Sine - how2matplotlib.com')
line2.set_label('Cosine - how2matplotlib.com')

# 创建自定义图例
legend_elements = [
    plt.Line2D([0], [0], color='r', linestyle='-', label=line1.get_label()),
    plt.Line2D([0], [0], color='b', linestyle='--', label=line2.get_label())
]

ax.legend(handles=legend_elements, loc='upper right', title='Custom Legend')
plt.title('Plot with Custom Legend')
plt.show()
Output:

这个示例展示了如何使用set_label()设置的标签来创建一个完全自定义的图例。
8.2 在图例中组合多种类型的Artist对象
当图表包含多种类型的Artist对象时(如线条、散点和柱状图),我们可以创建一个包含所有这些元素的自定义图例。
import matplotlib.pyplot as plt
import numpy as np

x = np.linspace(0, 10, 100)
y1 = np.sin(x)
y2 = np.random.rand(10)
y3 = np.random.rand(5)

fig, ax = plt.subplots()
line, = ax.plot(x, y1, 'r-')
scatter = ax.scatter(np.random.rand(10)*10, y2, c='g')
bars = ax.bar(range(5), y3, color='b', alpha=0.5)

line.set_label('Line - how2matplotlib.com')
scatter.set_label('Scatter - how2matplotlib.com')
bars[0].set_label('Bars - how2matplotlib.com')

# 创建包含多种类型的自定义图例
legend_elements = [
    plt.Line2D([0], [0], color='r', lw=2, label=line.get_label()),
    plt.Line2D([0], [0], marker='o', color='w', markerfacecolor='g', markersize=10, label=scatter.get_label()),
    plt.Rectangle((0,0), 1, 1, fc='b', alpha=0.5, label=bars[0].get_label())
]

ax.legend(handles=legend_elements, loc='upper right')
plt.title('Combined Plot with Custom Legend')
plt.show()
Output:
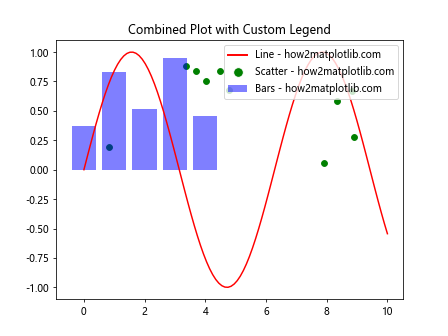
这个例子展示了如何创建一个包含线条、散点和柱状图的自定义图例,利用set_label()方法为每种类型的元素设置标签。
9. set_label()方法在数据分析和可视化工作流中的应用
9.1 在数据探索过程中动态设置标签
在数据分析过程中,我们可能需要根据数据的特征动态设置图形元素的标签。
import matplotlib.pyplot as plt
import numpy as np

# 模拟数据集
np.random.seed(42)
data = np.random.randn(100, 2)

fig, ax = plt.subplots()
scatter = ax.scatter(data[:, 0], data[:, 1])

# 根据数据特征设置标签
mean_x = np.mean(data[:, 0])
mean_y = np.mean(data[:, 1])
scatter.set_label(f'Mean: ({mean_x:.2f}, {mean_y:.2f}) - how2matplotlib.com')

ax.legend()
plt.title('Data Exploration with Dynamic Label')
plt.show()
Output:
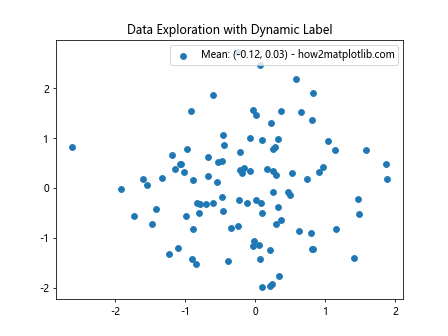
这个示例展示了如何在数据探索过程中根据数据的统计特征动态设置散点图的标签。
9.2 在多数据集比较中使用标签
当比较多个数据集时,为每个数据集设置描述性标签可以提高可视化的可读性。
import matplotlib.pyplot as plt
import numpy as np

# 生成多个数据集
np.random.seed(42)
datasets = [np.random.randn(100) for _ in range(3)]

fig, ax = plt.subplots()
positions = range(1, len(datasets) + 1)

box_plots = ax.boxplot(datasets, positions=positions)

# 为每个箱线图设置标签
for i, box in enumerate(box_plots['boxes']):
    median = np.median(datasets[i])
    box.set_label(f'Dataset {i+1} (Median: {median:.2f}) - how2matplotlib.com')

ax.legend()
plt.title('Comparison of Multiple Datasets')
plt.show()
Output:
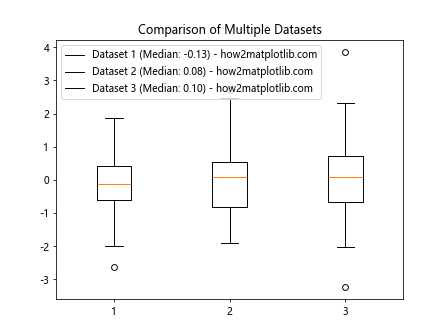
这个例子展示了如何在比较多个数据集时为每个箱线图设置包含统计信息的标签。
10. set_label()方法的高级技巧和最佳实践
10.1 使用函数式编程设置标签
对于复杂的图表,我们可以使用函数式编程方法来设置标签,这可以使代码更加模块化和可维护。
import matplotlib.pyplot as plt
import numpy as np

def create_labeled_line(ax, x, y, color, label_prefix):
    line, = ax.plot(x, y, color=color)
    max_y = np.max(y)
    line.set_label(f'{label_prefix} (Max: {max_y:.2f}) - how2matplotlib.com')
    return line

x = np.linspace(0, 10, 100)
fig, ax = plt.subplots()

lines = [
    create_labeled_line(ax, x, np.sin(x), 'r', 'Sine'),
    create_labeled_line(ax, x, np.cos(x), 'b', 'Cosine'),
    create_labeled_line(ax, x, np.tan(x), 'g', 'Tangent')
]

ax.legend()
plt.title('Multiple Trigonometric Functions')
plt.show()
Output:
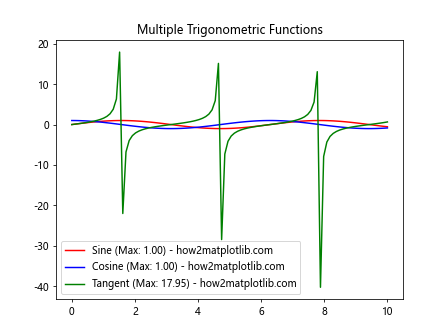
这个示例展示了如何使用函数式编程方法来创建带有标签的线条,使代码更加模块化。
10.2 使用字典管理标签
对于包含多个元素的复杂图表,使用字典来管理标签可以提高代码的可读性和可维护性。
import matplotlib.pyplot as plt
import numpy as np

x = np.linspace(0, 10, 100)
data = {
    'Sine': np.sin(x),
    'Cosine': np.cos(x),
    'Tangent': np.tan(x)
}

fig, ax = plt.subplots()
lines = {}

for name, y in data.items():
    line, = ax.plot(x, y)
    lines[name] = line
    line.set_label(f'{name} - how2matplotlib.com')

ax.legend()
plt.title('Multiple Trigonometric Functions')
plt.show()
Output:
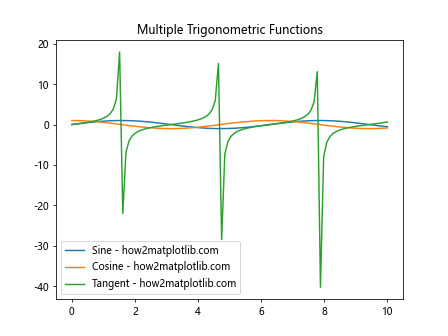
这个例子展示了如何使用字典来管理多个图形元素及其标签,使代码更加结构化。
10.3 动态更新图例
在某些情况下,我们可能需要根据用户交互或数据变化动态更新图例。
import matplotlib.pyplot as plt
import numpy as np

x = np.linspace(0, 10, 100)
y = np.sin(x)

fig, ax = plt.subplots()
line, = ax.plot(x, y)
line.set_label('Initial Label - how2matplotlib.com')

legend = ax.legend()

def update_legend(event):
    if event.key == 'u':
        new_label = f'Updated at {plt.gcf().canvas.manager.num} - how2matplotlib.com'
        line.set_label(new_label)
        legend.get_texts()[0].set_text(new_label)
        fig.canvas.draw()

fig.canvas.mpl_connect('key_press_event', update_legend)

plt.title('Press "u" to update the legend')
plt.show()
Output:
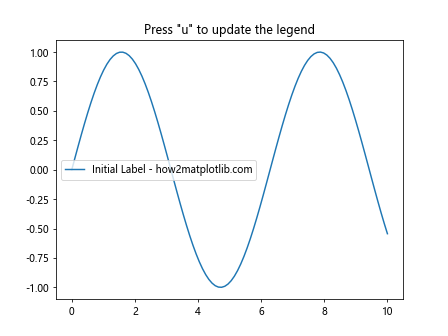
这个示例展示了如何通过键盘事件动态更新图例中的标签。
结论:
Artist.set_label()方法是Matplotlib中一个强大而灵活的工具,它允许我们为图形元素设置描述性标签,这些标签可以用于图例、工具提示或其他标识目的。通过本文的详细探讨和多个示例,我们看到了set_label()方法在各种场景下的应用,从基本的线图到复杂的交互式可视化。
掌握set_label()方法不仅可以帮助我们创建更加信息丰富和易于理解的图表,还能提高我们的数据可视化工作流程的效率。无论是在数据探索、结果展示还是创建交互式图表时,灵活运用set_label()方法都能为我们的可视化工作带来显著的提升。
随着数据可视化在各个领域的重要性不断增加,深入理解和熟练使用像set_label()这样的基础方法变得越来越重要。通过不断实践和探索,我们可以充分发挥Matplotlib的潜力,创造出既美观又富有洞察力的数据可视化作品。
 极客笔记
极客笔记