Matplotlib中的Artist.set_animated()方法:提升动画效率的关键
参考:Matplotlib.artist.Artist.set_animated() in Python
Matplotlib是Python中最流行的数据可视化库之一,它提供了丰富的绘图功能和灵活的API。在Matplotlib中,Artist是所有可视化元素的基类,包括线条、文本、图像等。本文将深入探讨Artist类中的set_animated()方法,这是一个用于优化动画性能的重要工具。
1. Artist.set_animated()方法简介
set_animated()方法是Matplotlib中Artist类的一个重要方法,它用于设置Artist对象的动画状态。当一个Artist被设置为animated状态时,Matplotlib会对其进行特殊处理,以提高动画的效率。
1.1 基本语法
import matplotlib.pyplot as plt
import numpy as np

fig, ax = plt.subplots()
line, = ax.plot(np.random.rand(10), label='how2matplotlib.com')
line.set_animated(True)

plt.title('Set Animated Example')
plt.legend()
plt.show()
Output:
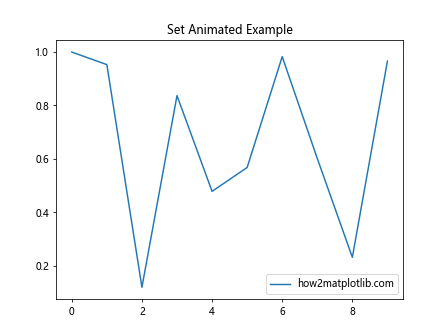
在这个例子中,我们创建了一个简单的线条图,并将线条对象设置为animated状态。这告诉Matplotlib,这个线条可能会在动画中频繁更新。
1.2 方法参数
set_animated()方法接受一个布尔值参数:
- True:将Artist对象设置为animated状态
- False:将Artist对象设置为非animated状态(默认)
2. set_animated()方法的工作原理
当一个Artist被设置为animated状态时,Matplotlib会采取以下策略来优化性能:
- 跳过不必要的重绘:animated的Artist不会在每次draw()调用时重新绘制。
- 使用缓存:Matplotlib会缓存animated Artist的渲染结果,以便快速重用。
- 局部更新:只更新发生变化的部分,而不是整个图形。
2.1 示例:对比animated和非animated的性能
import matplotlib.pyplot as plt
import numpy as np
import time

fig, (ax1, ax2) = plt.subplots(1, 2, figsize=(10, 5))

# Non-animated line
line1, = ax1.plot([], [], 'r-', label='how2matplotlib.com')
ax1.set_xlim(0, 100)
ax1.set_ylim(0, 1)
ax1.set_title('Non-animated')

# Animated line
line2, = ax2.plot([], [], 'b-', label='how2matplotlib.com')
line2.set_animated(True)
ax2.set_xlim(0, 100)
ax2.set_ylim(0, 1)
ax2.set_title('Animated')

plt.legend()

for i in range(100):
    x = np.linspace(0, i, 100)
    y = np.sin(x)

    line1.set_data(x, y)
    line2.set_data(x, y)

    plt.pause(0.01)

plt.show()
Output:
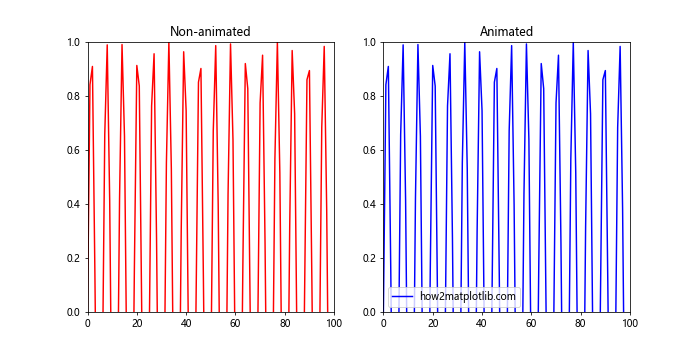
这个例子展示了animated和非animated线条在动画中的性能差异。虽然视觉上可能看不出明显区别,但animated线条的更新速度通常更快。
3. 何时使用set_animated()
set_animated()方法在以下情况下特别有用:
- 创建复杂的动画:当你的动画包含多个需要频繁更新的元素时。
- 实时数据可视化:当你需要实时更新图表以显示不断变化的数据时。
- 交互式图形:当用户交互可能导致图形频繁更新时。
3.1 示例:实时数据可视化
import matplotlib.pyplot as plt
import numpy as np

fig, ax = plt.subplots()
line, = ax.plot([], [], label='how2matplotlib.com')
line.set_animated(True)

ax.set_xlim(0, 100)
ax.set_ylim(-1, 1)
ax.set_title('Real-time Data Visualization')
plt.legend()

xdata, ydata = [], []

for i in range(100):
    xdata.append(i)
    ydata.append(np.sin(i / 10))

    line.set_data(xdata, ydata)

    plt.pause(0.1)

plt.show()
Output:
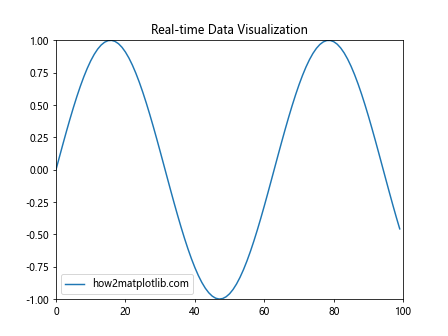
这个例子展示了如何使用set_animated()来创建一个实时更新的正弦波图。通过将线条设置为animated,我们可以高效地更新图形。
4. set_animated()与blitting技术
blitting是一种高级的动画优化技术,它与set_animated()方法密切相关。blitting允许你只重绘发生变化的部分,而不是整个图形。
4.1 基本blitting示例
import matplotlib.pyplot as plt
import numpy as np

fig, ax = plt.subplots()
line, = ax.plot([], [], label='how2matplotlib.com')
line.set_animated(True)

ax.set_xlim(0, 2*np.pi)
ax.set_ylim(-1, 1)
ax.set_title('Blitting Example')
plt.legend()

# 初始化背景
fig.canvas.draw()
background = fig.canvas.copy_from_bbox(ax.bbox)

for i in np.linspace(0, 2*np.pi, 100):
    # 恢复背景
    fig.canvas.restore_region(background)

    # 更新数据
    line.set_data(np.linspace(0, i, 100), np.sin(np.linspace(0, i, 100)))

    # 重绘线条
    ax.draw_artist(line)

    # 更新画布
    fig.canvas.blit(ax.bbox)
    fig.canvas.flush_events()

    plt.pause(0.01)

plt.show()
Output:
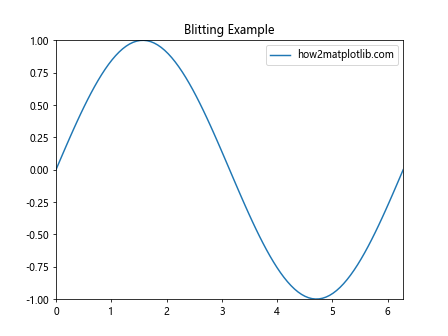
这个例子展示了如何结合set_animated()和blitting技术来创建高效的动画。通过只更新变化的部分,我们可以显著提高动画的性能。
5. set_animated()在不同类型的Artist中的应用
set_animated()方法可以应用于各种类型的Artist对象,包括线条、散点、文本、图像等。
5.1 animated线条
import matplotlib.pyplot as plt
import numpy as np

fig, ax = plt.subplots()
line, = ax.plot([], [], 'r-', lw=2, label='how2matplotlib.com')
line.set_animated(True)

ax.set_xlim(0, 2*np.pi)
ax.set_ylim(-1, 1)
ax.set_title('Animated Line')
plt.legend()

x = np.linspace(0, 2*np.pi, 100)
for phase in np.linspace(0, 2*np.pi, 100):
    y = np.sin(x + phase)
    line.set_data(x, y)
    plt.pause(0.05)

plt.show()
Output:
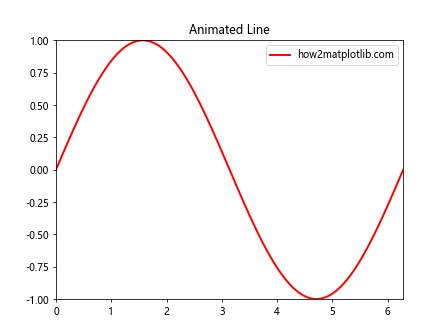
这个例子展示了如何创建一个animated的正弦波线条。
5.2 animated散点图
import matplotlib.pyplot as plt
import numpy as np

fig, ax = plt.subplots()
scat = ax.scatter([], [], label='how2matplotlib.com')
scat.set_animated(True)

ax.set_xlim(0, 10)
ax.set_ylim(0, 10)
ax.set_title('Animated Scatter Plot')
plt.legend()

for i in range(50):
    x = np.random.rand(20) * 10
    y = np.random.rand(20) * 10
    scat.set_offsets(np.c_[x, y])
    plt.pause(0.1)

plt.show()
Output:
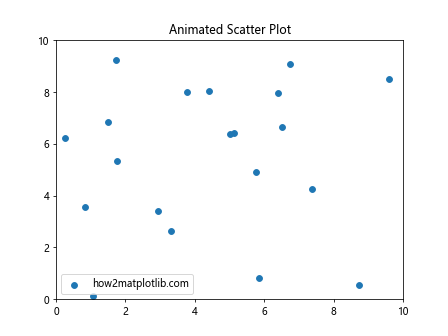
这个例子展示了如何创建一个animated的散点图,点的位置在每一帧都会随机变化。
5.3 animated文本
import matplotlib.pyplot as plt
import numpy as np

fig, ax = plt.subplots()
text = ax.text(0.5, 0.5, '', ha='center', va='center', fontsize=20)
text.set_animated(True)

ax.set_xlim(0, 1)
ax.set_ylim(0, 1)
ax.set_title('Animated Text')

for i in range(50):
    text.set_text(f'Frame {i}\nhow2matplotlib.com')
    plt.pause(0.1)

plt.show()
Output:
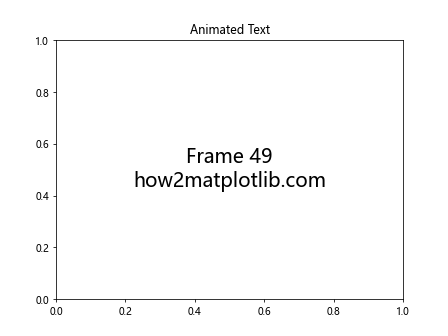
这个例子展示了如何创建一个animated的文本对象,文本内容在每一帧都会更新。
6. set_animated()与其他动画方法的比较
Matplotlib提供了多种创建动画的方法,set_animated()是其中之一。让我们比较一下set_animated()与其他常用的动画方法。
6.1 set_animated() vs FuncAnimation
FuncAnimation是Matplotlib中另一个常用的动画创建工具。它提供了一个更高级的接口来创建动画。
import matplotlib.pyplot as plt
import numpy as np
from matplotlib.animation import FuncAnimation

fig, ax = plt.subplots()
line, = ax.plot([], [], label='how2matplotlib.com')
ax.set_xlim(0, 2*np.pi)
ax.set_ylim(-1, 1)
ax.set_title('FuncAnimation Example')
plt.legend()

def animate(frame):
    x = np.linspace(0, 2*np.pi, 100)
    y = np.sin(x + frame/10)
    line.set_data(x, y)
    return line,

anim = FuncAnimation(fig, animate, frames=100, interval=50, blit=True)
plt.show()
Output:
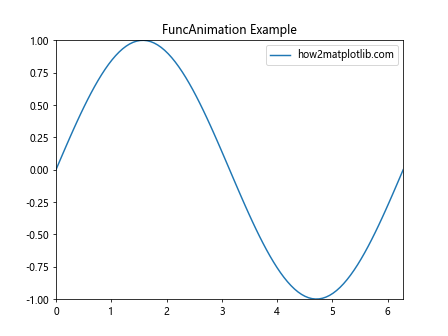
这个例子使用FuncAnimation创建了一个类似的正弦波动画。与直接使用set_animated()相比,FuncAnimation提供了更简洁的API,但可能在某些情况下性能略低。
6.2 set_animated() vs 手动更新
有时,我们可能会选择手动更新图形,而不使用任何特殊的动画工具。
import matplotlib.pyplot as plt
import numpy as np

fig, ax = plt.subplots()
line, = ax.plot([], [], label='how2matplotlib.com')

ax.set_xlim(0, 2*np.pi)
ax.set_ylim(-1, 1)
ax.set_title('Manual Update Example')
plt.legend()

for i in np.linspace(0, 2*np.pi, 100):
    x = np.linspace(0, 2*np.pi, 100)
    y = np.sin(x + i)
    line.set_data(x, y)
    plt.pause(0.05)

plt.show()
Output:
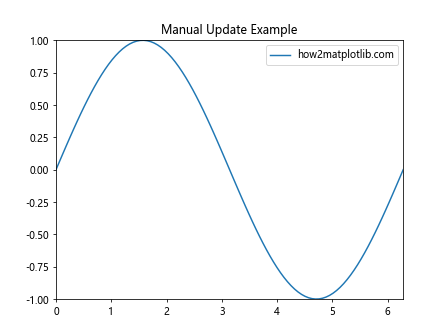
这个例子展示了如何通过手动更新来创建动画。虽然这种方法简单直接,但对于复杂的动画来说,可能不如使用set_animated()或FuncAnimation效率高。
7. set_animated()的性能优化技巧
虽然set_animated()本身就是一种优化工具,但我们还可以采取一些额外的措施来进一步提高动画的性能。
7.1 使用适当的更新频率
import matplotlib.pyplot as plt
import numpy as np
import time

fig, ax = plt.subplots()
line, = ax.plot([], [], label='how2matplotlib.com')
line.set_animated(True)

ax.set_xlim(0, 100)
ax.set_ylim(-1, 1)
ax.set_title('Optimized Update Frequency')
plt.legend()

start_time = time.time()
for i in range(1000):
    x = np.linspace(0, 100, 1000)
    y = np.sin(x / 10 + i / 10)
    line.set_data(x, y)

    if i % 10 == 0:  # 每10帧更新一次
        fig.canvas.draw()
        fig.canvas.flush_events()

end_time = time.time()
print(f"Total time: {end_time - start_time:.2f} seconds")

plt.show()
Output:
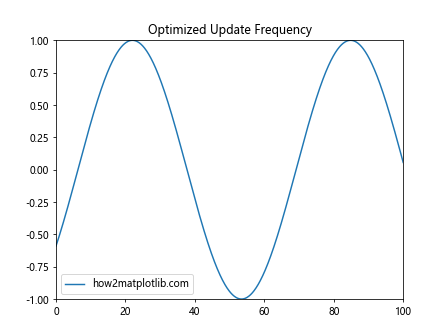
这个例子展示了如何通过控制更新频率来优化动画性能。我们只在每10帧更新一次图形,而不是每一帧都更新。
7.2 使用简化的Artist
import matplotlib.pyplot as plt
import numpy as np

fig, (ax1, ax2) = plt.subplots(1, 2, figsize=(10, 5))

# 复杂的Artist
complex_line, = ax1.plot([], [], 'r-', lw=2, marker='o', markersize=5, label='how2matplotlib.com')
complex_line.set_animated(True)
ax1.set_title('Complex Artist')

# 简化的Artist
simple_line, = ax2.plot([], [], 'b-', label='how2matplotlib.com')
simple_line.set_animated(True)
ax2.set_title('Simplified Artist')

ax1.set_xlim(0, 100)
ax1.set_ylim(-1, 1)
ax2.set_xlim(0, 100)
ax2.set_ylim(-1, 1)

plt.legend()

for i in range(100):
    x = np.linspace(0, 100, 1000)
    y = np.sin(x / 10 + i / 10)

    complex_line.set_data(x, y)
    simple_line.set_data(x, y)

    plt.pause(0.05)

plt.show()
Output:
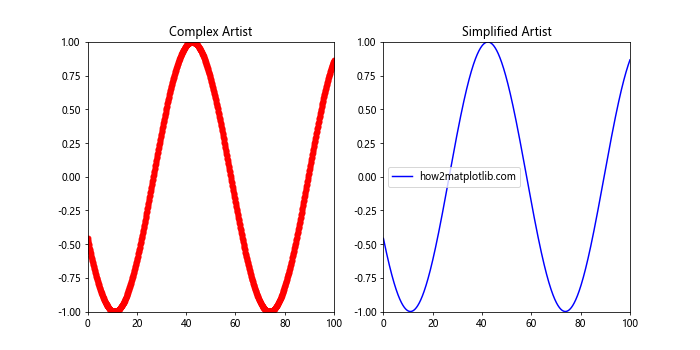
这个例子比较了复杂Artist和简化Artist在动画中的性能差异。简化的Artist(没有标记,线宽较小)通常能提供更好的性能。
8. set_animated()的常见问题和解决方案
使用set_animated()时可能会遇到一些常见问题,下面我们来探讨这些问题及其解决方案。
8.1 动画不显示
有时,设置了set_animated(True)后,动画可能不会显示。这通常是因为没有正确刷新画布。
import matplotlib.pyplot as plt
import numpy as np

fig, ax = plt.subplots()
line, = ax.plot([],[], label='how2matplotlib.com')
line.set_animated(True)

ax.set_xlim(0, 2*np.pi)
ax.set_ylim(-1, 1)
ax.set_title('Fixing Animation Not Showing')
plt.legend()

for i in np.linspace(0, 2*np.pi, 100):
    x = np.linspace(0, 2*np.pi, 100)
    y = np.sin(x + i)
    line.set_data(x, y)

    fig.canvas.draw()
    fig.canvas.flush_events()

    plt.pause(0.05)

plt.show()
Output:
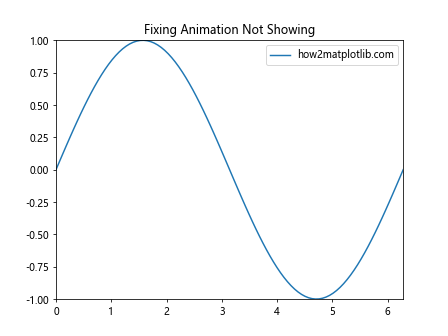
在这个例子中,我们通过显式调用fig.canvas.draw()和fig.canvas.flush_events()来确保动画正确显示。
8.2 性能下降
如果在使用set_animated()后发现性能反而下降,可能是因为过度使用了这个方法。
import matplotlib.pyplot as plt
import numpy as np

fig, ax = plt.subplots()

# 只将需要频繁更新的对象设置为animated
line, = ax.plot([], [], label='how2matplotlib.com')
line.set_animated(True)

# 静态元素不需要设置为animated
ax.set_xlim(0, 2*np.pi)
ax.set_ylim(-1, 1)
ax.set_title('Optimizing Performance')
ax.legend()

for i in np.linspace(0, 2*np.pi, 100):
    x = np.linspace(0, 2*np.pi, 100)
    y = np.sin(x + i)
    line.set_data(x, y)

    fig.canvas.draw()
    fig.canvas.flush_events()

    plt.pause(0.05)

plt.show()
Output:
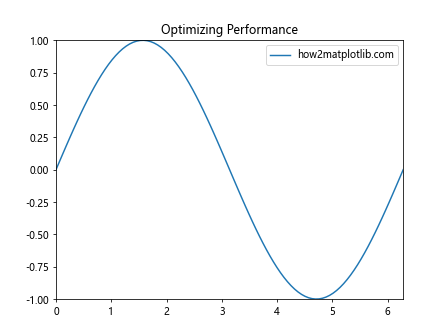
在这个例子中,我们只将需要频繁更新的线条设置为animated,而静态元素(如坐标轴和标题)则保持默认状态。
9. set_animated()在不同Matplotlib后端中的表现
Matplotlib支持多种后端,set_animated()的行为可能会因后端不同而略有差异。
9.1 TkAgg后端
import matplotlib
matplotlib.use('TkAgg')
import matplotlib.pyplot as plt
import numpy as np

fig, ax = plt.subplots()
line, = ax.plot([], [], label='how2matplotlib.com')
line.set_animated(True)

ax.set_xlim(0, 2*np.pi)
ax.set_ylim(-1, 1)
ax.set_title('Animation with TkAgg Backend')
plt.legend()

for i in np.linspace(0, 2*np.pi, 100):
    x = np.linspace(0, 2*np.pi, 100)
    y = np.sin(x + i)
    line.set_data(x, y)

    fig.canvas.draw()
    fig.canvas.flush_events()

    plt.pause(0.05)

plt.show()
Output:
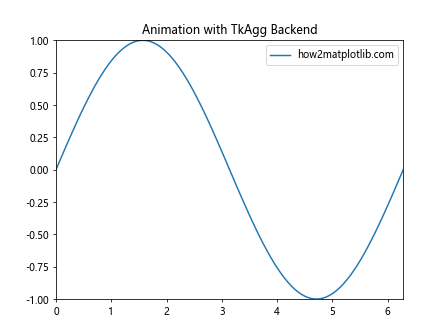
TkAgg是Matplotlib的默认后端之一,通常在大多数系统上都能很好地支持set_animated()。
9.2 Qt5Agg后端
import matplotlib
matplotlib.use('Qt5Agg')
import matplotlib.pyplot as plt
import numpy as np

fig, ax = plt.subplots()
line, = ax.plot([], [], label='how2matplotlib.com')
line.set_animated(True)

ax.set_xlim(0, 2*np.pi)
ax.set_ylim(-1, 1)
ax.set_title('Animation with Qt5Agg Backend')
plt.legend()

for i in np.linspace(0, 2*np.pi, 100):
    x = np.linspace(0, 2*np.pi, 100)
    y = np.sin(x + i)
    line.set_data(x, y)

    fig.canvas.draw()
    fig.canvas.flush_events()

    plt.pause(0.05)

plt.show()
Output:
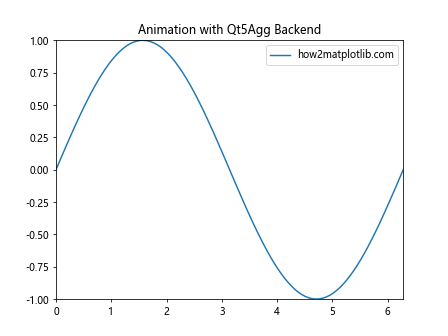
Qt5Agg后端通常提供良好的性能,特别是在处理复杂动画时。
10. set_animated()在特殊场景中的应用
set_animated()方法不仅可以用于常规的线图和散点图,还可以应用于更复杂的可视化场景。
10.1 动态热图
import matplotlib.pyplot as plt
import numpy as np

fig, ax = plt.subplots()
data = np.random.rand(10, 10)
im = ax.imshow(data, animated=True)
ax.set_title('Dynamic Heatmap\nhow2matplotlib.com')

for i in range(50):
    data = np.random.rand(10, 10)
    im.set_array(data)

    fig.canvas.draw()
    fig.canvas.flush_events()

    plt.pause(0.1)

plt.show()
Output:
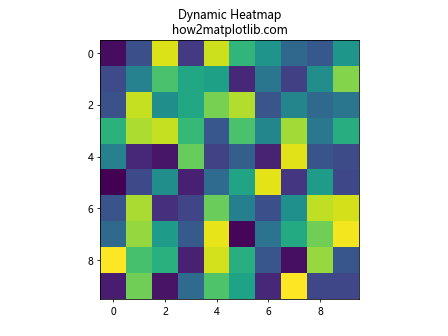
这个例子展示了如何使用set_animated()来创建一个动态更新的热图。
10.2 动画条形图
import matplotlib.pyplot as plt
import numpy as np

fig, ax = plt.subplots()
x = np.arange(10)
y = np.random.rand(10)
bars = ax.bar(x, y)
ax.set_ylim(0, 1)
ax.set_title('Animated Bar Chart\nhow2matplotlib.com')

for bar in bars:
    bar.set_animated(True)

for i in range(50):
    for bar, h in zip(bars, np.random.rand(10)):
        bar.set_height(h)

    fig.canvas.draw()
    fig.canvas.flush_events()

    plt.pause(0.1)

plt.show()
Output:
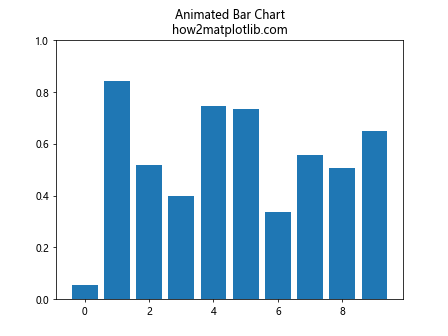
这个例子展示了如何使用set_animated()来创建一个动画条形图,每个条形的高度都在不断变化。
总结
Matplotlib的Artist.set_animated()方法是一个强大的工具,可以显著提高动画的性能。通过将频繁更新的图形元素设置为animated状态,我们可以避免不必要的重绘,从而加快动画的速度。
本文详细介绍了set_animated()方法的使用方法、工作原理以及在各种场景下的应用。我们探讨了如何结合blitting技术来进一步优化性能,比较了set_animated()与其他动画方法的异同,并提供了一些实用的性能优化技巧。
虽然set_animated()是一个非常有用的工具,但它并不是万能的。在某些情况下,过度使用这个方法可能会导致性能下降。因此,我们需要根据具体情况来决定是否使用set_animated(),以及如何最佳地使用它。
总的来说,掌握set_animated()方法可以让我们在Matplotlib中创建更加流畅、高效的动画,从而提升数据可视化的质量和用户体验。无论是创建简单的线图动画,还是复杂的交互式可视化,set_animated()都是一个值得掌握的重要工具。
 极客笔记
极客笔记