Matplotlib中的Artist.remove()方法:轻松移除图形元素
参考:Matplotlib.artist.Artist.remove() in Python
Matplotlib是Python中最流行的数据可视化库之一,它提供了丰富的绘图功能和灵活的自定义选项。在Matplotlib中,几乎所有可见的元素都是Artist对象,包括Figure、Axes以及线条、文本、标记等。Artist类是所有这些可视元素的基类,它提供了许多通用方法来操作这些元素。其中,remove()方法是一个非常有用的工具,它允许我们从图形中动态地移除不需要的元素。本文将深入探讨Matplotlib中Artist.remove()方法的使用,并通过多个示例来展示其在实际应用中的灵活性和强大功能。
1. Artist.remove()方法简介
Artist.remove()是Matplotlib中Artist类的一个方法,用于从图形中移除特定的艺术家对象(Artist object)。这个方法非常简单,但却非常强大,因为它允许我们在绘图过程中动态地修改图形内容。
基本语法如下:
artist.remove()
其中,artist是任何Artist对象的实例,如线条(Line2D)、文本(Text)、矩形(Rectangle)等。
让我们从一个简单的例子开始:
import matplotlib.pyplot as plt

fig, ax = plt.subplots()
line, = ax.plot([1, 2, 3, 4], [1, 4, 2, 3], label='Line from how2matplotlib.com')
ax.set_title('Before removing the line')
plt.show()

line.remove()
ax.set_title('After removing the line')
plt.show()
在这个例子中,我们首先绘制了一条线,然后使用line.remove()方法将其移除。通过比较两次plt.show()的结果,我们可以清楚地看到remove()方法的效果。
2. 移除不同类型的Artist对象
Matplotlib中有多种类型的Artist对象,我们可以使用remove()方法来移除它们。以下是一些常见Artist对象的移除示例:
2.1 移除线条(Line2D)
import matplotlib.pyplot as plt

fig, ax = plt.subplots()
line1, = ax.plot([1, 2, 3, 4], [1, 4, 2, 3], label='Line 1 from how2matplotlib.com')
line2, = ax.plot([1, 2, 3, 4], [3, 2, 4, 1], label='Line 2 from how2matplotlib.com')
ax.legend()

line1.remove()
ax.set_title('After removing Line 1')
plt.show()
Output:
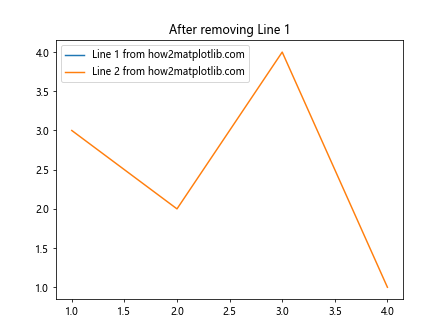
在这个例子中,我们绘制了两条线,然后使用line1.remove()方法移除了第一条线。
2.2 移除文本(Text)
import matplotlib.pyplot as plt

fig, ax = plt.subplots()
text = ax.text(0.5, 0.5, 'Text from how2matplotlib.com', ha='center', va='center')
ax.set_title('Before removing the text')
plt.show()

text.remove()
ax.set_title('After removing the text')
plt.show()
这个例子展示了如何使用text.remove()方法移除添加到图形中的文本对象。
2.3 移除矩形(Rectangle)
import matplotlib.pyplot as plt
import matplotlib.patches as patches

fig, ax = plt.subplots()
rect = patches.Rectangle((0.2, 0.2), 0.6, 0.6, fill=False, label='Rectangle from how2matplotlib.com')
ax.add_patch(rect)
ax.set_title('Before removing the rectangle')
plt.show()

rect.remove()
ax.set_title('After removing the rectangle')
plt.show()
这个例子演示了如何使用rect.remove()方法移除添加到图形中的矩形对象。
3. 动态移除多个Artist对象
在某些情况下,我们可能需要同时移除多个Artist对象。这可以通过循环或列表推导式来实现:
import matplotlib.pyplot as plt

fig, ax = plt.subplots()
lines = [ax.plot([i, i+1], [i, i+1], label=f'Line {i} from how2matplotlib.com')[0] for i in range(5)]
ax.legend()
ax.set_title('Before removing lines')
plt.show()

for line in lines[::2]:  # Remove every other line
    line.remove()
ax.set_title('After removing every other line')
plt.legend()
plt.show()
在这个例子中,我们首先创建了5条线,然后使用循环移除了其中的偶数索引线。
4. 使用remove()方法进行动画效果
remove()方法不仅可以用于静态图形,还可以用于创建动画效果。以下是一个简单的动画示例,展示了如何使用remove()方法创建一个移动的点:
import matplotlib.pyplot as plt
import matplotlib.animation as animation

fig, ax = plt.subplots()
ax.set_xlim(0, 10)
ax.set_ylim(0, 10)

def animate(frame):
    if frame > 0:
        old_point = ax.lines[0]
        old_point.remove()
    new_point, = ax.plot(frame, frame, 'ro', markersize=10)
    ax.set_title(f'Frame {frame} from how2matplotlib.com')
    return new_point,

ani = animation.FuncAnimation(fig, animate, frames=range(11), interval=500, blit=True)
plt.show()
Output:
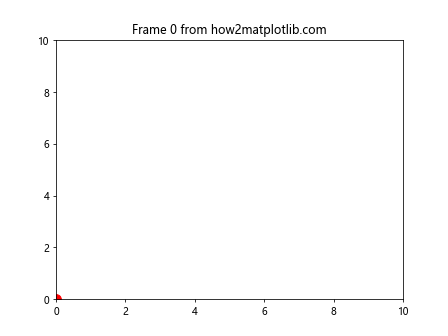
在这个动画中,我们在每一帧都移除前一个点并绘制一个新的点,从而创建了一个沿对角线移动的点的效果。
5. 移除坐标轴和刻度
虽然坐标轴和刻度不是典型的Artist对象,但我们也可以使用类似的方法来移除它们:
import matplotlib.pyplot as plt

fig, (ax1, ax2) = plt.subplots(1, 2, figsize=(10, 4))

ax1.plot([1, 2, 3, 4], [1, 4, 2, 3], label='Line from how2matplotlib.com')
ax1.set_title('With axes and ticks')

ax2.plot([1, 2, 3, 4], [1, 4, 2, 3], label='Line from how2matplotlib.com')
ax2.set_title('Without axes and ticks')

# Remove axes and ticks
ax2.spines['top'].set_visible(False)
ax2.spines['right'].set_visible(False)
ax2.spines['bottom'].set_visible(False)
ax2.spines['left'].set_visible(False)
ax2.set_xticks([])
ax2.set_yticks([])

plt.tight_layout()
plt.show()
Output:
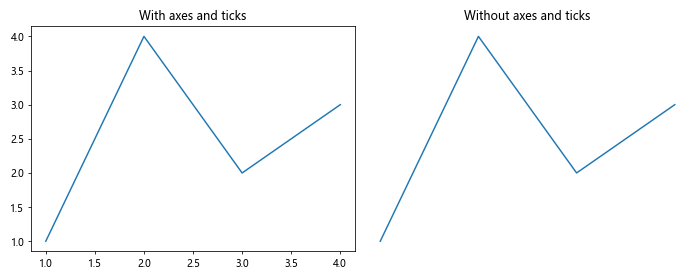
这个例子展示了如何移除坐标轴和刻度,创建一个更加简洁的图形。
6. 移除图例
图例是另一种常见的需要动态移除的元素。以下是一个移除图例的示例:
import matplotlib.pyplot as plt

fig, (ax1, ax2) = plt.subplots(1, 2, figsize=(10, 4))

ax1.plot([1, 2, 3, 4], [1, 4, 2, 3], label='Line 1 from how2matplotlib.com')
ax1.plot([1, 2, 3, 4], [3, 2, 4, 1], label='Line 2 from how2matplotlib.com')
legend1 = ax1.legend()
ax1.set_title('With legend')

ax2.plot([1, 2, 3, 4], [1, 4, 2, 3], label='Line 1 from how2matplotlib.com')
ax2.plot([1, 2, 3, 4], [3, 2, 4, 1], label='Line 2 from how2matplotlib.com')
legend2 = ax2.legend()
legend2.remove()
ax2.set_title('Without legend')

plt.tight_layout()
plt.show()
Output:
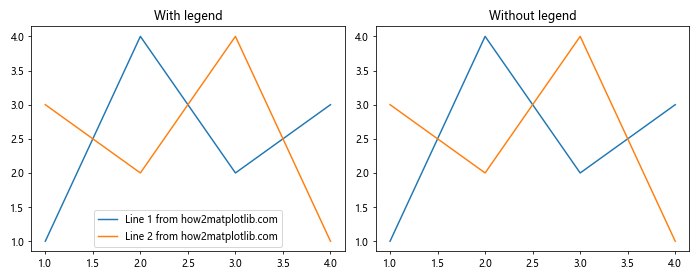
在这个例子中,我们在右侧的子图中使用legend2.remove()方法移除了图例。
7. 移除颜色条(Colorbar)
颜色条是在使用颜色映射时常见的元素,有时我们可能需要动态地移除它:
import matplotlib.pyplot as plt
import numpy as np

fig, (ax1, ax2) = plt.subplots(1, 2, figsize=(10, 4))

data = np.random.rand(10, 10)
im1 = ax1.imshow(data)
cbar1 = fig.colorbar(im1, ax=ax1)
ax1.set_title('With colorbar')

im2 = ax2.imshow(data)
cbar2 = fig.colorbar(im2, ax=ax2)
cbar2.remove()
ax2.set_title('Without colorbar')

plt.tight_layout()
plt.show()
Output:
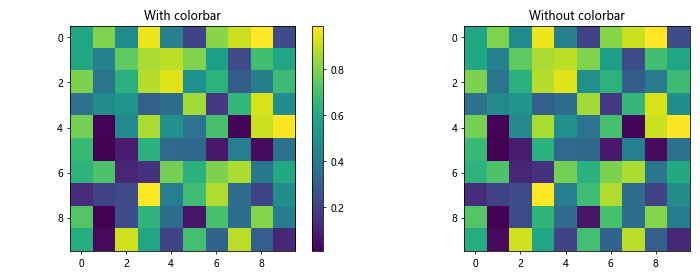
这个例子展示了如何使用cbar2.remove()方法移除颜色条。
8. 移除网格线
网格线可以帮助读者更好地解读数据,但有时我们可能想要移除它们:
import matplotlib.pyplot as plt

fig, (ax1, ax2) = plt.subplots(1, 2, figsize=(10, 4))

ax1.plot([1, 2, 3, 4], [1, 4, 2, 3], label='Line from how2matplotlib.com')
ax1.grid(True)
ax1.set_title('With grid')

ax2.plot([1, 2, 3, 4], [1, 4, 2, 3], label='Line from how2matplotlib.com')
ax2.grid(True)
for grid in ax2.get_xgridlines() + ax2.get_ygridlines():
    grid.remove()
ax2.set_title('Without grid')

plt.tight_layout()
plt.show()
在这个例子中,我们通过遍历网格线并调用remove()方法来移除所有的网格线。
9. 移除子图
有时,我们可能需要动态地移除整个子图:
import matplotlib.pyplot as plt

fig = plt.figure(figsize=(10, 4))
ax1 = fig.add_subplot(121)
ax2 = fig.add_subplot(122)

ax1.plot([1, 2, 3, 4], [1, 4, 2, 3], label='Line from how2matplotlib.com')
ax1.set_title('Subplot 1')

ax2.plot([1, 2, 3, 4], [3, 2, 4, 1], label='Line from how2matplotlib.com')
ax2.set_title('Subplot 2')

plt.show()

fig.delaxes(ax2)
fig.suptitle('After removing Subplot 2')
plt.tight_layout()
plt.show()
这个例子展示了如何使用fig.delaxes()方法移除一个子图。
10. 在交互式环境中使用remove()
在交互式环境(如Jupyter Notebook)中,我们可以结合使用remove()方法和IPython.display模块来创建动态更新的图形:
import matplotlib.pyplot as plt
from IPython.display import display, clear_output
import time

fig, ax = plt.subplots()
display(fig)

for i in range(5):
    line, = ax.plot([0, 1], [i, i], label=f'Line {i} from how2matplotlib.com')
    ax.legend()
    clear_output(wait=True)
    display(fig)
    time.sleep(1)
    line.remove()

ax.set_title('All lines removed')
clear_output(wait=True)
display(fig)
这个例子在Jupyter Notebook中创建了一个动态更新的图形,每次添加一条线,然后移除它,最后显示一个空白的图形。
11. 使用remove()方法进行数据更新
remove()方法还可以用于实现数据的动态更新。以下是一个简单的示例,展示了如何使用remove()方法来更新折线图的数据:
import matplotlib.pyplot as plt
import numpy as np

fig, ax = plt.subplots()
x = np.linspace(0, 10, 100)
line, = ax.plot(x, np.sin(x), label='Sine wave from how2matplotlib.com')
ax.set_title('Original sine wave')
plt.show()

# Update the data
new_y = np.cos(x)
line.remove()
ax.plot(x, new_y, label='Cosine wave from how2matplotlib.com')
ax.set_title('Updated to cosine wave')
ax.legend()
plt.show()
在这个例子中,我们首先绘制了一个正弦波,然后使用remove()方法移除它,并绘制了一个余弦波来替代它。
12. 移除3D图形中的元素
remove()方法同样适用于3D图形。以下是一个在3D图形中移除表面的示例:
import matplotlib.pyplot as plt
import numpy as np
from mpl_toolkits.mplot3d import Axes3D

fig = plt.figure(figsize=(10, 4))
ax1 = fig.add_subplot(121, projection='3d')
ax2 = fig.add_subplot(122, projection='3d')

x = np.linspace(-5, 5, 50)
y = np.linspace(-5, 5, 50)
X, Y = np.meshgrid(x, y)
Z = np.sin(np.sqrt(X**2 + Y**2))

surf1 = ax1.plot_surface(X, Y, Z, cmap='viridis')
ax1.set_title('With surface')

surf2 = ax2.plot_surface(X, Y, Z, cmap='viridis')
surf2.remove()
ax2.set_title('Surface removed')

plt.tight_layout()
plt.show()## 13. 移除散点图中的点

散点图是另一种常见的图表类型,我们可以使用`remove()`方法来动态地移除其中的点:

```python
import matplotlib.pyplot as plt
import numpy as np

fig, (ax1, ax2) = plt.subplots(1, 2, figsize=(10, 4))

x = np.random.rand(20)
y = np.random.rand(20)

scatter1 = ax1.scatter(x, y, c='blue', label='Points from how2matplotlib.com')
ax1.set_title('Original scatter plot')
ax1.legend()

scatter2 = ax2.scatter(x, y, c='blue', label='Points from how2matplotlib.com')
to_remove = np.random.choice(range(len(x)), 10, replace=False)
for i in to_remove:
    scatter2.remove()
    scatter2 = ax2.scatter(np.delete(x, i), np.delete(y, i), c='blue')
ax2.set_title('After removing 10 random points')
ax2.legend()

plt.tight_layout()
plt.show()
在这个例子中,我们首先创建了一个包含20个点的散点图,然后随机选择并移除了其中的10个点。
14. 移除误差线
误差线(Error bars)是在数据可视化中表示不确定性的重要工具。以下是一个移除误差线的示例:
import matplotlib.pyplot as plt
import numpy as np

fig, (ax1, ax2) = plt.subplots(1, 2, figsize=(10, 4))

x = np.arange(1, 5)
y = np.random.rand(4)
yerr = np.random.rand(4) * 0.1

_, caps, bars = ax1.errorbar(x, y, yerr=yerr, capsize=5, label='Data from how2matplotlib.com')
ax1.set_title('With error bars')
ax1.legend()

line, caps, bars = ax2.errorbar(x, y, yerr=yerr, capsize=5, label='Data from how2matplotlib.com')
for cap in caps:
    cap.remove()
for bar in bars:
    bar.remove()
ax2.set_title('Error bars removed')
ax2.legend()

plt.tight_layout()
plt.show()
这个例子展示了如何使用remove()方法移除误差线,同时保留数据点。
15. 移除填充区域
填充区域通常用于强调某个范围或表示置信区间。以下是一个移除填充区域的示例:
import matplotlib.pyplot as plt
import numpy as np

fig, (ax1, ax2) = plt.subplots(1, 2, figsize=(10, 4))

x = np.linspace(0, 10, 100)
y1 = np.sin(x)
y2 = np.sin(x) + 0.2

ax1.plot(x, y1, label='Line from how2matplotlib.com')
fill1 = ax1.fill_between(x, y1, y2, alpha=0.3, label='Filled area')
ax1.set_title('With filled area')
ax1.legend()

ax2.plot(x, y1, label='Line from how2matplotlib.com')
fill2 = ax2.fill_between(x, y1, y2, alpha=0.3, label='Filled area')
fill2.remove()
ax2.set_title('Filled area removed')
ax2.legend()

plt.tight_layout()
plt.show()
这个例子展示了如何使用remove()方法移除填充区域,同时保留原始的线条。
16. 移除箭头注释
箭头注释常用于在图表中标注特定的点或区域。以下是一个移除箭头注释的示例:
import matplotlib.pyplot as plt

fig, (ax1, ax2) = plt.subplots(1, 2, figsize=(10, 4))

ax1.plot([1, 2, 3, 4], [1, 4, 2, 3], label='Line from how2matplotlib.com')
arrow1 = ax1.annotate('Peak', xy=(2, 4), xytext=(3, 3),
                      arrowprops=dict(facecolor='black', shrink=0.05))
ax1.set_title('With arrow annotation')
ax1.legend()

ax2.plot([1, 2, 3, 4], [1, 4, 2, 3], label='Line from how2matplotlib.com')
arrow2 = ax2.annotate('Peak', xy=(2, 4), xytext=(3, 3),
                      arrowprops=dict(facecolor='black', shrink=0.05))
arrow2.remove()
ax2.set_title('Arrow annotation removed')
ax2.legend()

plt.tight_layout()
plt.show()
这个例子展示了如何使用remove()方法移除箭头注释。
17. 移除极坐标图中的元素
remove()方法同样适用于极坐标图。以下是一个在极坐标图中移除线条的示例:
import matplotlib.pyplot as plt
import numpy as np

fig, (ax1, ax2) = plt.subplots(1, 2, figsize=(10, 4), subplot_kw=dict(projection='polar'))

theta = np.linspace(0, 2*np.pi, 100)
r = np.sin(4*theta)

line1, = ax1.plot(theta, r, label='Line from how2matplotlib.com')
ax1.set_title('Original polar plot')
ax1.legend()

line2, = ax2.plot(theta, r, label='Line from how2matplotlib.com')
line2.remove()
ax2.set_title('Line removed from polar plot')
ax2.legend()

plt.tight_layout()
plt.show()
这个例子展示了如何在极坐标图中使用remove()方法移除线条。
18. 结合remove()和add_artist()方法
remove()方法通常与add_artist()方法结合使用,以实现图形元素的动态替换。以下是一个示例:
import matplotlib.pyplot as plt
import matplotlib.patches as patches

fig, ax = plt.subplots()

circle = patches.Circle((0.5, 0.5), 0.2, fill=False, label='Circle from how2matplotlib.com')
ax.add_artist(circle)
ax.set_title('Original circle')
ax.legend()
plt.show()

circle.remove()
rectangle = patches.Rectangle((0.3, 0.3), 0.4, 0.4, fill=False, label='Rectangle from how2matplotlib.com')
ax.add_artist(rectangle)
ax.set_title('Circle replaced with rectangle')
ax.legend()
plt.show()
在这个例子中,我们首先添加了一个圆形,然后使用remove()方法移除它,并使用add_artist()方法添加了一个矩形来替代它。
总结
Matplotlib的Artist.remove()方法是一个强大而灵活的工具,它允许我们动态地修改图形内容。通过本文的详细介绍和多个示例,我们可以看到remove()方法在各种场景下的应用,包括移除线条、文本、图例、颜色条、网格线等各种图形元素。
这个方法特别适用于创建动画效果、实现交互式图形、动态更新数据等场景。它可以与其他Matplotlib方法(如add_artist())结合使用,以实现更复杂的图形操作。
在使用remove()方法时,需要注意以下几点:
- 确保要移除的对象是可移除的Artist对象。
- 在移除对象后,可能需要调用
plt.draw()或fig.canvas.draw()来刷新图形。 - 在某些情况下,移除对象后可能需要重新调整图形布局或更新图例。
通过掌握Artist.remove()方法,我们可以更灵活地控制Matplotlib图形的内容,创建更动态、更交互的数据可视化效果。无论是在数据分析、科学研究还是交互式应用开发中,这个方法都能为我们提供更多的可能性。
 极客笔记
极客笔记