Matplotlib中Artist对象的窗口范围获取:深入解析get_window_extent()方法
参考:Matplotlib.artist.Artist.get_window_extent() in Python
Matplotlib是Python中最流行的数据可视化库之一,它提供了丰富的绘图功能和灵活的自定义选项。在Matplotlib中,几乎所有可见的元素都是Artist对象,包括图形、轴、线条、文本等。了解如何操作这些Artist对象对于创建精确的可视化效果至关重要。本文将深入探讨Matplotlib中Artist对象的get_window_extent()方法,这是一个用于获取对象在图形窗口中占据的空间范围的重要工具。
1. Artist对象简介
在Matplotlib中,Artist是所有可绘制对象的基类。它包括两大类:
- 基本Artist:如Line2D、Rectangle、Text等,这些是构成图形的基本元素。
- 容器Artist:如Axis、Axes、Figure等,这些可以包含其他Artist对象。
每个Artist对象都有其特定的属性和方法,用于控制其外观和行为。get_window_extent()方法就是Artist类中的一个重要方法,它允许我们获取Artist对象在图形窗口中的边界框。
2. get_window_extent()方法概述
get_window_extent()方法返回一个Bbox(边界框)对象,该对象描述了Artist在显示(或打印)时占据的矩形区域。这个方法对于确定对象的精确位置、大小以及与其他对象的关系非常有用。
基本语法
bbox = artist.get_window_extent(renderer=None)
artist:任何Matplotlib Artist对象renderer:可选参数,用于指定渲染器。如果为None,则使用默认渲染器。
返回值是一个Bbox对象,包含了对象在显示坐标系中的位置和大小信息。
3. 使用get_window_extent()的实际应用
3.1 获取文本对象的边界
文本对象是最常用的需要精确定位的元素之一。以下示例展示了如何获取文本对象的边界框:
import matplotlib.pyplot as plt

fig, ax = plt.subplots()
text = ax.text(0.5, 0.5, 'how2matplotlib.com', ha='center', va='center')

bbox = text.get_window_extent(fig.canvas.get_renderer())
print(f"Text bounding box: {bbox}")

plt.show()
Output:

这段代码创建了一个文本对象,并打印出其边界框信息。get_window_extent()方法需要一个渲染器对象,我们通过fig.canvas.get_renderer()获取。
3.2 调整轴的范围以适应文本
有时我们需要确保文本完全显示在轴内。以下示例展示了如何使用get_window_extent()来调整轴的范围:
import matplotlib.pyplot as plt

fig, ax = plt.subplots()
text = ax.text(1, 1, 'how2matplotlib.com\nMulti-line text', ha='right', va='top')

bbox = text.get_window_extent(fig.canvas.get_renderer())
bbox_data = bbox.transformed(ax.transData.inverted())

ax.set_xlim(0, bbox_data.x1 + 0.1)
ax.set_ylim(0, bbox_data.y1 + 0.1)

plt.show()
Output:
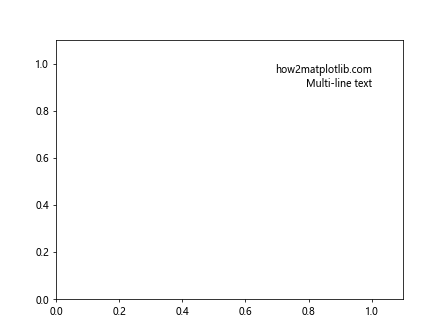
这个例子中,我们首先获取文本的边界框,然后将其转换回数据坐标系,最后据此调整轴的范围,确保文本完全可见。
3.3 避免标签重叠
在绘制多个标签时,避免重叠是一个常见问题。使用get_window_extent()可以帮助我们检测和避免重叠:
import matplotlib.pyplot as plt
import numpy as np

fig, ax = plt.subplots()
x = np.linspace(0, 10, 10)
y = np.random.rand(10)

for i, (xi, yi) in enumerate(zip(x, y)):
    label = ax.annotate(f'how2matplotlib.com\nPoint {i}', (xi, yi), xytext=(5, 5),
                        textcoords='offset points')

    bbox = label.get_window_extent(fig.canvas.get_renderer())

    # 检查与之前标签的重叠
    for prev_label in ax.texts[:-1]:
        prev_bbox = prev_label.get_window_extent(fig.canvas.get_renderer())
        if bbox.overlaps(prev_bbox):
            label.set_position((xi, yi + 0.1))  # 调整位置
            break

plt.show()
Output:
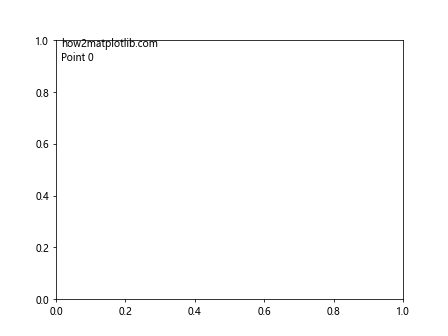
这个例子展示了如何使用get_window_extent()检测标签之间的重叠,并在必要时调整标签位置。
4. get_window_extent()与坐标变换
get_window_extent()返回的是显示坐标系中的边界框。有时我们需要在不同的坐标系之间进行转换。Matplotlib提供了多种坐标系和转换方法:
4.1 从显示坐标到数据坐标
import matplotlib.pyplot as plt

fig, ax = plt.subplots()
line, = ax.plot([0, 1], [0, 1], label='how2matplotlib.com')

bbox = line.get_window_extent(fig.canvas.get_renderer())
bbox_data = bbox.transformed(ax.transData.inverted())

print(f"Line extent in data coordinates: {bbox_data}")

plt.show()
Output:
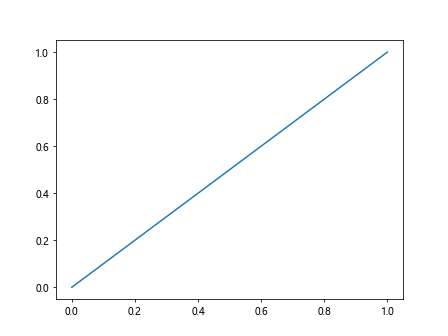
这个例子展示了如何将线条的显示坐标边界框转换为数据坐标。
4.2 从数据坐标到图形坐标
import matplotlib.pyplot as plt

fig, ax = plt.subplots()
point = ax.scatter([0.5], [0.5], s=100, label='how2matplotlib.com')

bbox = point.get_window_extent(fig.canvas.get_renderer())
bbox_fig = bbox.transformed(fig.transFigure.inverted())

print(f"Point extent in figure coordinates: {bbox_fig}")

plt.show()
Output:
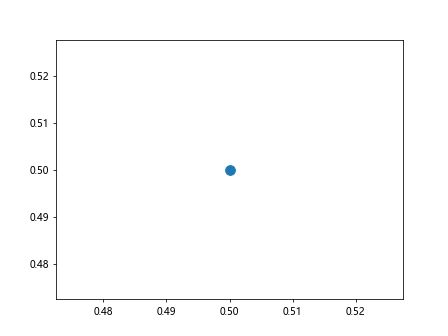
这个例子展示了如何将散点的显示坐标边界框转换为图形坐标。
5. 处理复杂Artist对象
某些Artist对象可能由多个子对象组成,如柱状图或箱线图。在这些情况下,get_window_extent()的行为可能会有所不同。
5.1 柱状图的边界框
import matplotlib.pyplot as plt
import numpy as np

fig, ax = plt.subplots()
x = np.arange(3)
heights = [0.5, 0.7, 0.3]
bars = ax.bar(x, heights, label='how2matplotlib.com')

for bar in bars:
    bbox = bar.get_window_extent(fig.canvas.get_renderer())
    print(f"Bar extent: {bbox}")

plt.show()
Output:
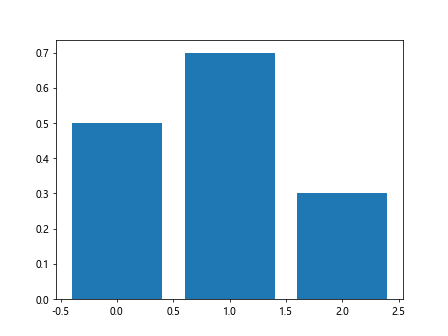
这个例子展示了如何获取柱状图中每个柱子的边界框。
5.2 箱线图的边界框
import matplotlib.pyplot as plt
import numpy as np

fig, ax = plt.subplots()
data = [np.random.normal(0, std, 100) for std in range(1, 4)]
box_plot = ax.boxplot(data, labels=['how2matplotlib.com A', 'B', 'C'])

for element in box_plot['boxes'] + box_plot['whiskers'] + box_plot['caps'] + box_plot['fliers']:
    bbox = element.get_window_extent(fig.canvas.get_renderer())
    print(f"Element extent: {bbox}")

plt.show()
Output:
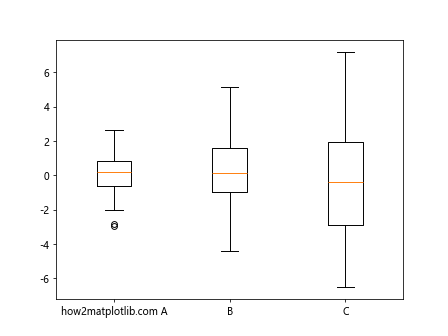
这个例子展示了如何获取箱线图中各个元素的边界框。
6. 在交互式环境中使用get_window_extent()
在交互式环境(如Jupyter Notebook)中使用get_window_extent()时,可能需要特别注意渲染器的处理。
import matplotlib.pyplot as plt
%matplotlib inline

fig, ax = plt.subplots()
text = ax.text(0.5, 0.5, 'how2matplotlib.com', ha='center', va='center')

# 在交互式环境中获取渲染器
renderer = fig.canvas.get_renderer()
bbox = text.get_window_extent(renderer)

print(f"Text bounding box: {bbox}")
这个例子展示了如何在Jupyter Notebook等交互式环境中正确获取渲染器并使用get_window_extent()。
7. 使用get_window_extent()进行图形布局优化
get_window_extent()方法在优化图形布局时非常有用,特别是当需要精确控制元素位置时。
7.1 自动调整子图间距
import matplotlib.pyplot as plt
import numpy as np

fig, (ax1, ax2) = plt.subplots(2, 1, figsize=(6, 8))

# 在两个子图中绘制内容
ax1.plot(np.random.rand(10), label='how2matplotlib.com')
ax2.bar(range(5), np.random.rand(5), label='Data')

# 添加标题
ax1.set_title('Plot in Subplot 1')
ax2.set_title('Plot in Subplot 2')

# 添加图例
ax1.legend()
ax2.legend()

# 获取每个子图的边界框
bbox1 = ax1.get_window_extent(fig.canvas.get_renderer())
bbox2 = ax2.get_window_extent(fig.canvas.get_renderer())

# 计算合适的间距
spacing = 0.1 * (bbox1.height + bbox2.height)

# 调整子图间距
plt.subplots_adjust(hspace=spacing / fig.dpi)

plt.show()
Output:
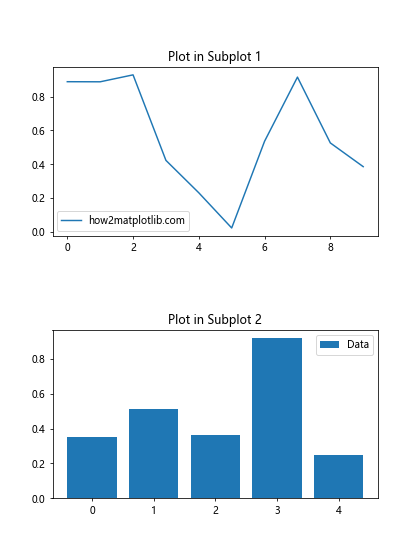
这个例子展示了如何使用get_window_extent()来自动计算和调整子图之间的间距,以确保布局美观。
7.2 避免标签与轴线重叠
import matplotlib.pyplot as plt
import numpy as np

fig, ax = plt.subplots()

# 绘制数据
x = np.linspace(0, 10, 100)
y = np.sin(x)
ax.plot(x, y, label='how2matplotlib.com')

# 添加x轴标签
xlabel = ax.set_xlabel('X axis')
ylabel = ax.set_ylabel('Y axis')

# 获取轴标签的边界框
xlabel_bbox = xlabel.get_window_extent(fig.canvas.get_renderer())
ylabel_bbox = ylabel.get_window_extent(fig.canvas.get_renderer())

# 调整轴的位置以避免重叠
ax.spines['left'].set_position(('outward', ylabel_bbox.width + 5))
ax.spines['bottom'].set_position(('outward', xlabel_bbox.height + 5))

plt.tight_layout()
plt.show()
Output:
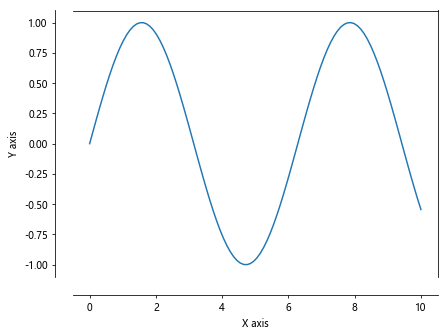
这个例子展示了如何使用get_window_extent()来调整轴的位置,以避免轴标签与轴线重叠。
8. get_window_extent()在动画中的应用
在创建动画时,get_window_extent()也可以派上用场,特别是当需要动态调整元素位置时。
import matplotlib.pyplot as plt
import matplotlib.animation as animation
import numpy as np

fig, ax = plt.subplots()
x = np.linspace(0, 2*np.pi, 100)
line, = ax.plot(x, np.sin(x))
text = ax.text(0, 0, 'how2matplotlib.com', ha='center', va='center')

def animate(frame):
    line.set_ydata(np.sin(x + frame/10))
    text.set_position((frame/10, np.sin(frame/10)))

    # 获取文本的边界框
    bbox = text.get_window_extent(fig.canvas.get_renderer())
    bbox_data = bbox.transformed(ax.transData.inverted())

    # 根据文本位置调整y轴范围
    ax.set_ylim(min(-1, bbox_data.y0 - 0.1), max(1, bbox_data.y1 + 0.1))

    return line, text

ani = animation.FuncAnimation(fig, animate, frames=100, interval=50, blit=True)
plt.show()
Output:
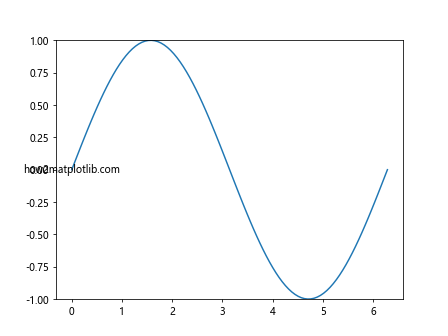
这个例子展示了如何在动画中使用get_window_extent()来动态调整轴的范围,确保移动的文本始终可见。
9. get_window_extent()与自定义Artist
当创建自定义Artist时,正确实现get_window_extent()方法可以使其与Matplotlib的其他功能更好地集成。
import matplotlib.pyplot as plt
from matplotlib.patches import Circle
from matplotlib.transforms import Bbox

class CustomArtist(Circle):
    def __init__(self, xy, radius):
        super().__init__(xy, radius)
        self.text = f'how2matplotlib.com\n({xy[0]:.2f}, {xy[1]:.2f})'

    def get_window_extent(self, renderer):
        bbox = super().get_window_extent(renderer)
        text_bbox = self.axes.text(self.center[0], self.center[1], self.text,
                                   ha='center', va='center').get_window_extent(renderer)
        return Bbox.union([bbox, text_bbox])

fig, ax = plt.subplots()
custom_artist = CustomArtist((0.5, 0.5), 0.2)
ax.add_artist(custom_artist)

# 获取自定义Artist的边界框
bbox = custom_artist.get_window_extent(fig.canvas.get_renderer())
print(f"Custom artist extent: {bbox}")

plt.show()
Output:
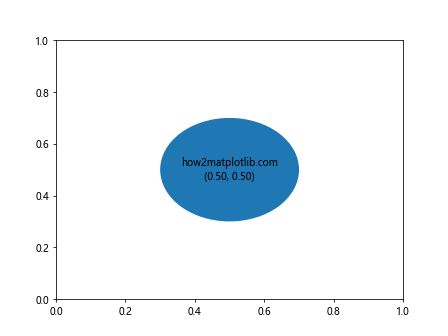
这个例子展示了如何为自定义Artist实现get_window_extent()方法,使其考虑到both圆形和内部文本的边界。
10. 性能考虑
虽然get_window_extent()是一个强大的工具,但频繁调用它可能会影响性能,特别是在处理大量Artist对象时。以下是一些优化建议:
10.1 缓存边界框
如果Artist对象的位置和大小不经常变化,可以考虑缓存边界框:
import matplotlib.pyplot as plt
import time

fig, ax = plt.subplots()
artists = [ax.text(i/10, i/10, f'how2matplotlib.com {i}') for i in range(100)]

# 不使用缓存
start_time = time.time()
for artist in artists:
    bbox = artist.get_window_extent(fig.canvas.get_renderer())
print(f"Time without caching: {time.time() - start_time}")

# 使用缓存
start_time = time.time()
cached_bboxes = [artist.get_window_extent(fig.canvas.get_renderer()) for artist in artists]
for bbox in cached_bboxes:
    # 使用缓存的边界框
    pass
print(f"Time with caching: {time.time() - start_time}")

plt.show()
Output:
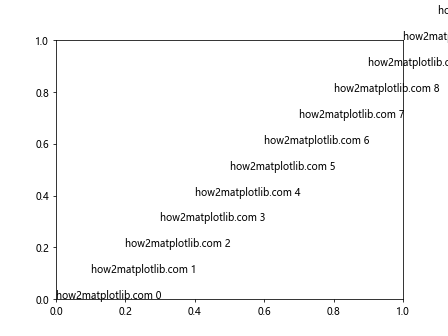
这个例子比较了使用和不使用缓存时获取多个Artist对象边界框的时间差异。
10.2 批量处理
当需要处理多个Artist对象时,可以考虑批量获取边界框:
import matplotlib.pyplot as plt
import matplotlib.transforms as transforms

fig, ax = plt.subplots()
lines = [ax.plot(range(5), [i]*5, label=f'how2matplotlib.com {i}')[0] for i in range(5)]

# 批量获取边界框
renderer = fig.canvas.get_renderer()
bboxes = [line.get_window_extent(renderer) for line in lines]

# 合并所有边界框
union_bbox = transforms.Bbox.union(bboxes)
print(f"Union of all bounding boxes: {union_bbox}")

plt.legend()
plt.show()
Output:
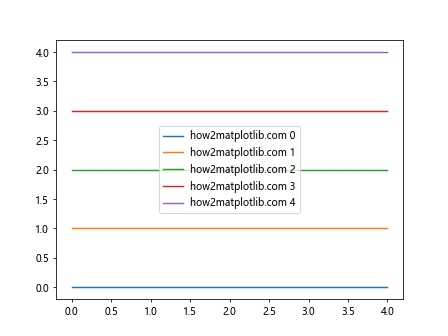
这个例子展示了如何批量获取多个线条的边界框,并计算它们的并集。
11. get_window_extent()在保存图形时的应用
get_window_extent()方法在保存图形时也非常有用,特别是当需要精确控制保存区域时。
11.1 保存特定Artist
import matplotlib.pyplot as plt
import numpy as np

fig, ax = plt.subplots()
x = np.linspace(0, 10, 100)
line = ax.plot(x, np.sin(x), label='how2matplotlib.com')[0]

# 获取线条的边界框
bbox = line.get_window_extent(fig.canvas.get_renderer()).transformed(fig.dpi_scale_trans.inverted())

# 保存只包含线条的部分
fig.savefig('line_only.png', bbox_inches=bbox, pad_inches=0.1)

plt.show()
Output:
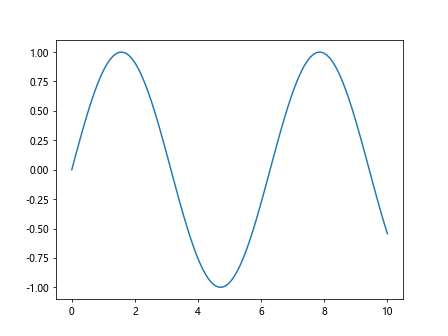
这个例子展示了如何使用get_window_extent()来保存图中特定的Artist对象(在这里是一条线)。
11.2 保存紧凑图形
import matplotlib.pyplot as plt
import numpy as np

fig, ax = plt.subplots()
x = np.linspace(0, 10, 100)
ax.plot(x, np.sin(x), label='how2matplotlib.com')
ax.set_title('Sine Wave')
ax.legend()

# 获取轴的边界框
bbox = ax.get_window_extent(fig.canvas.get_renderer()).transformed(fig.dpi_scale_trans.inverted())

# 保存紧凑的图形
fig.savefig('tight_plot.png', bbox_inches=bbox, pad_inches=0.1)

plt.show()
Output:
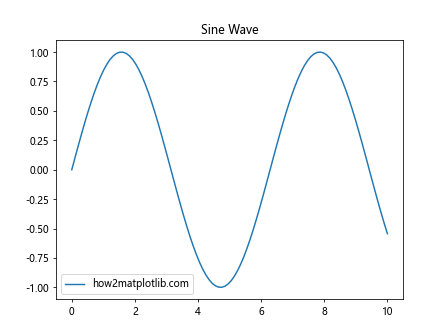
这个例子展示了如何使用get_window_extent()来保存一个紧凑的图形,只包含轴及其内容。
12. get_window_extent()在复杂布局中的应用
在创建复杂的图形布局时,get_window_extent()可以帮助我们精确定位和调整各个元素。
12.1 创建不规则布局
import matplotlib.pyplot as plt
import matplotlib.gridspec as gridspec

fig = plt.figure(figsize=(10, 8))
gs = gridspec.GridSpec(3, 3)

ax1 = fig.add_subplot(gs[0, :])
ax2 = fig.add_subplot(gs[1, :-1])
ax3 = fig.add_subplot(gs[1:, -1])
ax4 = fig.add_subplot(gs[-1, 0])
ax5 = fig.add_subplot(gs[-1, -2])

axes = [ax1, ax2, ax3, ax4, ax5]

for i, ax in enumerate(axes):
    ax.text(0.5, 0.5, f'how2matplotlib.com\nSubplot {i+1}', ha='center', va='center')

# 获取所有子图的边界框
renderer = fig.canvas.get_renderer()
bboxes = [ax.get_window_extent(renderer) for ax in axes]

# 找出最小和最大的x、y坐标
min_x = min(bbox.x0 for bbox in bboxes)
max_x = max(bbox.x1 for bbox in bboxes)
min_y = min(bbox.y0 for bbox in bboxes)
max_y = max(bbox.y1 for bbox in bboxes)

# 调整图形大小以适应所有子图
fig.set_size_inches((max_x - min_x) / fig.dpi, (max_y - min_y) / fig.dpi)

plt.tight_layout()
plt.show()
Output:
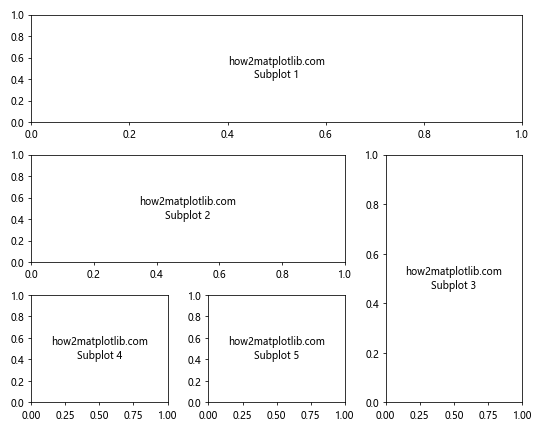
这个例子展示了如何在创建不规则布局时使用get_window_extent()来调整图形大小,确保所有子图都能完整显示。
12.2 动态调整图例位置
import matplotlib.pyplot as plt
import numpy as np

fig, ax = plt.subplots()

# 绘制多条线
for i in range(5):
    x = np.linspace(0, 10, 100)
    y = np.sin(x + i)
    ax.plot(x, y, label=f'how2matplotlib.com Line {i+1}')

# 添加图例
legend = ax.legend(loc='center left', bbox_to_anchor=(1, 0.5))

# 获取图例的边界框
bbox = legend.get_window_extent(fig.canvas.get_renderer())

# 调整图形大小以适应图例
fig.set_size_inches(fig.get_size_inches()[0] * 1.2, fig.get_size_inches()[1])

# 重新定位图例
ax.legend(loc='center left', bbox_to_anchor=(1, 0.5))

plt.tight_layout()
plt.show()
Output:
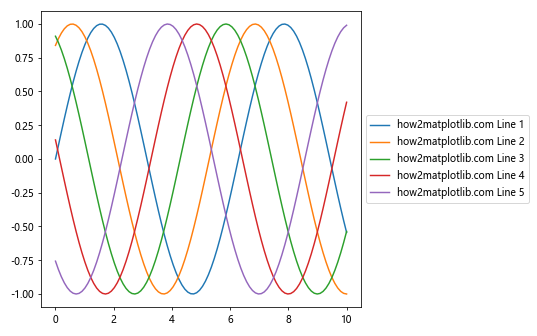
这个例子展示了如何使用get_window_extent()来动态调整图形大小,以适应放置在图形右侧的图例。
13. get_window_extent()与其他Matplotlib功能的结合
get_window_extent()方法可以与Matplotlib的其他功能结合使用,创造出更复杂和精确的可视化效果。
13.1 创建自定义注释
import matplotlib.pyplot as plt
import numpy as np

fig, ax = plt.subplots()

x = np.linspace(0, 10, 100)
y = np.sin(x)
line, = ax.plot(x, y, label='how2matplotlib.com')

# 创建一个点
point, = ax.plot(5, np.sin(5), 'ro')

# 获取点的位置
point_pos = point.get_xydata()[0]

# 创建注释
annotation = ax.annotate('Peak', xy=point_pos, xytext=(5, 1),
                         arrowprops=dict(arrowstyle='->'))

# 获取注释的边界框
bbox = annotation.get_window_extent(fig.canvas.get_renderer())

# 调整y轴范围以显示完整的注释
y_max = max(ax.get_ylim()[1], bbox.transformed(ax.transData.inverted()).y1 + 0.1)
ax.set_ylim(top=y_max)

plt.show()
Output:
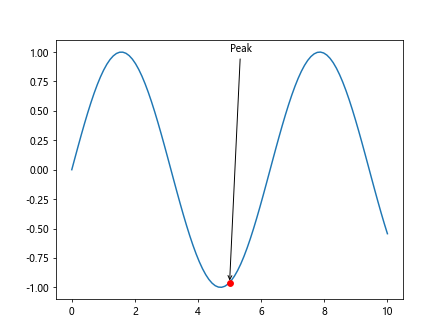
这个例子展示了如何使用get_window_extent()来确保注释完全显示在图中,通过调整y轴的范围。
13.2 创建自适应文本框
import matplotlib.pyplot as plt
import matplotlib.patches as patches

fig, ax = plt.subplots()

# 添加一些数据
ax.plot([0, 1, 2, 3], [0, 1, 0, 1], label='how2matplotlib.com')

# 创建文本
text = ax.text(1.5, 0.5, 'Important\nInformation', ha='center', va='center')

# 获取文本的边界框
bbox = text.get_window_extent(fig.canvas.get_renderer())
bbox_data = bbox.transformed(ax.transData.inverted())

# 创建一个稍大的矩形框
rect = patches.Rectangle((bbox_data.x0 - 0.1, bbox_data.y0 - 0.1),
                         bbox_data.width + 0.2, bbox_data.height + 0.2,
                         fill=False, edgecolor='red')
ax.add_patch(rect)

plt.show()
Output:
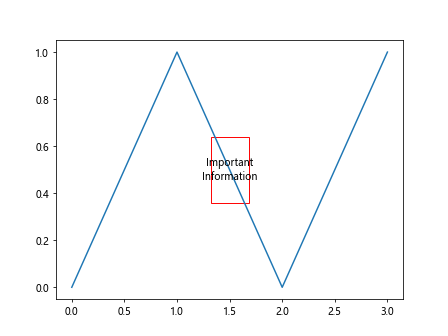
这个例子展示了如何使用get_window_extent()来创建一个自适应的文本框,该框会根据文本的大小自动调整。
结论
get_window_extent()方法是Matplotlib中一个强大而灵活的工具,它允许我们精确地获取和操作图形元素的位置和大小。通过本文的详细介绍和丰富的示例,我们看到了这个方法在各种场景下的应用,从简单的文本定位到复杂的图形布局调整。掌握get_window_extent()的使用可以帮助我们创建更精确、更专业的数据可视化效果,同时也为自定义和优化Matplotlib图形提供了更多可能性。
无论是在日常的数据分析工作中,还是在开发高级可视化应用时,get_window_extent()都是一个值得深入了解和灵活运用的方法。它不仅能解决许多常见的布局和定位问题,还能激发我们创造出更加独特和精确的可视化作品。通过不断实践和探索,我们可以充分发挥这个方法的潜力,提升我们的数据可视化技能。
 极客笔记
极客笔记