Matplotlib中Artist对象的get_url()方法详解与应用
参考:Matplotlib.artist.Artist.get_url() in Python
Matplotlib是Python中最流行的数据可视化库之一,它提供了丰富的绘图功能和灵活的自定义选项。在Matplotlib的架构中,Artist对象扮演着重要的角色,它是所有可视化元素的基类。本文将深入探讨Artist对象的get_url()方法,这是一个用于获取与Artist对象相关联的URL的重要函数。我们将详细介绍get_url()方法的用法、应用场景以及相关的示例代码,帮助读者全面理解并掌握这一功能。
1. Artist对象简介
在深入了解get_url()方法之前,我们首先需要了解Artist对象在Matplotlib中的角色和重要性。
Artist是Matplotlib中所有可视化元素的基类,包括图形、轴、线条、文本等。它定义了这些元素的基本属性和方法,如颜色、线型、透明度等。Artist对象可以分为两类:
- 基本Artist:如Line2D、Rectangle、Text等,用于绘制基本图形元素。
- 容器Artist:如Axis、Axes、Figure等,用于组织和管理其他Artist对象。
下面是一个简单的示例,展示了如何创建一个基本的Artist对象:
import matplotlib.pyplot as plt
import matplotlib.patches as patches

fig, ax = plt.subplots()
circle = patches.Circle((0.5, 0.5), 0.2, facecolor='red')
ax.add_patch(circle)
ax.set_title('How to use Artist in Matplotlib - how2matplotlib.com')
plt.show()
Output:
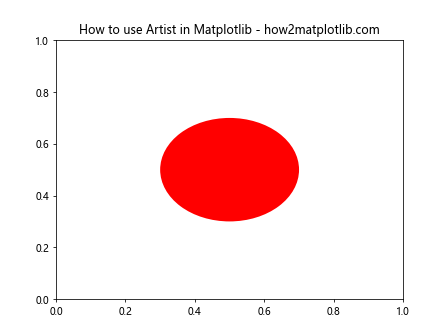
在这个例子中,我们创建了一个Circle对象,它是一个基本的Artist对象。我们将其添加到Axes对象中,Axes对象则是一个容器Artist。
2. get_url()方法概述
get_url()方法是Artist类的一个成员函数,用于获取与Artist对象相关联的URL。这个URL通常用于在交互式环境中为图形元素添加超链接,使用户可以通过点击图形元素跳转到指定的网页。
get_url()方法的基本语法如下:
url = artist.get_url()
其中,artist是一个Artist对象,返回值url是一个字符串,表示与该Artist对象关联的URL。
需要注意的是,get_url()方法只能获取已经设置的URL。如果没有为Artist对象设置URL,get_url()方法将返回None。
3. 设置Artist对象的URL
在使用get_url()方法之前,我们需要先为Artist对象设置URL。这可以通过set_url()方法来实现。下面是一个简单的示例:
import matplotlib.pyplot as plt
import matplotlib.patches as patches

fig, ax = plt.subplots()
circle = patches.Circle((0.5, 0.5), 0.2, facecolor='blue')
circle.set_url('https://how2matplotlib.com')
ax.add_patch(circle)
ax.set_title('Setting URL for Artist - how2matplotlib.com')
plt.show()
Output:
在这个例子中,我们创建了一个Circle对象,并使用set_url()方法为其设置了一个URL。虽然在静态图像中我们看不到任何变化,但在支持交互的环境中(如Jupyter Notebook或支持SVG的网页),用户可以通过点击圆形来访问设置的URL。
4. 使用get_url()方法
现在我们已经知道如何设置URL,接下来让我们看看如何使用get_url()方法来获取这个URL。以下是一个示例:
import matplotlib.pyplot as plt
import matplotlib.patches as patches

fig, ax = plt.subplots()
circle = patches.Circle((0.5, 0.5), 0.2, facecolor='green')
circle.set_url('https://how2matplotlib.com')
ax.add_patch(circle)

url = circle.get_url()
print(f"The URL associated with the circle is: {url}")

ax.set_title('Using get_url() method - how2matplotlib.com')
plt.show()
Output:
在这个例子中,我们首先创建了一个Circle对象并设置了URL。然后,我们使用get_url()方法获取了这个URL,并将其打印出来。这个方法返回我们之前设置的URL字符串。
5. get_url()方法的应用场景
get_url()方法在许多场景下都非常有用,特别是在创建交互式图表和数据可视化时。以下是一些常见的应用场景:
5.1 创建可点击的图例
我们可以为图例中的每个元素设置不同的URL,使用户可以通过点击图例跳转到相关的信息页面。下面是一个示例:
import matplotlib.pyplot as plt

fig, ax = plt.subplots()

line1, = ax.plot([1, 2, 3], [1, 2, 3], label='Line 1')
line2, = ax.plot([1, 2, 3], [3, 2, 1], label='Line 2')

line1.set_url('https://how2matplotlib.com/line1')
line2.set_url('https://how2matplotlib.com/line2')

legend = ax.legend()

for text in legend.get_texts():
    url = text.get_url()
    if url:
        print(f"Legend item '{text.get_text()}' has URL: {url}")

ax.set_title('Clickable Legend - how2matplotlib.com')
plt.show()
Output:
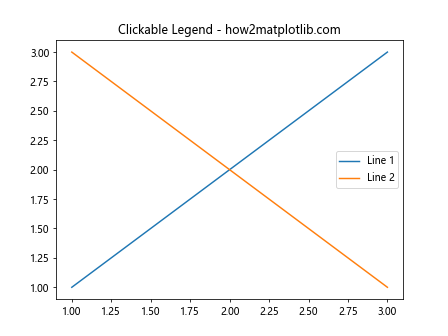
在这个例子中,我们为两条线设置了不同的URL,并在图例中显示这些线。然后,我们遍历图例中的文本元素,使用get_url()方法获取并打印每个元素的URL。
5.2 数据点链接
在散点图中,我们可以为每个数据点设置URL,使用户可以通过点击数据点获取更多相关信息。以下是一个示例:
import matplotlib.pyplot as plt
import numpy as np

fig, ax = plt.subplots()

x = np.random.rand(10)
y = np.random.rand(10)
colors = np.random.rand(10)

scatter = ax.scatter(x, y, c=colors)

for i, (xi, yi) in enumerate(zip(x, y)):
    point = scatter.get_paths()[i]
    point.set_url(f'https://how2matplotlib.com/point/{i}')

ax.set_title('Clickable Data Points - how2matplotlib.com')
plt.show()

# 打印每个点的URL
for i, path in enumerate(scatter.get_paths()):
    url = path.get_url()
    print(f"Point {i} has URL: {url}")
在这个例子中,我们创建了一个散点图,并为每个数据点设置了唯一的URL。然后,我们使用get_url()方法获取并打印每个点的URL。
5.3 交互式热力图
在热力图中,我们可以为每个单元格设置URL,使用户可以通过点击单元格获取更详细的数据。下面是一个示例:
import matplotlib.pyplot as plt
import numpy as np

fig, ax = plt.subplots()

data = np.random.rand(5, 5)
im = ax.imshow(data)

for i in range(5):
    for j in range(5):
        text = ax.text(j, i, f'{data[i, j]:.2f}', ha='center', va='center')
        text.set_url(f'https://how2matplotlib.com/cell/{i}/{j}')

ax.set_title('Interactive Heatmap - how2matplotlib.com')
plt.colorbar(im)
plt.show()

# 打印每个单元格的URL
for i in range(5):
    for j in range(5):
        text = ax.texts[i*5 + j]
        url = text.get_url()
        print(f"Cell ({i}, {j}) has URL: {url}")
Output:
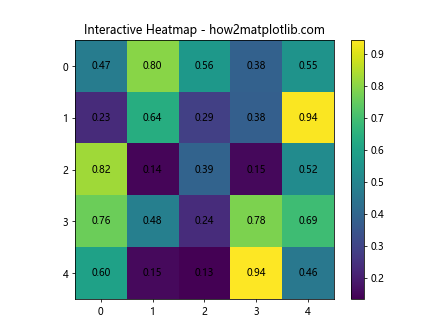
在这个例子中,我们创建了一个热力图,并为每个单元格的文本设置了URL。然后,我们使用get_url()方法获取并打印每个单元格的URL。
6. get_url()方法的注意事项
虽然get_url()方法使用起来相对简单,但在实际应用中还是有一些需要注意的地方:
6.1 URL的有效性
get_url()方法只是返回之前设置的URL字符串,它不会检查URL的有效性。因此,在设置URL时,我们需要确保URL是有效的,否则可能会导致用户体验问题。下面是一个示例,展示了如何在设置URL之前进行简单的有效性检查:
import matplotlib.pyplot as plt
import matplotlib.patches as patches
import re

def is_valid_url(url):
    regex = re.compile(
        r'^https?://'  # http:// or https://
        r'(?:(?:[A-Z0-9](?:[A-Z0-9-]{0,61}[A-Z0-9])?\.)+[A-Z]{2,6}\.?|'  # domain...
        r'localhost|'  # localhost...
        r'\d{1,3}\.\d{1,3}\.\d{1,3}\.\d{1,3})'  # ...or ip
        r'(?::\d+)?'  # optional port
        r'(?:/?|[/?]\S+)$', re.IGNORECASE)
    return url is not None and regex.search(url)

fig, ax = plt.subplots()
circle = patches.Circle((0.5, 0.5), 0.2, facecolor='red')

url = 'https://how2matplotlib.com'
if is_valid_url(url):
    circle.set_url(url)
    print(f"URL set: {circle.get_url()}")
else:
    print("Invalid URL")

ax.add_patch(circle)
ax.set_title('URL Validity Check - how2matplotlib.com')
plt.show()
Output:
在这个例子中,我们定义了一个简单的函数来检查URL的有效性。只有当URL通过检查时,我们才会设置它,并使用get_url()方法验证设置是否成功。
6.2 URL编码
当URL中包含特殊字符时,我们需要进行URL编码以确保URL的正确性。Python的urllib.parse模块提供了这个功能。以下是一个示例:
import matplotlib.pyplot as plt
import matplotlib.patches as patches
from urllib.parse import quote

fig, ax = plt.subplots()
circle = patches.Circle((0.5, 0.5), 0.2, facecolor='blue')

url = 'https://how2matplotlib.com/search?q=特殊字符'
encoded_url = quote(url, safe=':/?=')
circle.set_url(encoded_url)

ax.add_patch(circle)
ax.set_title('URL Encoding - how2matplotlib.com')
plt.show()

print(f"Encoded URL: {circle.get_url()}")
Output:
在这个例子中,我们使用quote函数对URL进行编码,然后设置给Artist对象。使用get_url()方法可以获取编码后的URL。
6.3 处理未设置URL的情况
当我们调用get_url()方法时,如果URL没有被设置,方法将返回None。在处理大量Artist对象时,我们需要考虑这种情况。下面是一个处理多个Artist对象的示例:
import matplotlib.pyplot as plt
import matplotlib.patches as patches

fig, ax = plt.subplots()

circles = [
    patches.Circle((0.2, 0.5), 0.1, facecolor='red'),
    patches.Circle((0.5, 0.5), 0.1, facecolor='green'),
    patches.Circle((0.8, 0.5), 0.1, facecolor='blue')
]

circles[0].set_url('https://how2matplotlib.com/red')
circles[2].set_url('https://how2matplotlib.com/blue')

for circle in circles:
    ax.add_patch(circle)

ax.set_title('Handling Unset URLs - how2matplotlib.com')
plt.show()

for i, circle in enumerate(circles):
    url = circle.get_url()
    if url:
        print(f"Circle {i} has URL: {url}")
    else:
        print(f"Circle {i} has no URL set")
Output:
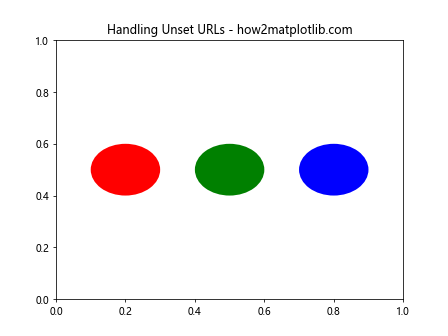
在这个例子中,我们创建了三个圆,但只为其中两个设置了URL。在遍历这些圆时,我们使用get_url()方法检查是否设置了URL,并相应地打印信息。
7. get_url()方法与其他Artist方法的结合使用
get_url()方法通常与其他Artist方法结合使用,以创建更复杂和交互性更强的可视化。以下是一些常见的组合:
7.1 与set_picker()方法结合
set_picker()方法允许我们为Artist对象设置可拾取性,这在创建交互式图表时非常有用。结合get_url()方法,我们可以在用户点击元素时获取并使用URL。下面是一个示例:
import matplotlib.pyplot as plt
import webbrowser

def on_pick(event):
    artist = event.artist
    url = artist.get_url()
    if url:
        print(f"Opening URL: {url}")
        webbrowser.open(url)

fig, ax = plt.subplots()

circle = plt.Circle((0.5, 0.5), 0.2, facecolor='purple', picker=True)
circle.set_url('https://how2matplotlib.com')

ax.add_patch(circle)
ax.set_title('Clickable Circle - how2matplotlib.com')

fig.canvas.mpl_connect('pick_event', on_pick)

plt.show()
Output:
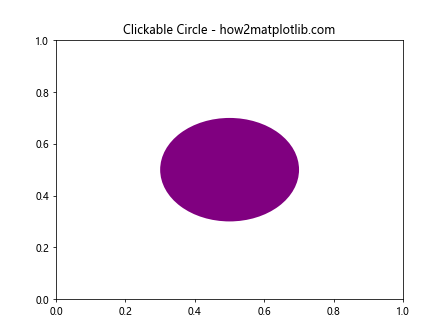
在这个例子中,我们创建了一个可点击的圆,并为其设置了URL。当用户点击圆时,on_pick函数时会被调用,它使用get_url()方法获取URL并尝试在浏览器中打开。
7.2 与set_gid()方法结合
set_gid()方法允许我们为Artist对象设置一个组ID。这在处理大量相似对象时非常有用。我们可以结合get_url()和get_gid()方法来创建更复杂的交互式图表。以下是一个示例:
import matplotlib.pyplot as plt
import numpy as np

fig, ax = plt.subplots()

x = np.random.rand(20)
y = np.random.rand(20)
colors = np.random.rand(20)

scatter = ax.scatter(x, y, c=colors, picker=True)

for i, (xi, yi) in enumerate(zip(x, y)):
    path = scatter.get_paths()[i]
    path.set_gid(f'point_{i}')
    path.set_url(f'https://how2matplotlib.com/data/{i}')

ax.set_title('Scatter Plot with GIDs and URLs - how2matplotlib.com')

def on_pick(event):
    ind = event.ind[0]
    path = scatter.get_paths()[ind]
    gid = path.get_gid()
    url = path.get_url()
    print(f"Clicked point with GID: {gid}, URL: {url}")

fig.canvas.mpl_connect('pick_event', on_pick)

plt.show()
在这个例子中,我们创建了一个散点图,并为每个点设置了唯一的GID和URL。当用户点击一个点时,我们使用get_gid()和get_url()方法获取并打印该点的GID和URL。
7.3 与set_agg_filter()方法结合
set_agg_filter()方法允许我们为Artist对象设置一个自定义的渲染过滤器。我们可以结合get_url()方法来创建基于URL的特殊渲染效果。以下是一个示例:
import matplotlib.pyplot as plt
import numpy as np

def url_based_filter(self, rgbFace):
    url = self.get_url()
    if url and 'important' in url:
        return np.array([1, 0, 0, 1])  # 重要的点显示为红色
    return rgbFace

fig, ax = plt.subplots()

x = np.random.rand(10)
y = np.random.rand(10)

for i, (xi, yi) in enumerate(zip(x, y)):
    circle = plt.Circle((xi, yi), 0.05)
    if i % 2 == 0:
        circle.set_url(f'https://how2matplotlib.com/important/{i}')
    else:
        circle.set_url(f'https://how2matplotlib.com/normal/{i}')
    circle.set_agg_filter(url_based_filter)
    ax.add_patch(circle)

ax.set_title('URL-based Rendering - how2matplotlib.com')
plt.show()

# 打印每个圆的URL
for patch in ax.patches:
    print(f"Circle URL: {patch.get_url()}")
在这个例子中,我们创建了多个圆,并根据它们的URL设置了不同的渲染效果。使用get_url()方法,我们可以在渲染过滤器中获取URL并据此决定渲染效果。
8. get_url()方法在不同类型的图表中的应用
get_url()方法可以应用于各种类型的图表,使它们具有交互性。以下是一些常见图表类型的应用示例:
8.1 在柱状图中应用get_url()
import matplotlib.pyplot as plt
import numpy as np

fig, ax = plt.subplots()

categories = ['A', 'B', 'C', 'D']
values = [3, 7, 2, 5]

bars = ax.bar(categories, values)

for bar in bars:
    height = bar.get_height()
    ax.text(bar.get_x() + bar.get_width()/2., height,
            f'{height}', ha='center', va='bottom')
    bar.set_url(f'https://how2matplotlib.com/category/{bar.get_x()}')

ax.set_title('Interactive Bar Chart - how2matplotlib.com')

# 打印每个柱子的URL
for bar in bars:
    print(f"Bar URL: {bar.get_url()}")

plt.show()
Output:
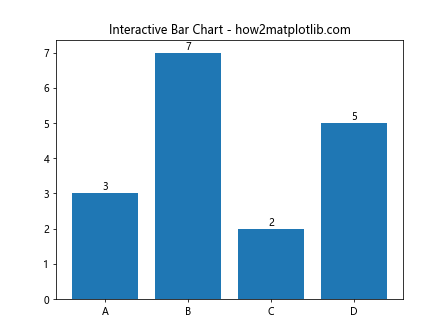
在这个例子中,我们为每个柱子设置了一个URL,并使用get_url()方法获取并打印这些URL。
8.2 在饼图中应用get_url()
import matplotlib.pyplot as plt

fig, ax = plt.subplots()

sizes = [30, 20, 25, 15, 10]
labels = ['A', 'B', 'C', 'D', 'E']

wedges, texts, autotexts = ax.pie(sizes, labels=labels, autopct='%1.1f%%',
                                  startangle=90)

for i, wedge in enumerate(wedges):
    wedge.set_url(f'https://how2matplotlib.com/segment/{labels[i]}')

ax.set_title('Interactive Pie Chart - how2matplotlib.com')

# 打印每个扇形的URL
for wedge in wedges:
    print(f"Wedge URL: {wedge.get_url()}")

plt.show()
Output:
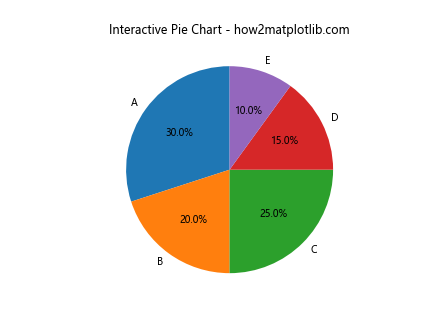
在这个饼图示例中,我们为每个扇形设置了一个URL,并使用get_url()方法获取并打印这些URL。
8.3 在折线图中应用get_url()
import matplotlib.pyplot as plt
import numpy as np

fig, ax = plt.subplots()

x = np.linspace(0, 10, 100)
y1 = np.sin(x)
y2 = np.cos(x)

line1, = ax.plot(x, y1, label='sin')
line2, = ax.plot(x, y2, label='cos')

line1.set_url('https://how2matplotlib.com/sin')
line2.set_url('https://how2matplotlib.com/cos')

ax.legend()
ax.set_title('Interactive Line Plot - how2matplotlib.com')

# 打印每条线的URL
print(f"Sin line URL: {line1.get_url()}")
print(f"Cos line URL: {line2.get_url()}")

plt.show()
Output:
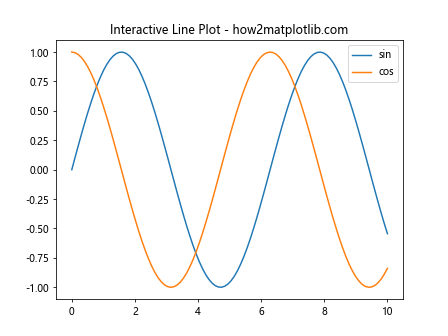
在这个折线图示例中,我们为两条线分别设置了URL,并使用get_url()方法获取并打印这些URL。
9. get_url()方法的高级应用
除了基本的使用场景,get_url()方法还有一些高级应用,可以帮助我们创建更复杂和强大的可视化。
9.1 动态URL生成
我们可以根据数据动态生成URL,使图表更具灵活性和信息量。以下是一个示例:
import matplotlib.pyplot as plt
import numpy as np

fig, ax = plt.subplots()

data = np.random.randn(1000)
n, bins, patches = ax.hist(data, 50, density=True)

for i, patch in enumerate(patches):
    bin_center = (bins[i] + bins[i+1]) / 2
    url = f'https://how2matplotlib.com/histogram/{bin_center:.2f}'
    patch.set_url(url)

ax.set_title('Dynamic URL Generation - how2matplotlib.com')

# 打印一些柱子的URL
for i in range(0, len(patches), 10):
    print(f"Bin {i} URL: {patches[i].get_url()}")

plt.show()
Output:
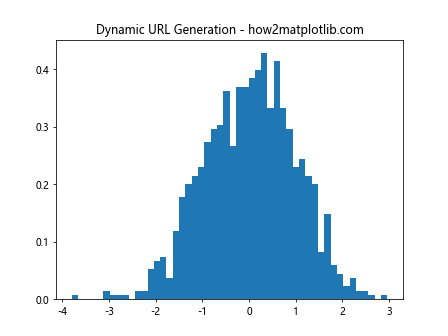
在这个例子中,我们根据直方图的每个bin的中心值动态生成URL,并使用get_url()方法验证设置。
9.2 URL参数化
我们可以在URL中包含参数,以传递更多信息。以下是一个示例:
import matplotlib.pyplot as plt
import numpy as np
from urllib.parse import urlencode

fig, ax = plt.subplots()

x = np.linspace(0, 10, 100)
y = np.sin(x)

line, = ax.plot(x, y)

params = {
    'function': 'sin',
    'amplitude': 1,
    'frequency': 1,
    'phase': 0
}

url = f'https://how2matplotlib.com/plot?{urlencode(params)}'
line.set_url(url)

ax.set_title('URL with Parameters - how2matplotlib.com')

print(f"Line URL: {line.get_url()}")

plt.show()
Output:
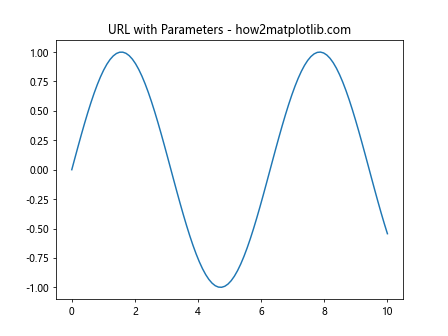
在这个例子中,我们在URL中包含了描述正弦函数的参数,并使用get_url()方法获取完整的URL。
9.3 多层次URL结构
对于复杂的图表,我们可以为不同层次的元素设置不同的URL。以下是一个示例:
import matplotlib.pyplot as plt
import numpy as np

fig, (ax1, ax2) = plt.subplots(1, 2, figsize=(10, 5))

# 第一个子图:散点图
x = np.random.rand(20)
y = np.random.rand(20)
colors = np.random.rand(20)

scatter = ax1.scatter(x, y, c=colors)
ax1.set_title('Scatter Plot')

for i, (xi, yi) in enumerate(zip(x, y)):
    path = scatter.get_paths()[i]
    path.set_url(f'https://how2matplotlib.com/scatter/{i}')

# 第二个子图:柱状图
categories = ['A', 'B', 'C', 'D']
values = [3, 7, 2, 5]

bars = ax2.bar(categories, values)
ax2.set_title('Bar Chart')

for i, bar in enumerate(bars):
    bar.set_url(f'https://how2matplotlib.com/bar/{categories[i]}')

fig.suptitle('Multi-level URL Structure - how2matplotlib.com')

# 为整个图表设置URL
fig.set_url('https://how2matplotlib.com/dashboard')

# 打印URL结构
print(f"Figure URL: {fig.get_url()}")
print("Scatter Plot URLs:")
for path in scatter.get_paths():
    print(f"  {path.get_url()}")
print("Bar Chart URLs:")
for bar in bars:
    print(f"  {bar.get_url()}")

plt.show()
在这个例子中,我们为整个图表、散点图中的每个点和柱状图中的每个柱子设置了不同的URL,创建了一个多层次的URL结构。
10. get_url()方法的性能考虑
虽然get_url()方法本身的性能开销很小,但在处理大量Artist对象时,频繁调用这个方法可能会对性能产生影响。以下是一些优化建议:
- 缓存URL:如果URL不会频繁变化,可以在首次获取后将其缓存,避免重复调用get_url()。
-
批量处理:在处理大量Artist对象时,可以一次性获取所有URL,而不是逐个处理。
-
按需获取:只在真正需要URL时才调用get_url()方法,避免不必要的调用。
以下是一个考虑性能的示例:
import matplotlib.pyplot as plt
import numpy as np
import time

fig, ax = plt.subplots()

n_points = 10000
x = np.random.rand(n_points)
y = np.random.rand(n_points)

scatter = ax.scatter(x, y)

# 设置URL
start_time = time.time()
for i, path in enumerate(scatter.get_paths()):
    path.set_url(f'https://how2matplotlib.com/point/{i}')
print(f"Time to set URLs: {time.time() - start_time:.4f} seconds")

# 低效方法:逐个获取URL
start_time = time.time()
urls = []
for path in scatter.get_paths():
    urls.append(path.get_url())
print(f"Time to get URLs individually: {time.time() - start_time:.4f} seconds")

# 高效方法:批量获取URL
start_time = time.time()
urls = [path.get_url() for path in scatter.get_paths()]
print(f"Time to get URLs in batch: {time.time() - start_time:.4f} seconds")

ax.set_title('Performance Considerations - how2matplotlib.com')
plt.show()
在这个例子中,我们比较了逐个获取URL和批量获取URL的性能差异。通常,批量处理会更快,特别是在处理大量Artist对象时。
结论
Matplotlib的Artist.get_url()方法是一个强大的工具,可以帮助我们创建交互性更强的数据可视化。通过为图表元素添加URL,我们可以将静态图表转变为信息丰富的交互式可视化。本文详细介绍了get_url()方法的使用方法、应用场景以及注意事项,并提供了多个实际示例。
从基本的URL设置和获取,到与其他Artist方法的结合使用,再到在各种类型图表中的应用,我们探讨了get_url()方法的多种用法。我们还讨论了一些高级应用,如动态URL生成、URL参数化和多层次URL结构,这些技巧可以帮助我们创建更复杂和信息丰富的可视化。
最后,我们还考虑了使用get_url()方法时的性能问题,并提供了一些优化建议。通过合理使用这个方法,我们可以在不影响性能的情况下,大大提升Matplotlib图表的交互性和信息量。
总的来说,掌握get_url()方法可以让我们的Matplotlib可视化更上一层楼,为用户提供更丰富的数据探索体验。无论是在数据分析、科学研究还是商业报告中,这个方法都能帮助我们创建更有价值的可视化成果。
 极客笔记
极客笔记