legend loc matplotlib
在matplotlib中,legend(loc)函数可以用来设置图例的位置。图例是用来说明图中线条、点等内容的标签,通常放在图的角落。
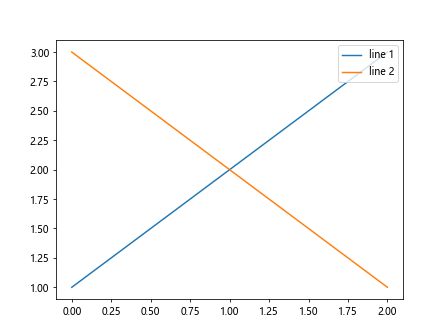
1. 右上角
使用loc='upper right'可以将图例放在右上角位置。
import matplotlib.pyplot as plt

plt.plot([1, 2, 3], label='line 1')
plt.plot([3, 2, 1], label='line 2')
plt.legend(loc='upper right')

plt.show()
Output:
2. 左下角
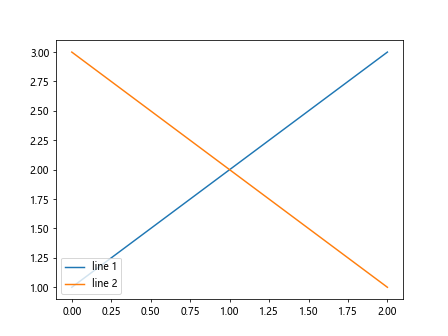
使用loc='lower left'可以将图例放在左下角位置。
import matplotlib.pyplot as plt

plt.plot([1, 2, 3], label='line 1')
plt.plot([3, 2, 1], label='line 2')
plt.legend(loc='lower left')

plt.show()
Output:
3. 右下角
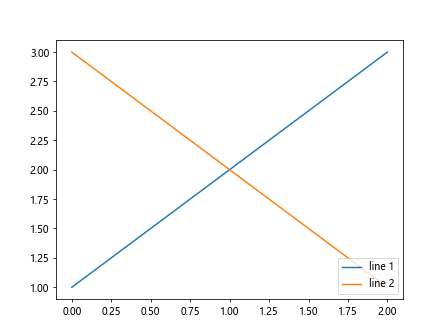
使用loc='lower right'可以将图例放在右下角位置。
import matplotlib.pyplot as plt

plt.plot([1, 2, 3], label='line 1')
plt.plot([3, 2, 1], label='line 2')
plt.legend(loc='lower right')

plt.show()
Output:
4. 左上角
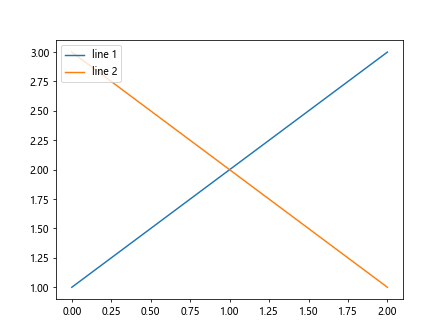
使用loc='upper left'可以将图例放在左上角位置。
import matplotlib.pyplot as plt

plt.plot([1, 2, 3], label='line 1')
plt.plot([3, 2, 1], label='line 2')
plt.legend(loc='upper left')

plt.show()
Output:
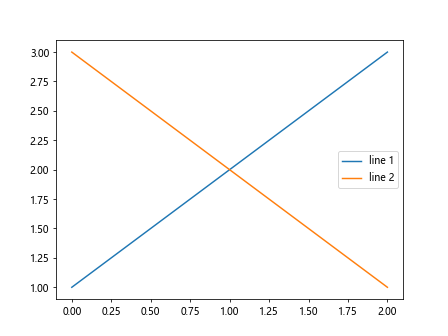
5. 右中
使用loc='center right'可以将图例放在右中位置。
import matplotlib.pyplot as plt

plt.plot([1, 2, 3], label='line 1')
plt.plot([3, 2, 1], label='line 2')
plt.legend(loc='center right')

plt.show()
Output:
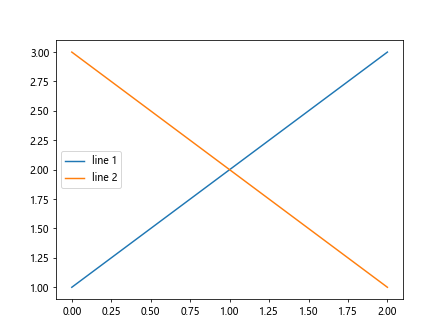
6. 左中
使用loc='center left'可以将图例放在左中位置。
import matplotlib.pyplot as plt

plt.plot([1, 2, 3], label='line 1')
plt.plot([3, 2, 1], label='line 2')
plt.legend(loc='center left')

plt.show()
Output:
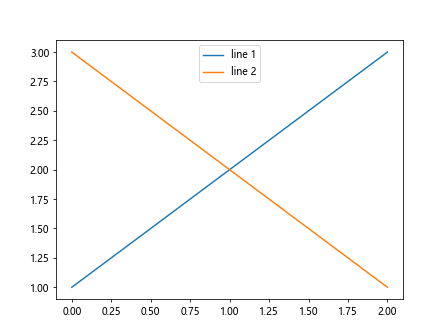
7. 中上
使用loc='upper center'可以将图例放在中上位置。
import matplotlib.pyplot as plt

plt.plot([1, 2, 3], label='line 1')
plt.plot([3, 2, 1], label='line 2')
plt.legend(loc='upper center')

plt.show()
Output:
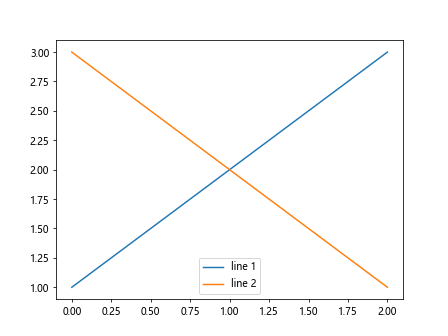
8. 中下
使用loc='lower center'可以将图例放在中下位置。
import matplotlib.pyplot as plt

plt.plot([1, 2, 3], label='line 1')
plt.plot([3, 2, 1], label='line 2')
plt.legend(loc='lower center')

plt.show()
Output:
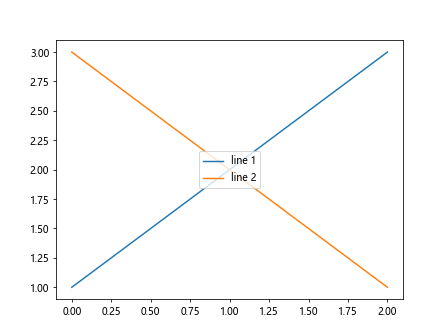
9. 中心
使用loc='center'可以将图例放在中心位置。
import matplotlib.pyplot as plt

plt.plot([1, 2, 3], label='line 1')
plt.plot([3, 2, 1], label='line 2')
plt.legend(loc='center')

plt.show()
Output:
10. 右顶
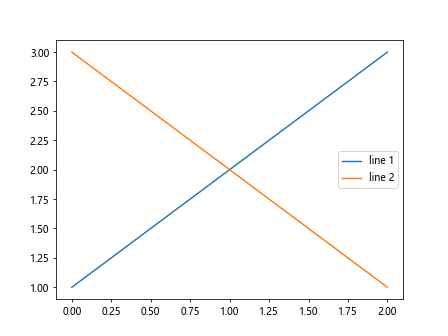
使用loc='best'可以将图例放在适合的位置,通常是图中不覆盖其他数据的最佳位置。
import matplotlib.pyplot as plt

plt.plot([1, 2, 3], label='line 1')
plt.plot([3, 2, 1], label='line 2')
plt.legend(loc='best')

plt.show()
Output:
结论
通过以上示例代码,我们可以看到如何在matplotlib中设置图例的位置。选择合适的位置可以使图例信息清晰展示,提高图表的可读性。不同的位置会对整体布局产生影响,需要根据具体情况选择合适的位置,以便突出图中重要信息。
 极客笔记
极客笔记