增加Matplotlib子图之间的间距
参考:increase spacing between subplots matplotlib
在Matplotlib中,我们经常需要绘制多个子图并排展示。然而,默认情况下,子图之间的间距可能会显得有些拥挤。为了改善这种情况,我们可以通过一些方法来增加子图之间的间距,使整体图表看起来更加美观和清晰。
使用subplots_adjust方法调整子图间距
subplots_adjust方法可以帮助我们调整子图之间的间距。我们可以通过传入参数控制上、下、左、右的边距,以及整体图表的宽度和高度。接下来,我们通过几个示例代码来演示如何使用subplots_adjust方法来调整子图之间的间距。
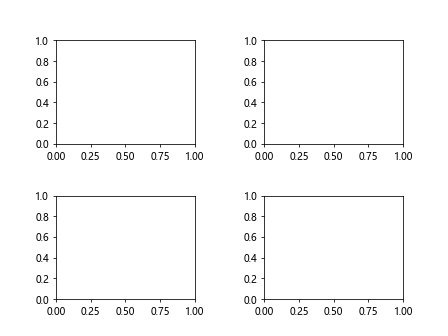
import matplotlib.pyplot as plt

fig, axs = plt.subplots(2, 2)
plt.subplots_adjust(wspace=0.5, hspace=0.5)
plt.show()
Output:

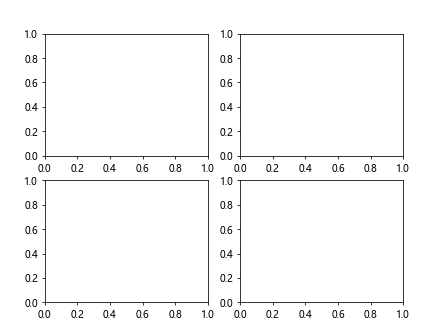
import matplotlib.pyplot as plt

fig, axs = plt.subplots(2, 2)
plt.subplots_adjust(left=0.1, right=0.9, top=0.9, bottom=0.1)
plt.show()
Output:

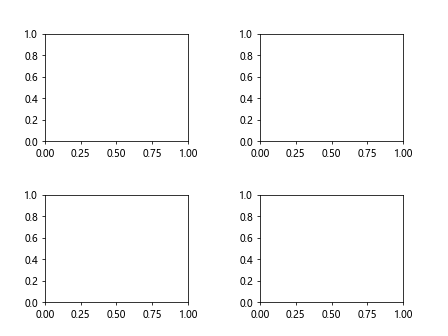
import matplotlib.pyplot as plt

fig, axs = plt.subplots(2, 2)
plt.subplots_adjust(left=0.1, right=0.9, top=0.9, bottom=0.1, wspace=0.5, hspace=0.5)
plt.show()
Output:

使用tight_layout方法自动调整子图间距
除了手动调整子图间距外,Matplotlib还提供了tight_layout方法来自动调整子图的布局,使其更加美观。tight_layout方法会尽可能地减小子图之间的间距,确保它们之间的空间被最大程度地利用。
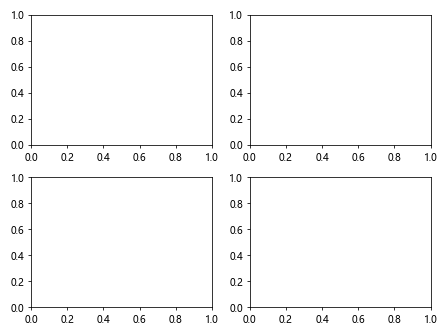
import matplotlib.pyplot as plt

fig, axs = plt.subplots(2, 2)
plt.tight_layout()
plt.show()
Output:

结语
通过以上介绍,我们学习了如何通过subplots_adjust方法和tight_layout方法来调整Matplotlib子图之间的间距,使整体图表看起来更加清晰和美观。在实际应用中,根据需要适当调整子图间距可以帮助我们呈现更加优秀的数据可视化效果。
 极客笔记
极客笔记