legend position matplotlib
在使用Matplotlib绘制图表时,图例是一个非常重要的元素,它能够标识出不同数据系列的含义,方便观众理解图表内容。然而,有时候默认的图例位置并不是最佳的选择,需要我们手动调整图例的位置。本文将介绍如何使用Matplotlib中的legend方法来设置图例的位置。
1. 图例位置示例一
import matplotlib.pyplot as plt

x = [1, 2, 3, 4, 5]
y1 = [1, 4, 9, 16, 25]
y2 = [5, 10, 15, 20, 25]

plt.plot(x, y1, label='Line 1')
plt.plot(x, y2, label='Line 2')

plt.legend(loc='upper right')
plt.show()
Output:
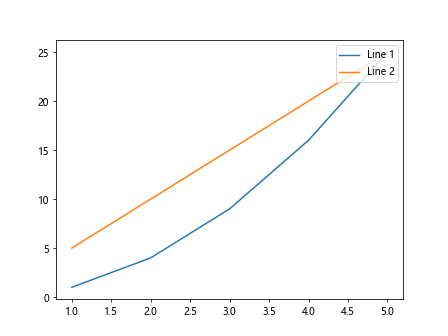
在上面的示例中,我们使用loc='upper right'参数将图例放置在图表的右上角。
2. 图例位置示例二
import matplotlib.pyplot as plt

x = [1, 2, 3, 4, 5]
y1 = [1, 4, 9, 16, 25]
y2 = [5, 10, 15, 20, 25]

plt.plot(x, y1, label='Line 1')
plt.plot(x, y2, label='Line 2')

plt.legend(loc='lower left')
plt.show()
Output:
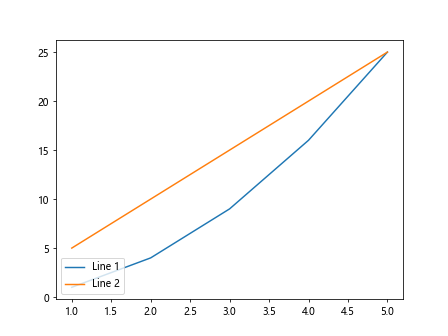
在这个示例中,我们使用loc='lower left'参数将图例放置在图表的左下角。
3. 图例位置示例三
import matplotlib.pyplot as plt

x = [1, 2, 3, 4, 5]
y1 = [1, 4, 9, 16, 25]
y2 = [5, 10, 15, 20, 25]

plt.plot(x, y1, label='Line 1')
plt.plot(x, y2, label='Line 2')

plt.legend(loc='center')
plt.show()
Output:
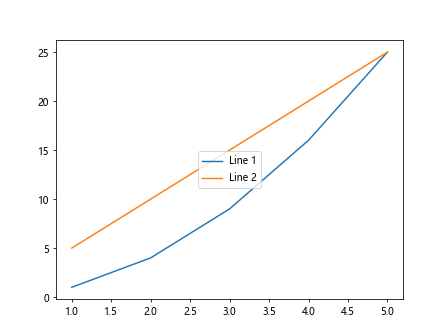
在这个示例中,我们使用loc='center'参数将图例放置在图表的中心位置。
4. 图例位置示例四
import matplotlib.pyplot as plt

x = [1, 2, 3, 4, 5]
y1 = [1, 4, 9, 16, 25]
y2 = [5, 10, 15, 20, 25]

plt.plot(x, y1, label='Line 1')
plt.plot(x, y2, label='Line 2')

plt.legend(loc='lower right')
plt.show()
Output:
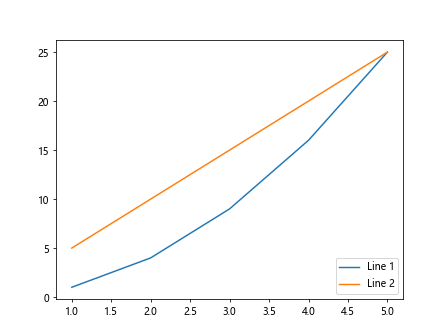
在这个示例中,我们使用loc='lower right'参数将图例放置在图表的右下角。
5. 图例位置示例五
import matplotlib.pyplot as plt

x = [1, 2, 3, 4, 5]
y1 = [1, 4, 9, 16, 25]
y2 = [5, 10, 15, 20, 25]

plt.plot(x, y1, label='Line 1')
plt.plot(x, y2, label='Line 2')

plt.legend(loc='center left')
plt.show()
Output:
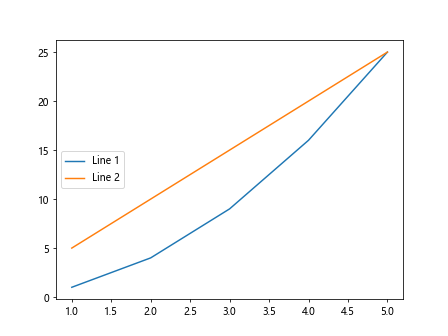
在这个示例中,我们使用loc='center left'参数将图例放置在图表的左边中心位置。
6. 图例位置示例六
import matplotlib.pyplot as plt

x = [1, 2, 3, 4, 5]
y1 = [1, 4, 9, 16, 25]
y2 = [5, 10, 15, 20, 25]

plt.plot(x, y1, label='Line 1')
plt.plot(x, y2, label='Line 2')

plt.legend(loc='center right')
plt.show()
Output:
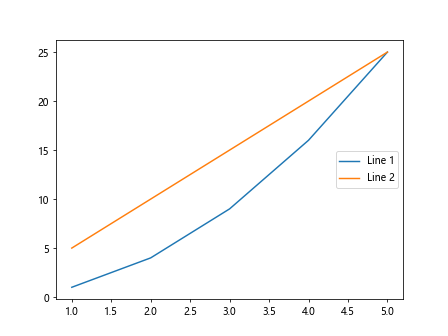
在这个示例中,我们使用loc='center right'参数将图例放置在图表的右边中心位置。
7. 图例位置示例七
import matplotlib.pyplot as plt

x = [1, 2, 3, 4, 5]
y1 = [1, 4, 9, 16, 25]
y2 = [5, 10, 15, 20, 25]

plt.plot(x, y1, label='Line 1')
plt.plot(x, y2, label='Line 2')

plt.legend(loc='upper left')
plt.show()
Output:
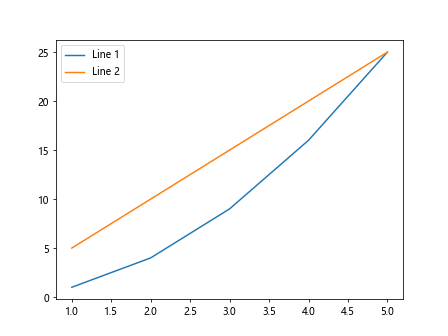
在这个示例中,我们使用loc='upper left'参数将图例放置在图表的左上角。
8. 图例位置示例八
import matplotlib.pyplot as plt

x = [1, 2, 3, 4, 5]
y1 = [1, 4, 9, 16, 25]
y2 = [5, 10, 15, 20, 25]

plt.plot(x, y1, label='Line 1')
plt.plot(x, y2, label='Line 2')

plt.legend(loc='center')
plt.show()
Output:
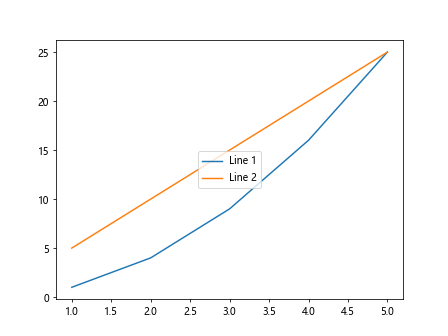
在这个示例中,我们使用loc='center'参数将图例放置在图表的中心位置。
9. 图例位置示例九
import matplotlib.pyplot as plt

x = [1, 2, 3, 4, 5]
y1 = [1, 4, 9, 16, 25]
y2 = [5, 10, 15, 20, 25]

plt.plot(x, y1, label='Line 1')
plt.plot(x, y2, label='Line 2')

plt.legend(loc='upper center')
plt.show()
Output:
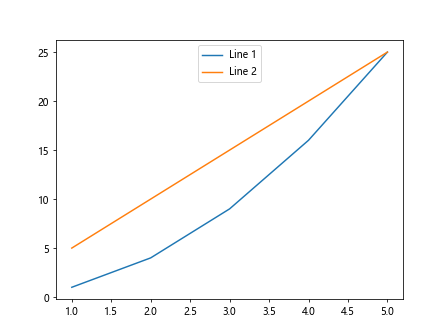
在这个示例中,我们使用loc='upper center'参数将图例放置在图表的上中位置。
10. 图例位置示例十
import matplotlib.pyplot as plt

x = [1, 2, 3, 4, 5]
y1 = [1, 4, 9, 16, 25]
y2 = [5, 10, 15, 20, 25]

plt.plot(x, y1, label='Line 1')
plt.plot(x, y2, label='Line 2')

plt.legend(loc='lower center')
plt.show()
Output:
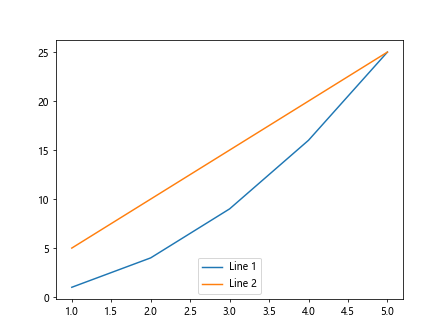
在这个示例中,我们使用loc='lower center'参数将图例放置在图表的下中位置。
 极客笔记
极客笔记