如何在matplotlib中绘制多条线
参考:how to plot multiple lines in matplotlib
在数据可视化中,经常需要在图表中同时绘制多条线,以展示不同数据之间的关系。matplotlib是一个功能强大的Python绘图库,可以轻松绘制多条线图。
基本折线图
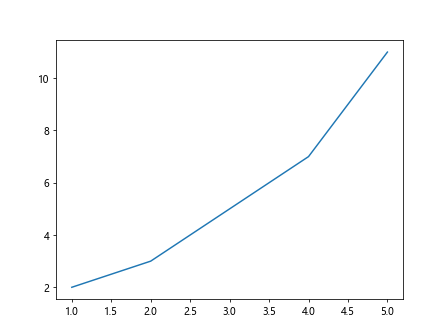
首先我们来看一个基本的折线图示例,展示如何用matplotlib绘制单条线:
import matplotlib.pyplot as plt

x = [1, 2, 3, 4, 5]
y = [2, 3, 5, 7, 11]

plt.plot(x, y)
plt.show()
Output:
绘制多条线
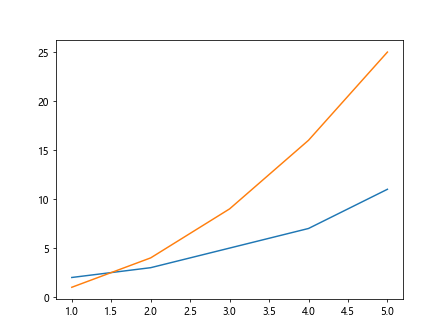
要在同一张图中绘制多条线,只需调用多次plt.plot()即可。每次调用plt.plot()时,可以传入不同的x和y值来绘制不同的线条。
import matplotlib.pyplot as plt

x = [1, 2, 3, 4, 5]
y1 = [2, 3, 5, 7, 11]
y2 = [1, 4, 9, 16, 25]

plt.plot(x, y1)
plt.plot(x, y2)
plt.show()
Output:
自定义线条颜色
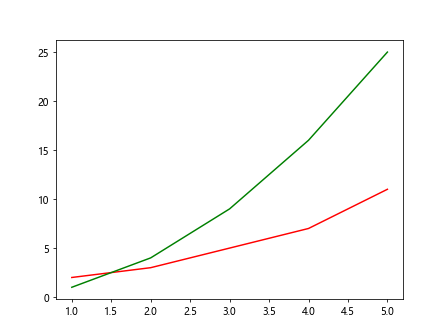
我们可以通过传入color参数来自定义线条的颜色。常用的颜色包括'r'(红色)、'g'(绿色)、'b'(蓝色)等。
import matplotlib.pyplot as plt

x = [1, 2, 3, 4, 5]
y1 = [2, 3, 5, 7, 11]
y2 = [1, 4, 9, 16, 25]

plt.plot(x, y1, color='r')
plt.plot(x, y2, color='g')
plt.show()
Output:
调整线条样式
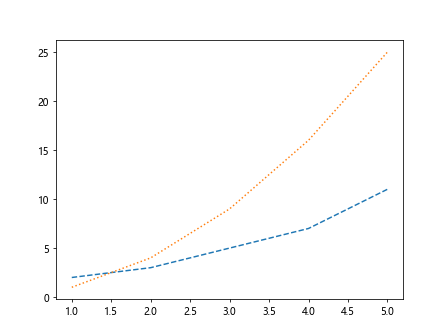
除了颜色,我们还可以通过传入linestyle参数来调整线条的样式。常用的线条样式包括'-'(实线)、'--'(虚线)、':'(点线)等。
import matplotlib.pyplot as plt

x = [1, 2, 3, 4, 5]
y1 = [2, 3, 5, 7, 11]
y2 = [1, 4, 9, 16, 25]

plt.plot(x, y1, linestyle='--')
plt.plot(x, y2, linestyle=':')
plt.show()
Output:
添加图例
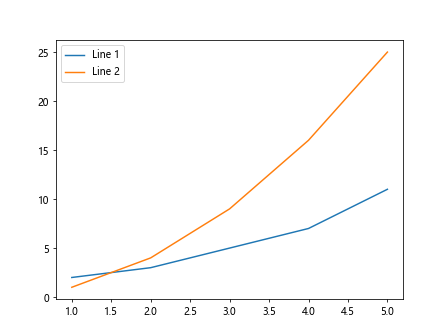
当绘制多条线时,可以通过plt.legend()方法来添加图例,以便区分不同线条代表的数据。
import matplotlib.pyplot as plt

x = [1, 2, 3, 4, 5]
y1 = [2, 3, 5, 7, 11]
y2 = [1, 4, 9, 16, 25]

plt.plot(x, y1, label='Line 1')
plt.plot(x, y2, label='Line 2')
plt.legend()
plt.show()
Output:
设置线条宽度
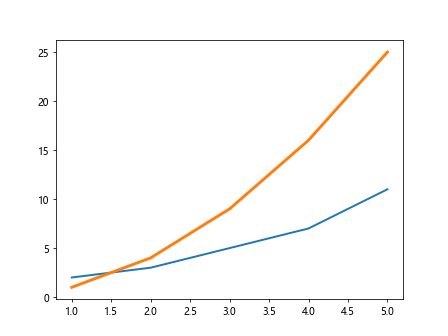
如果希望调整线条的粗细,可以通过传入linewidth参数来设置线条的宽度。
import matplotlib.pyplot as plt

x = [1, 2, 3, 4, 5]
y1 = [2, 3, 5, 7, 11]
y2 = [1, 4, 9, 16, 25]

plt.plot(x, y1, linewidth=2)
plt.plot(x, y2, linewidth=3)
plt.show()
Output:
使用不同标记点
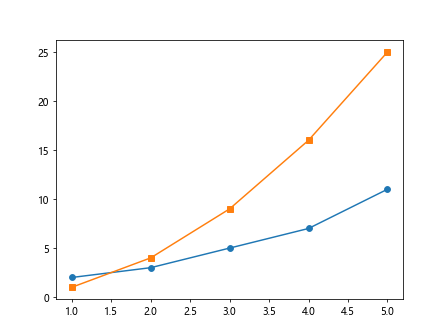
我们还可以在折线图中使用不同的标记点来标识数据点。常用的标记包括'o'(圆点)、's'(方形点)、'^'(三角点)等。
import matplotlib.pyplot as plt

x = [1, 2, 3, 4, 5]
y1 = [2, 3, 5, 7, 11]
y2 = [1, 4, 9, 16, 25]

plt.plot(x, y1, marker='o')
plt.plot(x, y2, marker='s')
plt.show()
Output:
调整坐标轴范围
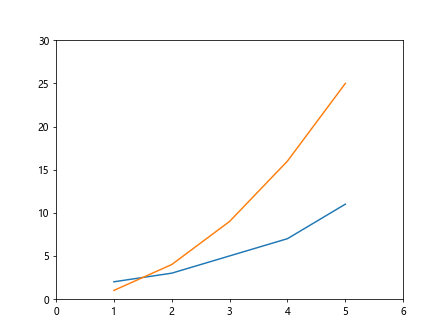
如果希望调整坐标轴的范围,可以通过传入plt.xlim()和plt.ylim()方法来设置x和y轴的取值范围。
import matplotlib.pyplot as plt

x = [1, 2, 3, 4, 5]
y1 = [2, 3, 5, 7, 11]
y2 = [1, 4, 9, 16, 25]

plt.plot(x, y1)
plt.plot(x, y2)

plt.xlim(0, 6)
plt.ylim(0, 30)

plt.show()
Output:
设置坐标轴标签
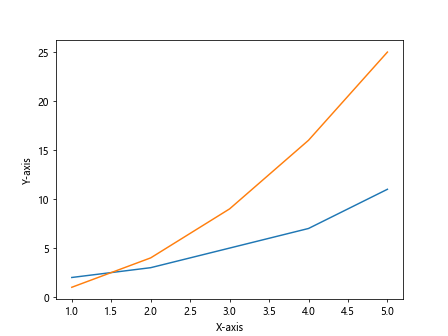
为了让图表更加直观,我们可以通过plt.xlabel()和plt.ylabel()方法来设置x和y轴的标签。
import matplotlib.pyplot as plt

x = [1, 2, 3, 4, 5]
y1 = [2, 3, 5, 7, 11]
y2 = [1, 4, 9, 16, 25]

plt.plot(x, y1)
plt.plot(x, y2)

plt.xlabel('X-axis')
plt.ylabel('Y-axis')

plt.show()
Output:
添加标题
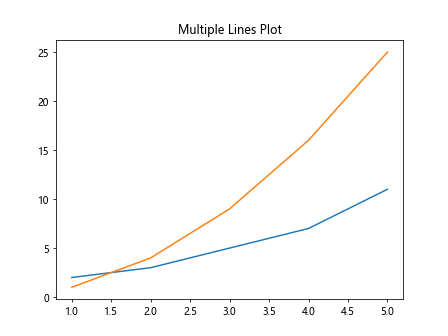
最后,我们可以通过plt.title()方法来添加图表的标题,让整个图表更具可读性。
import matplotlib.pyplot as plt

x = [1, 2, 3, 4, 5]
y1 = [2, 3, 5, 7, 11]
y2 = [1, 4, 9, 16, 25]

plt.plot(x, y1)
plt.plot(x, y2)

plt.title('Multiple Lines Plot')
plt.show()
Output:
通过上面的示例,我们了解了如何在matplotlib中绘制多条线,并对线条的颜色、样式、宽度、标记点、坐标轴范围、标签和标题等进行了设置。
 极客笔记
极客笔记