如何在Python中移除Matplotlib图形的边框
参考:How to remove the frame from a Matplotlib figure in Python
Matplotlib是Python中最流行的数据可视化库之一,它提供了丰富的绘图功能和自定义选项。在创建图表时,有时我们可能希望移除图形周围的边框,以获得更简洁、更专业的外观。本文将详细介绍如何在Python中使用Matplotlib移除图形的边框,并提供多种方法和技巧来实现这一目标。
1. 理解Matplotlib图形结构
在开始移除边框之前,我们需要了解Matplotlib图形的基本结构。一个典型的Matplotlib图形由以下几个主要部分组成:
- Figure(图形):整个图形的容器
- Axes(坐标轴):包含数据的实际绘图区域
- Spines(脊柱):围绕坐标轴的边界线
边框通常由四条脊柱组成:top(顶部)、bottom(底部)、left(左侧)和right(右侧)。要移除边框,我们需要操作这些脊柱。
让我们从一个基本的示例开始,创建一个简单的图形:
import matplotlib.pyplot as plt

# 创建数据
x = [1, 2, 3, 4, 5]
y = [2, 4, 6, 8, 10]

# 创建图形和坐标轴
fig, ax = plt.subplots()

# 绘制数据
ax.plot(x, y, label='how2matplotlib.com')

# 添加标题和标签
ax.set_title('Basic Plot')
ax.set_xlabel('X-axis')
ax.set_ylabel('Y-axis')

# 显示图例
ax.legend()

# 显示图形
plt.show()
Output:
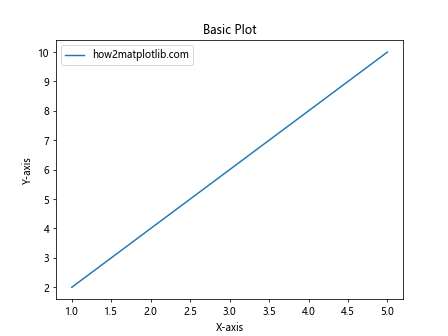
这个示例创建了一个基本的线图,包含完整的边框。接下来,我们将探讨如何移除这个边框。
2. 使用spines属性移除边框
最直接的方法是使用Axes对象的spines属性来操作脊柱。我们可以通过将脊柱的颜色设置为’none’或将其可见性设置为False来移除边框。
import matplotlib.pyplot as plt

x = [1, 2, 3, 4, 5]
y = [2, 4, 6, 8, 10]

fig, ax = plt.subplots()
ax.plot(x, y, label='how2matplotlib.com')

# 移除所有脊柱
for spine in ax.spines.values():
    spine.set_visible(False)

ax.set_title('Plot without Frame')
ax.set_xlabel('X-axis')
ax.set_ylabel('Y-axis')
ax.legend()

plt.show()
Output:
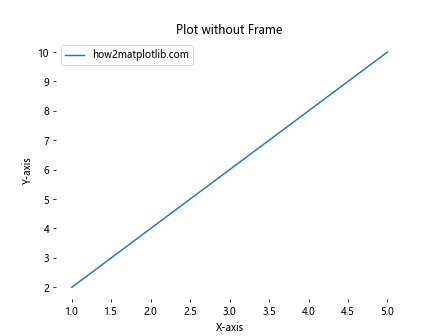
在这个示例中,我们遍历了所有的脊柱,并将它们的可见性设置为False。这样就移除了整个边框。
3. 选择性移除特定边框
有时,我们可能只想移除部分边框,而保留其他部分。例如,我们可能想保留底部和左侧的边框,以便更好地显示坐标轴。
import matplotlib.pyplot as plt

x = [1, 2, 3, 4, 5]
y = [2, 4, 6, 8, 10]

fig, ax = plt.subplots()
ax.plot(x, y, label='how2matplotlib.com')

# 移除顶部和右侧的脊柱
ax.spines['top'].set_visible(False)
ax.spines['right'].set_visible(False)

ax.set_title('Plot with Partial Frame')
ax.set_xlabel('X-axis')
ax.set_ylabel('Y-axis')
ax.legend()

plt.show()
Output:
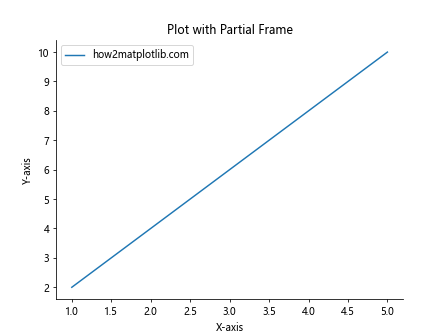
这个示例保留了底部和左侧的边框,给图表一个更开放的感觉,同时仍然提供了坐标参考。
4. 使用ax.axis()方法移除边框
另一种移除边框的方法是使用ax.axis()方法。通过将其设置为’off’,我们可以一次性移除所有边框和刻度。
import matplotlib.pyplot as plt

x = [1, 2, 3, 4, 5]
y = [2, 4, 6, 8, 10]

fig, ax = plt.subplots()
ax.plot(x, y, label='how2matplotlib.com')

# 移除所有边框和刻度
ax.axis('off')

ax.set_title('Plot with axis off')
plt.show()
Output:
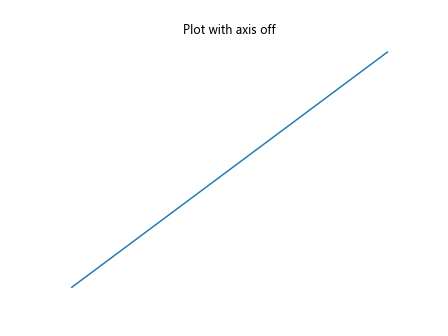
这种方法非常简单,但它也会移除所有的刻度和标签。如果你想保留这些元素,可能需要使用其他方法。
5. 使用seaborn库简化过程
Seaborn是基于Matplotlib的统计数据可视化库,它提供了一些便捷的函数来设置图形样式,包括移除边框。
import matplotlib.pyplot as plt
import seaborn as sns

x = [1, 2, 3, 4, 5]
y = [2, 4, 6, 8, 10]

# 设置Seaborn样式
sns.set_style("whitegrid")

fig, ax = plt.subplots()
ax.plot(x, y, label='how2matplotlib.com')

# 移除顶部和右侧的脊柱
sns.despine()

ax.set_title('Seaborn Style Plot')
ax.set_xlabel('X-axis')
ax.set_ylabel('Y-axis')
ax.legend()

plt.show()
Output:
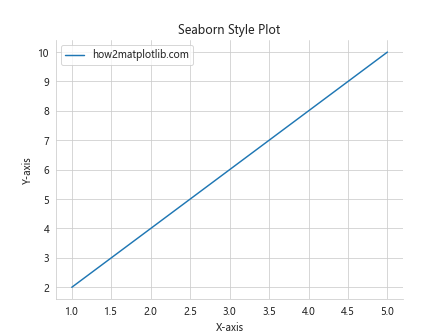
在这个示例中,我们使用了Seaborn的set_style()函数来设置整体样式,然后使用despine()函数移除顶部和右侧的边框。这提供了一个快速而优雅的解决方案。
6. 自定义边框样式
除了完全移除边框,我们还可以自定义边框的样式,例如改变颜色、线宽或线型。
import matplotlib.pyplot as plt

x = [1, 2, 3, 4, 5]
y = [2, 4, 6, 8, 10]

fig, ax = plt.subplots()
ax.plot(x, y, label='how2matplotlib.com')

# 自定义边框样式
ax.spines['top'].set_visible(False)
ax.spines['right'].set_visible(False)
ax.spines['bottom'].set_color('red')
ax.spines['left'].set_linewidth(2)

ax.set_title('Customized Frame')
ax.set_xlabel('X-axis')
ax.set_ylabel('Y-axis')
ax.legend()

plt.show()
Output:
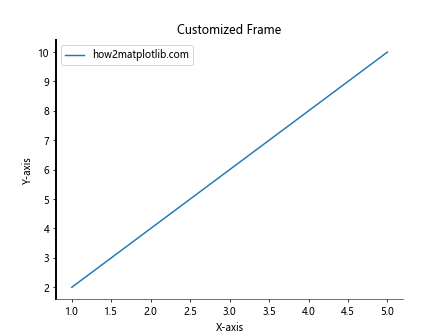
这个示例展示了如何移除顶部和右侧的边框,同时自定义底部和左侧边框的颜色和线宽。
7. 在子图中移除边框
当使用多个子图时,我们可能需要为每个子图单独设置边框样式。
import matplotlib.pyplot as plt

fig, (ax1, ax2) = plt.subplots(1, 2, figsize=(10, 4))

x = [1, 2, 3, 4, 5]
y1 = [2, 4, 6, 8, 10]
y2 = [1, 3, 5, 7, 9]

ax1.plot(x, y1, label='how2matplotlib.com')
ax2.plot(x, y2, label='how2matplotlib.com')

# 移除第一个子图的所有边框
for spine in ax1.spines.values():
    spine.set_visible(False)

# 移除第二个子图的顶部和右侧边框
ax2.spines['top'].set_visible(False)
ax2.spines['right'].set_visible(False)

ax1.set_title('Subplot 1 - No Frame')
ax2.set_title('Subplot 2 - Partial Frame')

ax1.legend()
ax2.legend()

plt.tight_layout()
plt.show()
Output:
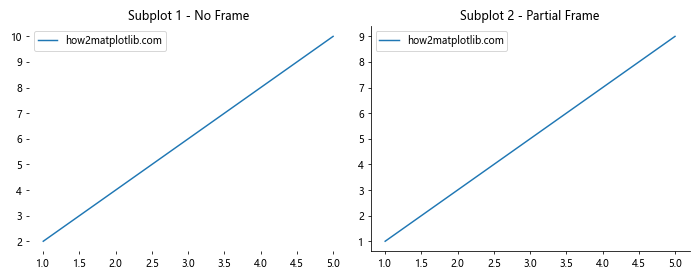
这个示例创建了两个子图,并为每个子图应用了不同的边框样式。
8. 使用plt.box()函数
plt.box()函数提供了一种简单的方法来切换边框的可见性。
import matplotlib.pyplot as plt

x = [1, 2, 3, 4, 5]
y = [2, 4, 6, 8, 10]

plt.figure()
plt.plot(x, y, label='how2matplotlib.com')

# 移除边框
plt.box(False)

plt.title('Plot using plt.box(False)')
plt.xlabel('X-axis')
plt.ylabel('Y-axis')
plt.legend()

plt.show()
Output:
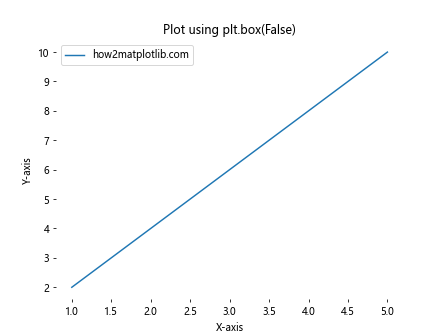
这种方法非常简洁,适用于快速移除整个边框的情况。
9. 结合grid()函数使用
有时,我们可能想要移除边框但保留网格线,以提供更好的数据参考。
import matplotlib.pyplot as plt

x = [1, 2, 3, 4, 5]
y = [2, 4, 6, 8, 10]

fig, ax = plt.subplots()
ax.plot(x, y, label='how2matplotlib.com')

# 移除所有脊柱
for spine in ax.spines.values():
    spine.set_visible(False)

# 添加网格线
ax.grid(True, linestyle='--', alpha=0.7)

ax.set_title('Plot with Grid and No Frame')
ax.set_xlabel('X-axis')
ax.set_ylabel('Y-axis')
ax.legend()

plt.show()
Output:
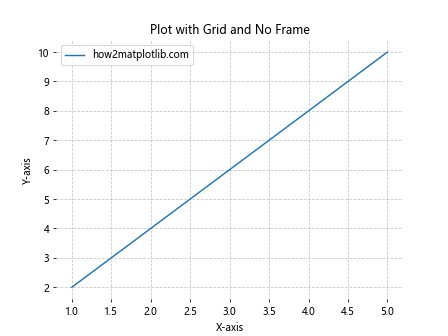
这个示例移除了边框,但添加了网格线,为数据提供了参考而不影响整体的开放感。
10. 使用面向对象的方法
虽然我们之前的例子主要使用了pyplot接口,但使用面向对象的方法可以提供更多的灵活性和控制。
import matplotlib.pyplot as plt
import matplotlib.patches as patches

fig = plt.figure()
ax = fig.add_subplot(111)

x = [1, 2, 3, 4, 5]
y = [2, 4, 6, 8, 10]

ax.plot(x, y, label='how2matplotlib.com')

# 移除所有脊柱
for spine in ax.spines.values():
    spine.set_visible(False)

# 添加自定义边框
rect = patches.Rectangle((0,0), 1, 1, fill=False, transform=ax.transAxes)
ax.add_patch(rect)

ax.set_title('Custom Border using Patches')
ax.set_xlabel('X-axis')
ax.set_ylabel('Y-axis')
ax.legend()

plt.show()
Output:
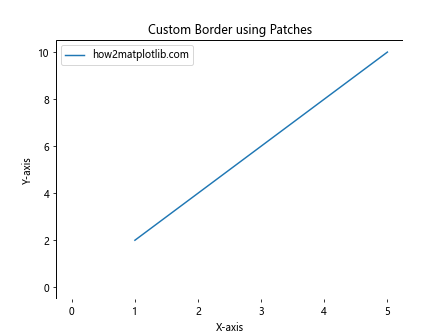
这个示例展示了如何使用matplotlib.patches模块添加自定义边框,这提供了更高级的控制选项。
11. 在极坐标图中移除边框
极坐标图有些特殊,因为它们的”边框”实际上是一个圆。我们可以通过设置极轴的参数来移除这个圆形边框。
import numpy as np
import matplotlib.pyplot as plt

r = np.arange(0, 2, 0.01)
theta = 2 * np.pi * r

fig, ax = plt.subplots(subplot_kw={'projection': 'polar'})
ax.plot(theta, r, label='how2matplotlib.com')

# 移除径向刻度和标签
ax.set_rticks([])

# 移除圆形边框
ax.spines['polar'].set_visible(False)

ax.set_title('Polar Plot without Frame')
ax.legend()

plt.show()
Output:
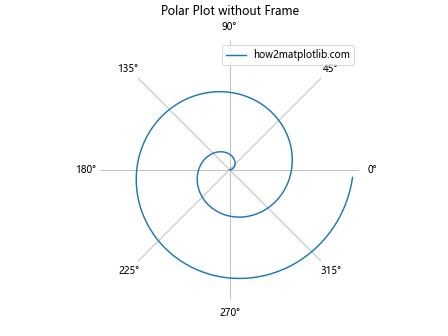
这个示例创建了一个极坐标图,并移除了圆形边框和径向刻度,给出了一个更简洁的外观。
12. 在3D图中移除边框
对于3D图,移除边框的过程略有不同,因为我们需要处理三个平面。
import numpy as np
import matplotlib.pyplot as plt
from mpl_toolkits.mplot3d import Axes3D

fig = plt.figure()
ax = fig.add_subplot(111, projection='3d')

# 创建数据
x = np.arange(-5, 5, 0.25)
y = np.arange(-5, 5, 0.25)
x, y = np.meshgrid(x, y)
r = np.sqrt(x**2 + y**2)
z = np.sin(r)

# 绘制曲面
surf = ax.plot_surface(x, y, z, cmap='viridis')

# 移除边框
ax.set_axis_off()

ax.set_title('3D Plot without Frame')

# 添加颜色条
fig.colorbar(surf, shrink=0.5, aspect=5)

plt.show()
Output:
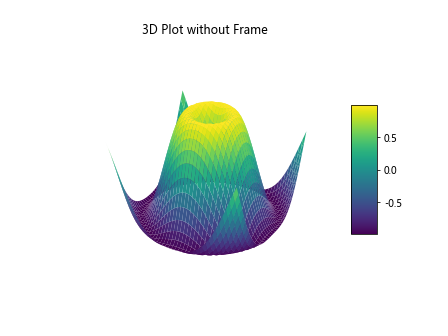
这个示例创建了一个3D曲面图,并通过设置ax.set_axis_off()来移除所有的边框和轴。
13. 使用style sheets
Matplotlib提供了样式表(style sheets),可以一次性设置多个绘图参数,包括边框的样式。
import matplotlib.pyplot as plt

# 使用'ggplot'样式
plt.style.use('ggplot')

x = [1, 2, 3, 4, 5]
y = [2, 4, 6, 8, 10]

fig, ax = plt.subplots()
ax.plot(x, y, label='how2matplotlib.com')

ax.set_title('Plot using ggplot style')
ax.set_xlabel('X-axis')
ax.set_ylabel('Y-axis')
ax.legend()

plt.show()
Output:
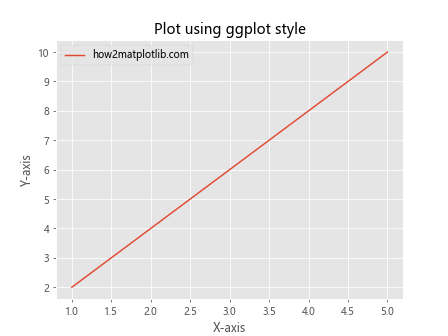
这个示例使用了’ggplot’样式,它默认移除了顶部和右侧的边框,给出了一个类似R语言ggplot2库的外观。
14. 在热图中移除边框
热图(heatmap)是另一种常见的图表类型,我们可能想要移除其边框以获得更清晰的视觉效果。
import numpy as np
import matplotlib.pyplot as plt

# 创建数据
data = np.random.rand(10, 10)

fig, ax = plt.subplots()
im = ax.imshow(data, cmap='viridis')

# 移除边框
ax.spines['top'].set_visible(False)
ax.spines['right'].set_visible(False)
ax.spines['bottom'].set_visible(False)
ax.spines['left'].set_visible(False)

# 添加颜色条
cbar = plt.colorbar(im)
cbar.outline.set_visible(False)

ax.set_title('Heatmap without Frame')
ax.set_xlabel('X-axis')
ax.set_ylabel('Y-axis')

plt.show()
Output:
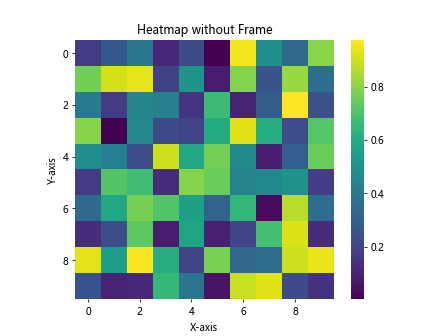
这个示例创建了一个热图,并移除了所有边框,包括颜色条的边框,以获得一个更干净的外观。
15. 在箱线图中移除边框
箱线图(box plot)是统计学中常用的图表类型,移除其边框可以使数据更加突出。
import matplotlib.pyplot as plt
import numpy as np

# 创建数据
data = [np.random.normal(0, std, 100) for std in range(1, 4)]

fig, ax = plt.subplots()
bp = ax.boxplot(data, patch_artist=True)

# 移除边框
for spine in ax.spines.values():
    spine.set_visible(False)

# 自定义箱线图颜色
colors = ['lightblue', 'lightgreen', 'lightpink']
for patch, color in zip(bp['boxes'], colors):
    patch.set_facecolor(color)

ax.set_title('Box Plot without Frame')
ax.set_xlabel('Groups')
ax.set_ylabel('Values')

plt.show()
Output:
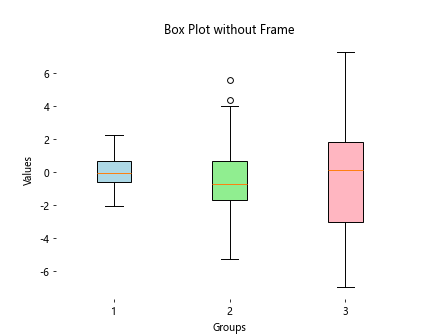
这个示例创建了一个箱线图,移除了所有边框,并为每个箱子设置了不同的颜色,使数据更加突出。
16. 在散点图中移除边框
散点图是另一种常见的图表类型,移除边框可以让数据点更加突出。
import matplotlib.pyplot as plt
import numpy as np

# 创建数据
x = np.random.rand(50)
y = np.random.rand(50)
colors = np.random.rand(50)
sizes = 1000 * np.random.rand(50)

fig, ax = plt.subplots()
scatter = ax.scatter(x, y, c=colors, s=sizes, alpha=0.5, cmap='viridis')

# 移除边框
for spine in ax.spines.values():
    spine.set_visible(False)

# 添加颜色条
plt.colorbar(scatter)

ax.set_title('Scatter Plot without Frame')
ax.set_xlabel('X-axis')
ax.set_ylabel('Y-axis')

plt.show()
Output:
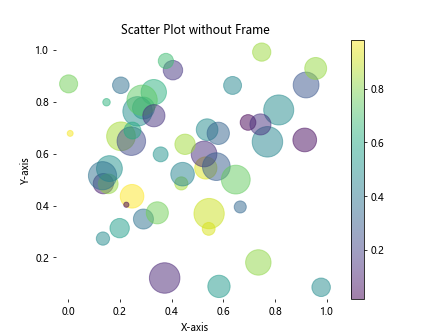
这个示例创建了一个散点图,移除了所有边框,并使用颜色和大小来表示额外的维度。
17. 在饼图中移除边框
饼图通常不需要边框,但有时可能会出现不必要的边框或轮廓。
import matplotlib.pyplot as plt

# 创建数据
sizes = [30, 20, 25, 15, 10]
labels = ['A', 'B', 'C', 'D', 'E']
colors = ['#ff9999', '#66b3ff', '#99ff99', '#ffcc99', '#ff99cc']

fig, ax = plt.subplots()
ax.pie(sizes, labels=labels, colors=colors, autopct='%1.1f%%', startangle=90)

# 确保饼图是圆形的
ax.axis('equal')

# 移除边框(虽然饼图默认没有边框,但这可以确保没有任何边框)
ax.set_frame_on(False)

ax.set_title('Pie Chart without Frame')

plt.show()
Output:
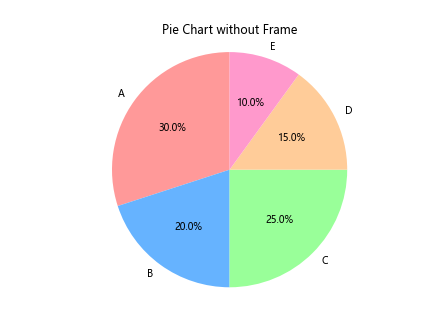
这个示例创建了一个饼图,并确保没有任何边框或轮廓。
18. 在条形图中移除边框
条形图是另一种常见的图表类型,移除边框可以让数据条更加突出。
import matplotlib.pyplot as plt
import numpy as np

# 创建数据
categories = ['A', 'B', 'C', 'D', 'E']
values = np.random.rand(5) * 100

fig, ax = plt.subplots()
bars = ax.bar(categories, values, color='skyblue')

# 移除边框
for spine in ax.spines.values():
    spine.set_visible(False)

# 添加数值标签
for bar in bars:
    height = bar.get_height()
    ax.text(bar.get_x() + bar.get_width()/2., height,
            f'{height:.1f}',
            ha='center', va='bottom')

ax.set_title('Bar Chart without Frame')
ax.set_xlabel('Categories')
ax.set_ylabel('Values')

plt.show()
Output:
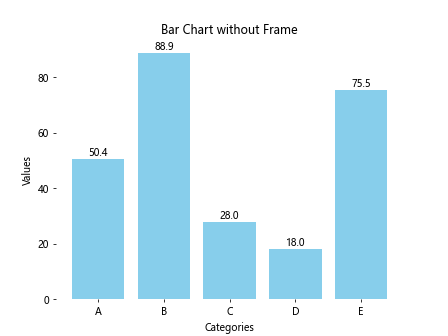
这个示例创建了一个条形图,移除了所有边框,并在每个条形上方添加了数值标签。
19. 在直方图中移除边框
直方图是用于显示数据分布的重要图表类型,移除边框可以让数据分布更加清晰。
import matplotlib.pyplot as plt
import numpy as np

# 创建数据
data = np.random.normal(0, 1, 1000)

fig, ax = plt.subplots()
n, bins, patches = ax.hist(data, bins=30, edgecolor='white')

# 移除边框
for spine in ax.spines.values():
    spine.set_visible(False)

ax.set_title('Histogram without Frame')
ax.set_xlabel('Values')
ax.set_ylabel('Frequency')

plt.show()
Output:
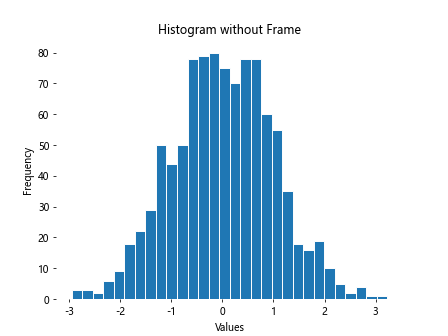
这个示例创建了一个直方图,移除了所有边框,使数据分布更加突出。
20. 在等高线图中移除边框
等高线图用于显示三维数据在二维平面上的投影,移除边框可以让等高线更加清晰。
import matplotlib.pyplot as plt
import numpy as np

# 创建数据
x = np.linspace(-3, 3, 100)
y = np.linspace(-3, 3, 100)
X, Y = np.meshgrid(x, y)
Z = np.sin(X) * np.cos(Y)

fig, ax = plt.subplots()
cs = ax.contourf(X, Y, Z, cmap='viridis')

# 移除边框
for spine in ax.spines.values():
    spine.set_visible(False)

# 添加颜色条
cbar = plt.colorbar(cs)
cbar.outline.set_visible(False)

ax.set_title('Contour Plot without Frame')
ax.set_xlabel('X-axis')
ax.set_ylabel('Y-axis')

plt.show()
Output:
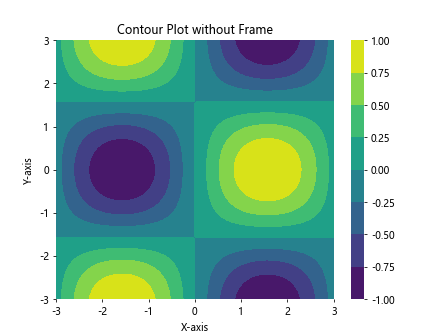
这个示例创建了一个等高线图,移除了所有边框,包括颜色条的边框,使等高线更加突出。
结论
移除Matplotlib图形的边框是一种简单而有效的方法,可以显著提升图表的视觉吸引力和专业性。通过本文介绍的各种技术,你可以根据不同的图表类型和需求,灵活地调整边框设置。无论是完全移除边框,还是选择性地保留某些边框元素,这些方法都能帮助你创建出更加清晰、美观的数据可视化作品。
记住,图表设计的关键是要突出你想要传达的信息。移除边框只是众多可以改善图表外观的技术之一。结合适当的颜色选择、字体设置、图例位置等其他元素,你可以创建出既美观又富有信息量的图表。
最后,建议在实际应用中多尝试不同的设置,找出最适合你的数据和受众的呈现方式。随着经验的积累,你将能够更加自如地运用这些技巧,创造出令人印象深刻的数据可视化作品。
 极客笔记
极客笔记