Matplotlib散点图注释:全面指南与实用技巧
参考:How to Annotate Matplotlib Scatter Plots
Matplotlib是Python中最流行的数据可视化库之一,它提供了强大的工具来创建各种类型的图表,包括散点图。在数据分析和科学研究中,散点图是一种常用的可视化方法,用于展示两个变量之间的关系。然而,仅仅绘制散点图有时还不够,我们经常需要在图上添加注释来突出重要的数据点或解释特定的模式。本文将深入探讨如何在Matplotlib散点图中添加各种类型的注释,以增强图表的信息量和可读性。
1. 基础散点图绘制
在开始添加注释之前,让我们先回顾一下如何使用Matplotlib绘制基本的散点图。以下是一个简单的示例:
import matplotlib.pyplot as plt
import numpy as np

# 生成示例数据
np.random.seed(42)
x = np.random.rand(50)
y = np.random.rand(50)

# 创建散点图
plt.figure(figsize=(10, 6))
plt.scatter(x, y)
plt.title('Basic Scatter Plot - how2matplotlib.com')
plt.xlabel('X-axis')
plt.ylabel('Y-axis')
plt.show()
Output:
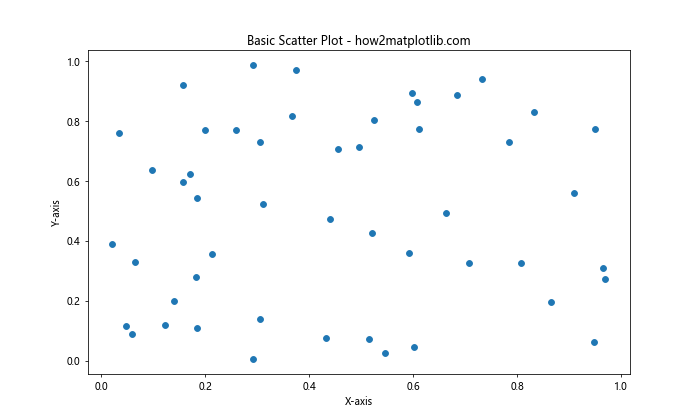
这段代码创建了一个基本的散点图,其中包含50个随机生成的数据点。plt.scatter()函数是创建散点图的核心,而plt.figure()、plt.title()、plt.xlabel()和plt.ylabel()则用于设置图表的大小和标签。
2. 文本注释
文本注释是最简单和最常用的注释类型之一。我们可以使用plt.annotate()函数在图表上添加文本注释。以下是一个示例:
import matplotlib.pyplot as plt
import numpy as np

np.random.seed(42)
x = np.random.rand(50)
y = np.random.rand(50)

plt.figure(figsize=(10, 6))
plt.scatter(x, y)

# 添加文本注释
plt.annotate('Interesting Point - how2matplotlib.com', xy=(0.5, 0.5), xytext=(0.7, 0.7),
             arrowprops=dict(facecolor='black', shrink=0.05))

plt.title('Scatter Plot with Text Annotation - how2matplotlib.com')
plt.xlabel('X-axis')
plt.ylabel('Y-axis')
plt.show()
Output:
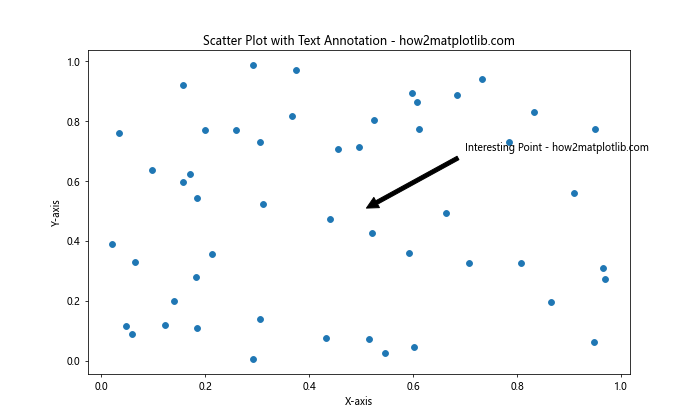
在这个例子中,我们使用plt.annotate()函数添加了一个指向(0.5, 0.5)点的文本注释。xy参数指定了箭头的目标位置,xytext参数指定了文本的位置,arrowprops参数用于自定义箭头的外观。
3. 箭头注释
箭头注释是另一种常用的注释类型,它可以更直观地指向特定的数据点。以下是如何添加箭头注释的示例:
import matplotlib.pyplot as plt
import numpy as np

np.random.seed(42)
x = np.random.rand(50)
y = np.random.rand(50)

plt.figure(figsize=(10, 6))
plt.scatter(x, y)

# 添加箭头注释
plt.annotate('', xy=(0.2, 0.2), xytext=(0.4, 0.4),
             arrowprops=dict(facecolor='red', shrink=0.05))

plt.title('Scatter Plot with Arrow Annotation - how2matplotlib.com')
plt.xlabel('X-axis')
plt.ylabel('Y-axis')
plt.show()
Output:
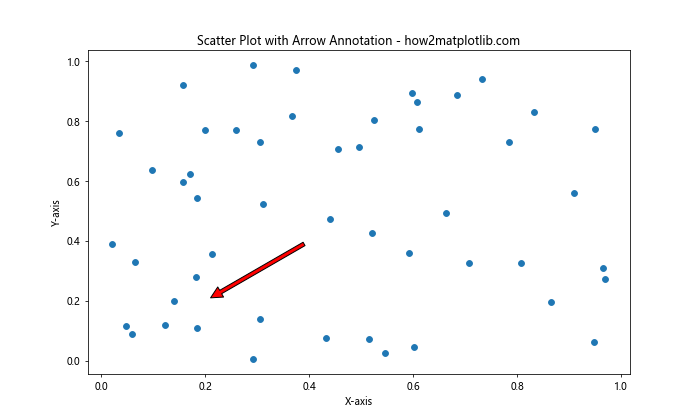
在这个例子中,我们省略了注释文本(第一个参数为空字符串),只添加了一个从(0.4, 0.4)指向(0.2, 0.2)的红色箭头。
4. 多点注释
有时我们需要同时注释多个点。以下是一个示例,展示了如何为多个点添加注释:
import matplotlib.pyplot as plt
import numpy as np

np.random.seed(42)
x = np.random.rand(50)
y = np.random.rand(50)

plt.figure(figsize=(10, 6))
plt.scatter(x, y)

# 添加多点注释
points = [(0.2, 0.2), (0.5, 0.5), (0.8, 0.8)]
labels = ['Point A', 'Point B', 'Point C']

for point, label in zip(points, labels):
    plt.annotate(f'{label} - how2matplotlib.com', xy=point, xytext=(5, 5),
                 textcoords='offset points')

plt.title('Scatter Plot with Multiple Annotations - how2matplotlib.com')
plt.xlabel('X-axis')
plt.ylabel('Y-axis')
plt.show()
Output:
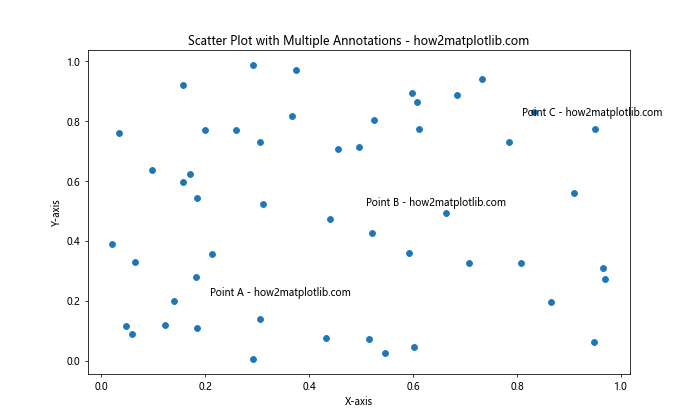
这个例子展示了如何使用循环为多个点添加注释。我们定义了一个点列表和对应的标签列表,然后使用zip()函数将它们配对,并为每个点添加注释。
5. 自定义注释样式
Matplotlib提供了丰富的选项来自定义注释的样式。以下是一个展示各种样式选项的示例:
import matplotlib.pyplot as plt
import numpy as np

np.random.seed(42)
x = np.random.rand(50)
y = np.random.rand(50)

plt.figure(figsize=(10, 6))
plt.scatter(x, y)

# 添加自定义样式的注释
plt.annotate('Custom Style - how2matplotlib.com', xy=(0.5, 0.5), xytext=(0.7, 0.7),
             arrowprops=dict(facecolor='green', shrink=0.05, width=2, headwidth=10),
             bbox=dict(boxstyle="round,pad=0.3", fc="yellow", ec="b", lw=2),
             fontsize=12, color='red')

plt.title('Scatter Plot with Custom Annotation Style - how2matplotlib.com')
plt.xlabel('X-axis')
plt.ylabel('Y-axis')
plt.show()
Output:
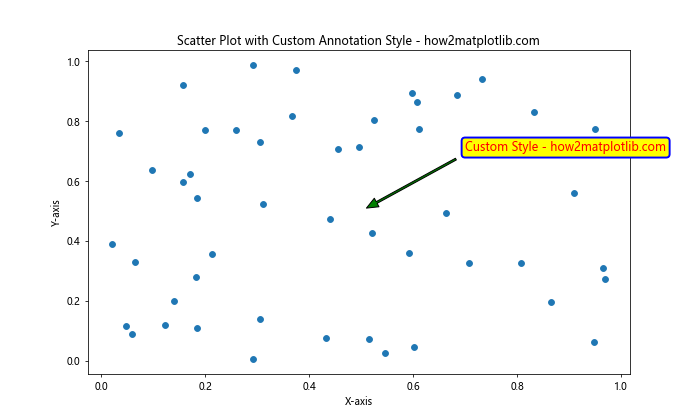
在这个例子中,我们自定义了箭头的颜色、宽度和头部大小,添加了一个带有圆角和边框的文本框,并设置了字体大小和颜色。
6. 使用LaTeX公式
Matplotlib支持在注释中使用LaTeX公式,这在科学和数学可视化中非常有用。以下是一个使用LaTeX公式的示例:
import matplotlib.pyplot as plt
import numpy as np

np.random.seed(42)
x = np.random.rand(50)
y = np.random.rand(50)

plt.figure(figsize=(10, 6))
plt.scatter(x, y)

# 添加包含LaTeX公式的注释
plt.annotate(r'\frac{x^2}{2} + \frac{y^2}{2} = 1 - how2matplotlib.com',
             xy=(0.5, 0.5), xytext=(0.7, 0.7),
             arrowprops=dict(facecolor='black', shrink=0.05))

plt.title('Scatter Plot with LaTeX Annotation - how2matplotlib.com')
plt.xlabel('X-axis')
plt.ylabel('Y-axis')
plt.show()
Output:
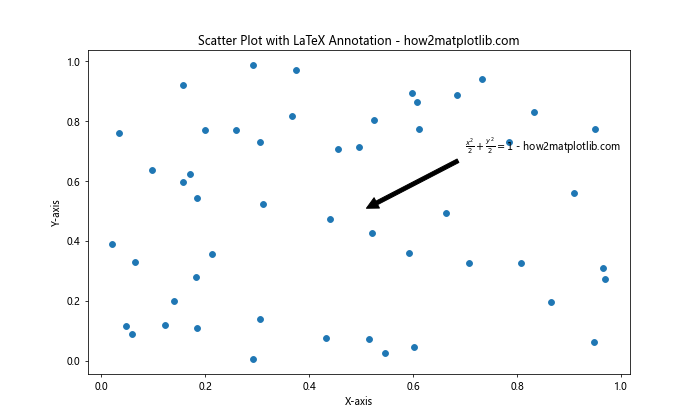
在这个例子中,我们使用了LaTeX公式来表示一个椭圆方程。注意使用原始字符串(r”)来避免反斜杠被解释为转义字符。
7. 动态注释
有时我们需要根据数据动态生成注释。以下是一个根据数据值动态添加注释的示例:
import matplotlib.pyplot as plt
import numpy as np

np.random.seed(42)
x = np.random.rand(50)
y = np.random.rand(50)

plt.figure(figsize=(10, 6))
scatter = plt.scatter(x, y)

# 动态添加注释
threshold = 0.8
for i, (xi, yi) in enumerate(zip(x, y)):
    if xi > threshold and yi > threshold:
        plt.annotate(f'Point {i} - how2matplotlib.com', xy=(xi, yi), xytext=(5, 5),
                     textcoords='offset points')

plt.title('Scatter Plot with Dynamic Annotations - how2matplotlib.com')
plt.xlabel('X-axis')
plt.ylabel('Y-axis')
plt.show()
Output:
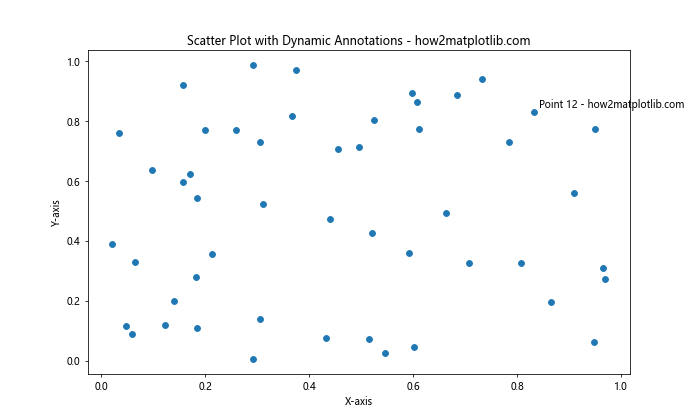
这个例子展示了如何根据数据点的值动态添加注释。我们遍历所有数据点,只为x和y值都大于0.8的点添加注释。
8. 注释图例
除了直接在图表上添加注释,我们还可以使用图例来解释散点图中的不同类别。以下是一个使用图例的示例:
import matplotlib.pyplot as plt
import numpy as np

np.random.seed(42)
x1 = np.random.rand(30)
y1 = np.random.rand(30)
x2 = np.random.rand(20)
y2 = np.random.rand(20)

plt.figure(figsize=(10, 6))
plt.scatter(x1, y1, c='blue', label='Group A')
plt.scatter(x2, y2, c='red', label='Group B')

plt.legend(title='Data Groups - how2matplotlib.com')
plt.title('Scatter Plot with Legend - how2matplotlib.com')
plt.xlabel('X-axis')
plt.ylabel('Y-axis')
plt.show()
Output:
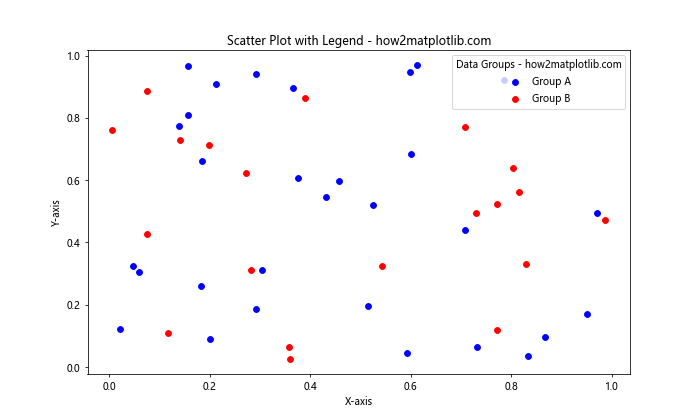
在这个例子中,我们创建了两组散点,并使用不同的颜色和标签来区分它们。plt.legend()函数用于显示图例,我们还为图例添加了一个标题。
9. 注释框
有时我们需要在图表的特定区域添加一个文本框来提供更详细的信息。以下是如何添加注释框的示例:
import matplotlib.pyplot as plt
import numpy as np

np.random.seed(42)
x = np.random.rand(50)
y = np.random.rand(50)

plt.figure(figsize=(10, 6))
plt.scatter(x, y)

# 添加注释框
textstr = 'This is a\ntext box\n- how2matplotlib.com'
props = dict(boxstyle='round', facecolor='wheat', alpha=0.5)
plt.text(0.05, 0.95, textstr, transform=plt.gca().transAxes, fontsize=14,
         verticalalignment='top', bbox=props)

plt.title('Scatter Plot with Text Box - how2matplotlib.com')
plt.xlabel('X-axis')
plt.ylabel('Y-axis')
plt.show()
Output:
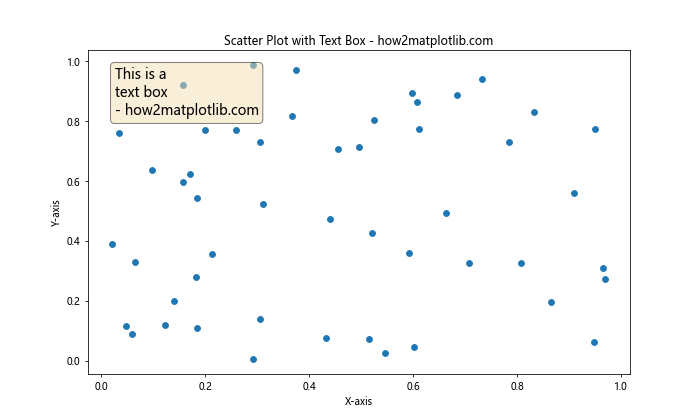
在这个例子中,我们使用plt.text()函数添加了一个文本框。transform=plt.gca().transAxes参数使得我们可以使用相对坐标(0到1)来定位文本框。bbox参数用于自定义文本框的样式。
10. 交互式注释
Matplotlib还支持交互式注释,这在探索大量数据点时特别有用。以下是一个使用mplcursors库实现交互式注释的示例:
import matplotlib.pyplot as plt
import numpy as np
import mplcursors

np.random.seed(42)
x = np.random.rand(100)
y = np.random.rand(100)

plt.figure(figsize=(10, 6))
scatter = plt.scatter(x, y)

plt.title('Interactive Scatter Plot - how2matplotlib.com')
plt.xlabel('X-axis')
plt.ylabel('Y-axis')

# 添加交互式注释
cursor = mplcursors.cursor(scatter, hover=True)
cursor.connect("add", lambda sel: sel.annotation.set_text(
    f'Point: ({sel.target[0]:.2f}, {sel.target[1]:.2f})\nhow2matplotlib.com'))

plt.show()
Output:
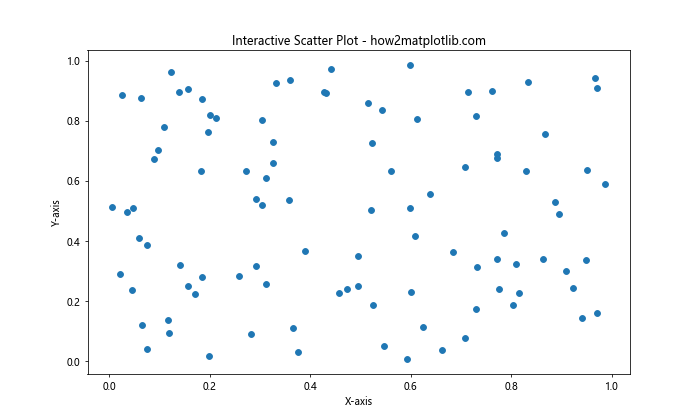
这个例子使用mplcursors库为散点图添加了交互式注释。当鼠标悬停在数据点上时,会显示该点的坐标。注意,你需要先安装mplcursors库(pip install mplcursors)才能运行这个示例。
11. 注释与子图
在复杂的可视化中,我们可能需要在一个图形中包含多个子图,并为每个子图添加注释。以下是一个在子图中添加注释的示例:
import matplotlib.pyplot as plt
import numpy as np

np.random.seed(42)
x1 = np.random.rand(50)
y1 = np.random.rand(50)
x2 = np.random.rand(50)
y2 = np.random.rand(50)

fig, (ax1, ax2) = plt.subplots(1, 2, figsize=(15, 6))

# 第一个子图
ax1.scatter(x1, y1)
ax1.set_title('Subplot 1 - how2matplotlib.com')
ax1.set_xlabel('X-axis')
ax1.set_ylabel('Y-axis')
ax1.annotate('Note 1', xy=(0.5, 0.5), xytext=(0.7, 0.7),
             arrowprops=dict(facecolor='black', shrink=0.05))

# 第二个子图
ax2.scatter(x2, y2)
ax2.set_title('Subplot 2 - how2matplotlib.com')
ax2.set_xlabel('X-axis')
ax2.set_ylabel('Y-axis')
ax2.annotate('Note 2', xy=(0.3, 0.3), xytext=(0.1, 0.1),
             arrowprops=dict(facecolor='red', shrink=0.05))

plt.tight_layout()
plt.show()
Output:
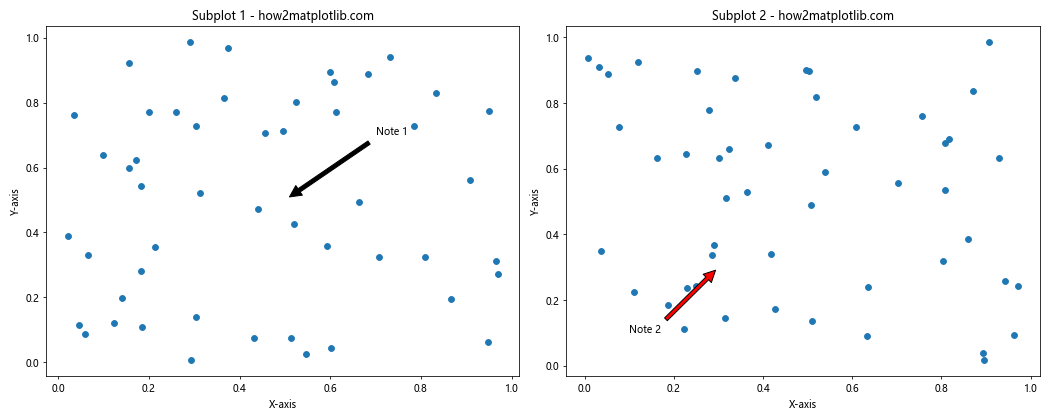
这个例子创建了两个并排的子图,每个子图都有自己的散点图和注释。我们使用plt.subplots()函数创建子图,并使用返回的Axes对象来添加散点图和注释。
12. 注释与颜色映射
在某些情况下,我们可能想要根据数据点的某个属性来为其着色,并在注释中反映这一信息。以下是一个使用颜色映射并在注释中包含颜色信息的示例:
import matplotlib.pyplot as plt
import numpy as np

np.random.seed(42)
x = np.random.rand(50)
y = np.random.rand(50)
colors = np.random.rand(50)

plt.figure(figsize=(10, 6))
scatter = plt.scatter(x, y, c=colors, cmap='viridis')
plt.colorbar(label='Color Value - how2matplotlib.com')

# 添加包含颜色信息的注释
for i in range(5):  # 只为前5个点添加注释
    plt.annotate(f'Point {i}: {colors[i]:.2f} - how2matplotlib.com',
                 xy=(x[i], y[i]), xytext=(5, 5),
                 textcoords='offset points')

plt.title('Scatter Plot with Color Mapping and Annotations - how2matplotlib.com')
plt.xlabel('X-axis')
plt.ylabel('Y-axis')
plt.show()
Output:
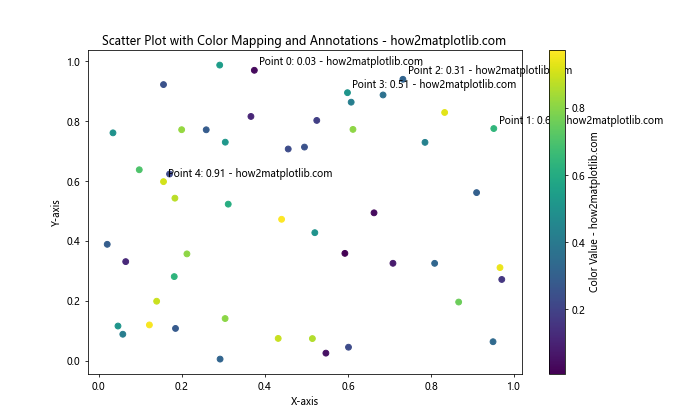
在这个例子中,我们使用了一个额外的数组colors来为每个点指定颜色值。plt.scatter()函数的c参数用于指定颜色,cmap参数指定了颜色映射。我们还添加了一个颜色条来显示颜色值的范围,并在注释中包含了每个点的颜色值。
13. 注释与时间序列数据
在处理时间序列数据时,我们可能需要在特定的时间点添加注释。以下是一个在时间序列散点图上添加注释的示例:
import matplotlib.pyplot as plt
import numpy as np
import pandas as pd

# 创建示例时间序列数据
dates = pd.date_range(start='2023-01-01', end='2023-12-31', freq='D')
values = np.cumsum(np.random.randn(len(dates)))

plt.figure(figsize=(12, 6))
plt.scatter(dates, values)

# 添加时间点注释
events = [
    ('2023-03-15', 'Event A - how2matplotlib.com'),
    ('2023-07-01', 'Event B - how2matplotlib.com'),
    ('2023-11-30', 'Event C - how2matplotlib.com')
]

for date, label in events:
    event_date = pd.to_datetime(date)
    event_value = values[dates == event_date][0]
    plt.annotate(label, xy=(event_date, event_value), xytext=(10, 10),
                 textcoords='offset points', arrowprops=dict(arrowstyle='->'))

plt.title('Time Series Scatter Plot with Annotations - how2matplotlib.com')
plt.xlabel('Date')
plt.ylabel('Value')
plt.gcf().autofmt_xdate()  # 自动格式化x轴日期标签
plt.show()
Output:
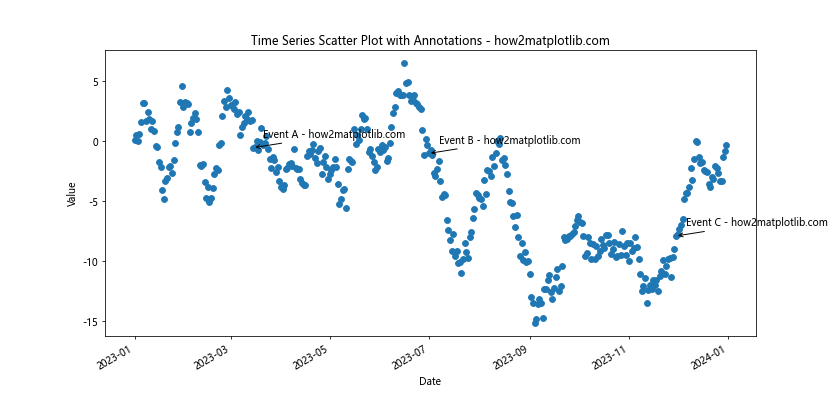
这个例子创建了一个时间序列散点图,并在特定的日期添加了注释。我们使用pandas库来处理日期数据,这使得处理时间序列变得更加容易。plt.gcf().autofmt_xdate()用于自动格式化x轴的日期标签,使其更易读。
14. 注释与数据分组
当我们的数据包含不同的类别或组时,我们可能想要为每个组添加不同的注释。以下是一个按数据组添加注释的示例:
import matplotlib.pyplot as plt
import numpy as np

np.random.seed(42)
group_a_x = np.random.rand(30)
group_a_y = np.random.rand(30)
group_b_x = np.random.rand(20) + 1
group_b_y = np.random.rand(20) + 1

plt.figure(figsize=(10, 6))
plt.scatter(group_a_x, group_a_y, c='blue', label='Group A')
plt.scatter(group_b_x, group_b_y, c='red', label='Group B')

# 为每个组添加注释
plt.annotate('Group A Center - how2matplotlib.com',
             xy=(np.mean(group_a_x), np.mean(group_a_y)),
             xytext=(0.2, 0.8), textcoords='axes fraction',
             arrowprops=dict(facecolor='blue', shrink=0.05))

plt.annotate('Group B Center - how2matplotlib.com',
             xy=(np.mean(group_b_x), np.mean(group_b_y)),
             xytext=(0.8, 0.2), textcoords='axes fraction',
             arrowprops=dict(facecolor='red', shrink=0.05))

plt.legend()
plt.title('Grouped Scatter Plot with Annotations - how2matplotlib.com')
plt.xlabel('X-axis')
plt.ylabel('Y-axis')
plt.show()
Output:
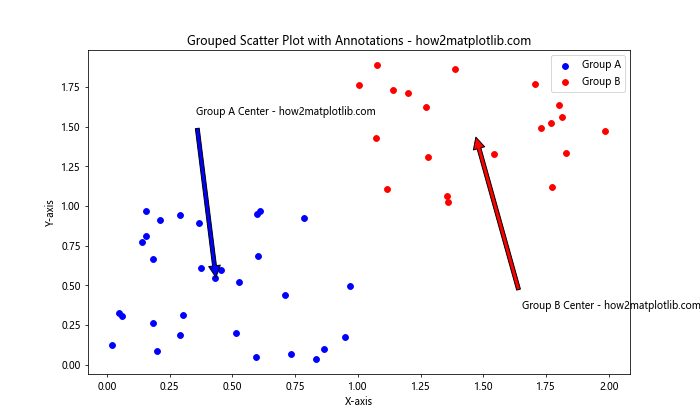
在这个例子中,我们创建了两组数据点,并为每组的中心添加了注释。我们使用np.mean()函数计算每组的平均位置作为注释的目标点。
15. 注释与统计信息
在数据分析中,我们经常需要在图表上显示一些统计信息。以下是一个在散点图上添加回归线和相关统计信息的示例:
import matplotlib.pyplot as plt
import numpy as np
from scipy import stats

np.random.seed(42)
x = np.random.rand(50)
y = 2 * x + 1 + np.random.normal(0, 0.1, 50)

plt.figure(figsize=(10, 6))
plt.scatter(x, y)

# 添加回归线
slope, intercept, r_value, p_value, std_err = stats.linregress(x, y)
line = slope * x + intercept
plt.plot(x, line, color='r', label='Regression Line')

# 添加统计信息
stats_text = f'Slope: {slope:.2f}\nIntercept: {intercept:.2f}\nR-squared: {r_value**2:.2f}'
plt.annotate(stats_text + '\n- how2matplotlib.com', xy=(0.05, 0.95), xycoords='axes fraction',
             verticalalignment='top', bbox=dict(boxstyle='round', facecolor='wheat', alpha=0.5))

plt.legend()
plt.title('Scatter Plot with Regression Line and Stats - how2matplotlib.com')
plt.xlabel('X-axis')
plt.ylabel('Y-axis')
plt.show()
Output:
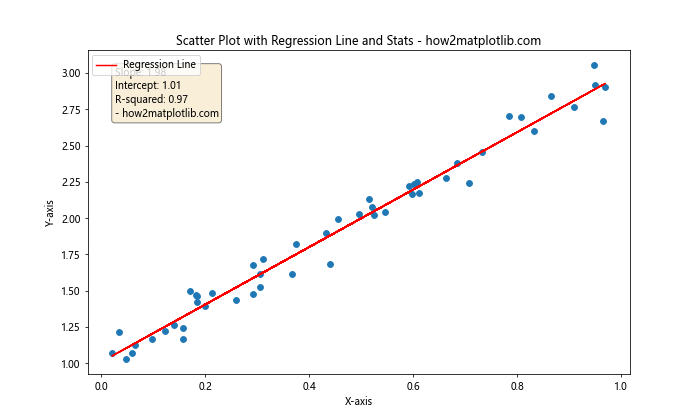
这个例子展示了如何在散点图上添加回归线,并在图表的左上角添加一个包含斜率、截距和R平方值的注释框。我们使用scipy.stats.linregress()函数来计算回归统计信息。
16. 注释与自定义标记
有时我们可能想要使用自定义的标记来突出显示某些特定的点。以下是一个使用自定义标记和注释的示例:
import matplotlib.pyplot as plt
import numpy as np

np.random.seed(42)
x = np.random.rand(50)
y = np.random.rand(50)

plt.figure(figsize=(10, 6))
plt.scatter(x, y, marker='o')

# 添加自定义标记和注释
special_points = [(0.2, 0.8), (0.7, 0.3), (0.9, 0.9)]
for i, (xi, yi) in enumerate(special_points):
    plt.plot(xi, yi, marker='*', markersize=20, color='red')
    plt.annotate(f'Special Point {i+1} - how2matplotlib.com', xy=(xi, yi), xytext=(5, 5),
                 textcoords='offset points', fontweight='bold')

plt.title('Scatter Plot with Custom Markers and Annotations - how2matplotlib.com')
plt.xlabel('X-axis')
plt.ylabel('Y-axis')
plt.show()
Output:
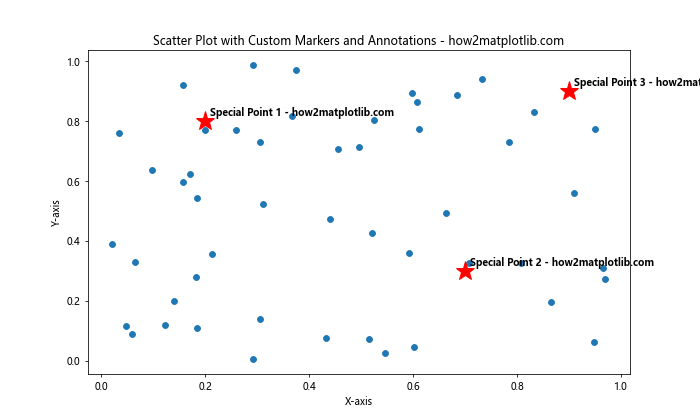
在这个例子中,我们使用星形标记(’*’)来突出显示三个特殊点,并为每个特殊点添加了粗体注释。
17. 注释与数据标签
有时,我们可能想要直接在数据点旁边显示其标签,而不是使用箭头指向它们。以下是一个为数据点添加标签的示例:
import matplotlib.pyplot as plt
import numpy as np

np.random.seed(42)
x = np.random.rand(10)
y = np.random.rand(10)
labels = [f'Point {i}' for i in range(10)]

plt.figure(figsize=(10, 6))
plt.scatter(x, y)

for i, (xi, yi, label) in enumerate(zip(x, y, labels)):
    plt.annotate(f'{label} - how2matplotlib.com', xy=(xi, yi), xytext=(5, 5),
                 textcoords='offset points', fontsize=8)

plt.title('Scatter Plot with Data Labels - how2matplotlib.com')
plt.xlabel('X-axis')
plt.ylabel('Y-axis')
plt.show()
Output:
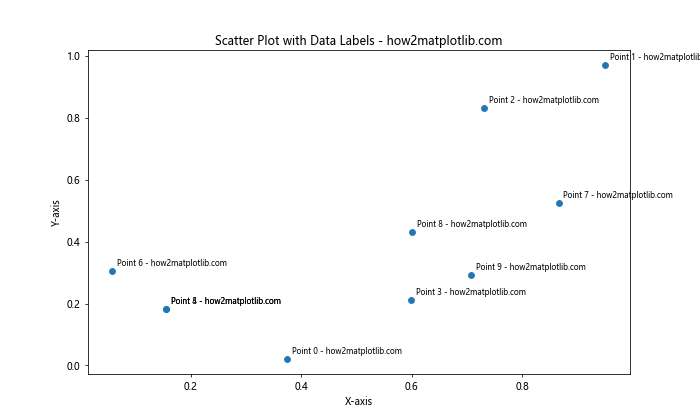
这个例子为每个数据点添加了一个小的文本标签。我们使用zip()函数来同时迭代x坐标、y坐标和标签。
18. 注释与坐标系变换
在某些情况下,我们可能需要在不同的坐标系中添加注释。Matplotlib提供了多种坐标系变换方法。以下是一个使用不同坐标系添加注释的示例:
import matplotlib.pyplot as plt
import numpy as np

np.random.seed(42)
x = np.random.rand(50)
y = np.random.rand(50)

fig, ax = plt.subplots(figsize=(10, 6))
ax.scatter(x, y)

# 使用数据坐标
ax.annotate('Data Coordinates - how2matplotlib.com', xy=(0.5, 0.5), xycoords='data',
            xytext=(0.7, 0.7), textcoords='data',
            arrowprops=dict(arrowstyle='->'))

# 使用轴分数坐标
ax.annotate('Axes Fraction - how2matplotlib.com', xy=(0.2, 0.8), xycoords='axes fraction',
            xytext=(0.4, 1), textcoords='axes fraction',
            arrowprops=dict(arrowstyle='->'))

# 使用图形坐标
ax.annotate('Figure Coordinates - how2matplotlib.com', xy=(0.1, 0.1), xycoords='figure fraction',
            xytext=(0.2, 0.2), textcoords='figure fraction',
            arrowprops=dict(arrowstyle='->'))

plt.title('Scatter Plot with Different Coordinate Systems - how2matplotlib.com')
plt.xlabel('X-axis')
plt.ylabel('Y-axis')
plt.show()
Output:
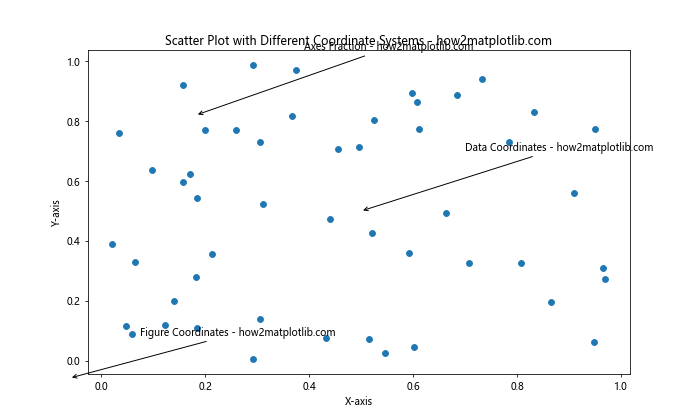
这个例子展示了如何使用不同的坐标系来添加注释。’data’坐标系使用实际的数据值,’axes fraction’使用轴的相对坐标(0到1),’figure fraction’使用整个图形的相对坐标。
19. 注释与极坐标系
除了常见的笛卡尔坐标系,Matplotlib还支持极坐标系。以下是一个在极坐标系散点图上添加注释的示例:
import matplotlib.pyplot as plt
import numpy as np

np.random.seed(42)
r = np.random.rand(50)
theta = 2 * np.pi * np.random.rand(50)

fig, ax = plt.subplots(figsize=(10, 10), subplot_kw=dict(projection='polar'))
ax.scatter(theta, r)

# 添加极坐标系注释
ax.annotate('Polar Annotation - how2matplotlib.com', xy=(np.pi/4, 0.5), xytext=(np.pi/2, 0.7),
            arrowprops=dict(arrowstyle='->'))

plt.title('Polar Scatter Plot with Annotation - how2matplotlib.com')
plt.show()
Output:
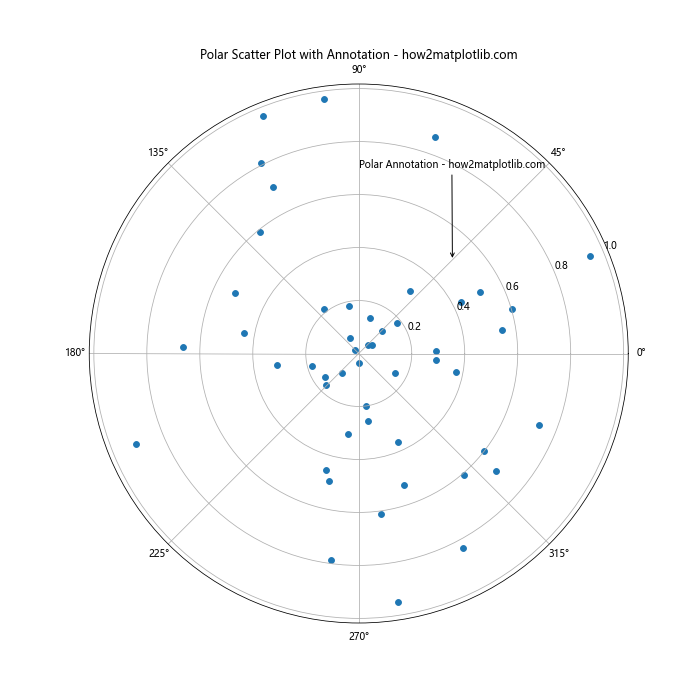
这个例子创建了一个极坐标系的散点图,并添加了一个注释。在极坐标系中,xy参数的第一个值表示角度(以弧度为单位),第二个值表示半径。
20. 注释与动画
最后,让我们看一个将注释与动画结合的高级示例。这个例子将创建一个动态的散点图,其中的注释会随时间变化:
import matplotlib.pyplot as plt
import matplotlib.animation as animation
import numpy as np

np.random.seed(42)
x = np.random.rand(20)
y = np.random.rand(20)

fig, ax = plt.subplots(figsize=(10, 6))
scatter = ax.scatter(x, y)
annotation = ax.annotate('', xy=(0, 0), xytext=(0.8, 0.8))

def update(frame):
    # 更新散点图
    new_x = x + 0.1 * np.random.randn(20)
    new_y = y + 0.1 * np.random.randn(20)
    scatter.set_offsets(np.c_[new_x, new_y])

    # 更新注释
    max_point = (new_x[np.argmax(new_y)], np.max(new_y))
    annotation.set_text(f'Max Y: {max_point[1]:.2f}\nFrame: {frame}\n- how2matplotlib.com')
    annotation.xy = max_point

    return scatter, annotation

ani = animation.FuncAnimation(fig, update, frames=100, interval=100, blit=True)

plt.title('Animated Scatter Plot with Dynamic Annotation - how2matplotlib.com')
plt.xlabel('X-axis')
plt.ylabel('Y-axis')
plt.show()
Output:
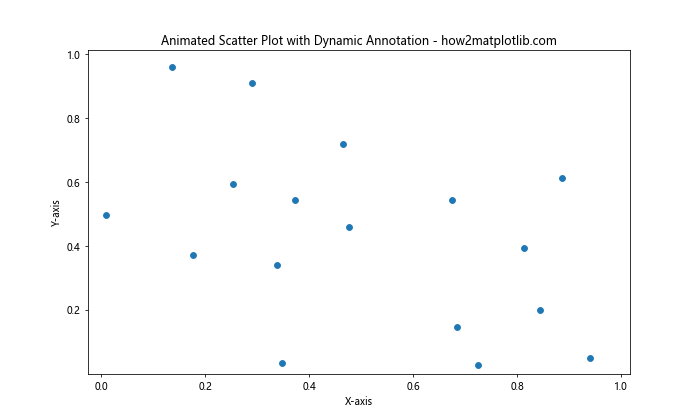
这个例子创建了一个动画散点图,其中的点位置会随机变化,注释会实时更新以显示Y值最大的点的位置和当前帧数。animation.FuncAnimation()函数用于创建动画,update()函数定义了每一帧的更新逻辑。
总结:
本文深入探讨了如何在Matplotlib散点图中添加各种类型的注释。我们从基础的文本注释开始,逐步深入到更复杂的注释技术,包括箭头注释、多点注释、自定义样式、LaTeX公式、动态注释、图例、注释框、交互式注释等。我们还探讨了如何在子图中添加注释,如何结合颜色映射使用注释,以及如何在时间序列数据和分组数据中应用注释。
此外,我们还介绍了如何在注释中包含统计信息,如何使用自定义标记和数据标签,以及如何在不同的坐标系中添加注释。最后,我们还展示了如何在极坐标系中添加注释,以及如何创建带有动态注释的动画散点图。
通过这些多样化的示例,我们可以看到Matplotlib提供了丰富而灵活的工具来增强散点图的信息量和可读性。合理使用这些注释技术可以大大提高数据可视化的效果,使图表更加清晰、信息更加丰富,从而更好地传达数据背后的故事和洞察。
在实际应用中,选择合适的注释方式取决于你的具体需求和数据特征。有时,简单的文本注释就足够了;而在其他情况下,你可能需要结合多种注释技术来充分展示数据的复杂性。无论如何,掌握这些注释技巧将使你能够创建更加专业和富有洞察力的数据可视化。
最后,值得注意的是,虽然注释可以大大增强图表的信息量,但过度使用注释可能会导致图表变得杂乱和难以理解。因此,在添加注释时,始终要考虑到整体的视觉平衡和清晰度。选择最关键、最有价值的信息进行注释,确保注释不会遮挡重要的数据点,并保持整体设计的简洁和专业。
通过不断实践和实验,你将能够找到最适合你的数据和受众的注释方式,创造出既美观又富有信息量的散点图可视化。记住,优秀的数据可视化不仅仅是展示数据,更是讲述数据背后的故事,而恰当的注释正是连接数据和故事的关键桥梁。
希望本文的详细介绍和丰富示例能够帮助你掌握Matplotlib散点图注释的各种技巧,为你的数据可视化工作带来新的灵感和可能性。无论你是数据科学家、研究人员还是数据分析师,这些技能都将帮助你更有效地传达数据洞察,做出更有说服力的数据展示。
继续探索和实践这些技巧,你会发现Matplotlib还有更多令人兴奋的功能等待你去发掘。数据可视化是一门既需要技术skills又需要创造力的艺术,通过不断学习和创新,你将能够创造出更加引人注目和富有洞察力的数据可视化作品。
最后,记住要经常查阅Matplotlib的官方文档和社区资源,因为这个库在不断更新和改进,可能会引入新的功能或更好的实现方式。同时,也要关注数据可视化领域的最新趋势和最佳实践,不断提升你的数据故事讲述能力。祝你在数据可视化的旅程中取得成功,创造出令人印象深刻的散点图注释!
 极客笔记
极客笔记