Matplotlib中的事件处理:如何实现交互式可视化
参考:Event Handling in Matplotlib
Matplotlib是Python中最流行的数据可视化库之一,它不仅能够创建静态图表,还支持交互式可视化。在本文中,我们将深入探讨Matplotlib中的事件处理机制,这是实现交互式可视化的关键。通过事件处理,我们可以让用户与图表进行交互,从而创建更加动态和有吸引力的数据可视化效果。
1. 事件处理的基础
在Matplotlib中,事件处理是通过连接事件和回调函数来实现的。当特定事件发生时,相应的回调函数就会被触发。这些事件可以是鼠标点击、键盘按键、图表更新等。
让我们从一个简单的例子开始,展示如何在Matplotlib中处理鼠标点击事件:
import matplotlib.pyplot as plt

fig, ax = plt.subplots()
ax.set_title('Click anywhere on the plot (how2matplotlib.com)')

def on_click(event):
    if event.inaxes:
        print(f'Clicked at position: x={event.xdata:.2f}, y={event.ydata:.2f}')

fig.canvas.mpl_connect('button_press_event', on_click)

plt.show()
Output:
在这个例子中,我们创建了一个空白的图表,并定义了一个on_click函数来处理鼠标点击事件。通过fig.canvas.mpl_connect方法,我们将’button_press_event’事件与on_click函数关联起来。当用户在图表上点击时,on_click函数会被调用,打印出点击位置的坐标。
2. 常见的事件类型
Matplotlib支持多种事件类型,以下是一些常见的事件:
- 鼠标事件:’button_press_event’, ‘button_release_event’, ‘motion_notify_event’
- 键盘事件:’key_press_event’, ‘key_release_event’
- 图表事件:’figure_enter_event’, ‘figure_leave_event’, ‘axes_enter_event’, ‘axes_leave_event’
- 绘图事件:’draw_event’, ‘resize_event’
让我们通过一个例子来演示如何处理键盘事件:
import matplotlib.pyplot as plt

fig, ax = plt.subplots()
ax.set_title('Press any key (how2matplotlib.com)')

def on_key(event):
    if event.key == 'q':
        plt.close()
    else:
        print(f'You pressed: {event.key}')

fig.canvas.mpl_connect('key_press_event', on_key)

plt.show()
Output:
在这个例子中,我们创建了一个on_key函数来处理键盘按键事件。当用户按下’q’键时,图表会关闭;按下其他键时,会打印出按下的键。
3. 事件对象的属性
当事件发生时,Matplotlib会创建一个事件对象,并将其传递给回调函数。这个事件对象包含了许多有用的属性,可以帮助我们获取事件的详细信息。
以下是一些常用的事件对象属性:
event.x,event.y: 事件发生的像素坐标event.xdata,event.ydata: 事件发生的数据坐标event.inaxes: 事件发生的Axes对象(如果事件发生在Axes内)event.button: 鼠标按钮(对于鼠标事件)event.key: 按下的键(对于键盘事件)
让我们通过一个例子来展示如何使用这些属性:
import matplotlib.pyplot as plt

fig, ax = plt.subplots()
ax.set_title('Move mouse over the plot (how2matplotlib.com)')

def on_move(event):
    if event.inaxes:
        ax.set_title(f'Mouse position: x={event.xdata:.2f}, y={event.ydata:.2f}')
        fig.canvas.draw_idle()

fig.canvas.mpl_connect('motion_notify_event', on_move)

plt.show()
Output:
在这个例子中,我们创建了一个on_move函数来处理鼠标移动事件。当鼠标在图表上移动时,我们使用event.xdata和event.ydata来获取鼠标的数据坐标,并更新图表的标题。
4. 自定义交互式工具
Matplotlib提供了一些内置的交互式工具,如缩放和平移。但有时我们可能需要创建自定义的交互式工具。通过事件处理,我们可以轻松实现这一点。
让我们创建一个简单的绘图工具,允许用户通过点击来添加点:
import matplotlib.pyplot as plt

fig, ax = plt.subplots()
ax.set_title('Click to add points (how2matplotlib.com)')
ax.set_xlim(0, 10)
ax.set_ylim(0, 10)

points, = ax.plot([], [], 'ro')
x_data, y_data = [], []

def on_click(event):
    if event.inaxes == ax:
        x_data.append(event.xdata)
        y_data.append(event.ydata)
        points.set_data(x_data, y_data)
        fig.canvas.draw()

fig.canvas.mpl_connect('button_press_event', on_click)

plt.show()
Output:
在这个例子中,我们创建了一个空的散点图,并定义了一个on_click函数来处理鼠标点击事件。每次用户点击图表时,我们都会将点的坐标添加到数据列表中,并更新散点图。
5. 动态更新图表
事件处理还可以用于创建动态更新的图表。这在实时数据可视化中特别有用。让我们创建一个简单的实时更新的折线图:
import matplotlib.pyplot as plt
import numpy as np
from matplotlib.animation import FuncAnimation

fig, ax = plt.subplots()
ax.set_xlim(0, 100)
ax.set_ylim(-1, 1)
line, = ax.plot([], [])

x_data, y_data = [], []

def update(frame):
    x_data.append(frame)
    y_data.append(np.sin(frame * 0.1))
    line.set_data(x_data, y_data)
    ax.set_title(f'Frame: {frame} (how2matplotlib.com)')
    return line,

ani = FuncAnimation(fig, update, frames=range(100), interval=50, blit=True)

plt.show()
Output:
在这个例子中,我们使用FuncAnimation来创建一个动画。update函数在每一帧被调用,用于更新数据和图表。这种方法可以用于实时数据流的可视化。
6. 事件处理与小部件结合
Matplotlib还支持添加交互式小部件,如滑块、按钮等。我们可以将事件处理与这些小部件结合,创建更复杂的交互式可视化。
让我们创建一个带有滑块的图表,用户可以通过滑块来调整正弦波的频率:
import matplotlib.pyplot as plt
import numpy as np
from matplotlib.widgets import Slider

fig, ax = plt.subplots()
plt.subplots_adjust(bottom=0.25)

t = np.linspace(0, 2*np.pi, 1000)
freq = 1
s = np.sin(2 * np.pi * freq * t)
l, = plt.plot(t, s, lw=2)

ax_freq = plt.axes([0.25, 0.1, 0.65, 0.03])
slider = Slider(ax_freq, 'Frequency', 0.1, 10.0, valinit=freq)

def update(val):
    freq = slider.val
    l.set_ydata(np.sin(2 * np.pi * freq * t))
    ax.set_title(f'Frequency: {freq:.2f} (how2matplotlib.com)')
    fig.canvas.draw_idle()

slider.on_changed(update)

plt.show()
Output:
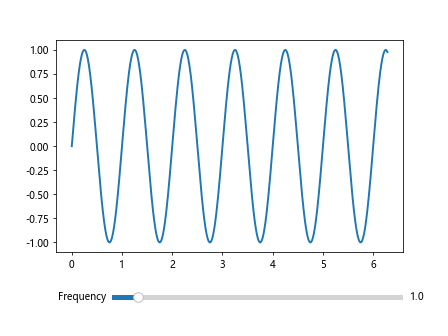
在这个例子中,我们创建了一个正弦波图表和一个频率滑块。当用户移动滑块时,update函数会被调用,更新正弦波的频率和图表标题。
7. 多图表交互
有时我们可能需要在多个图表之间进行交互。Matplotlib允许我们在多个图表之间共享事件,从而实现复杂的交互式可视化。
让我们创建两个相关的图表,当用户在一个图表上点击时,另一个图表会显示相应的数据:
import matplotlib.pyplot as plt
import numpy as np

fig, (ax1, ax2) = plt.subplots(1, 2, figsize=(10, 5))

x = np.linspace(0, 10, 100)
y1 = np.sin(x)
y2 = np.cos(x)

ax1.plot(x, y1)
ax1.set_title('Sin (how2matplotlib.com)')
ax2.set_title('Cos (how2matplotlib.com)')

line, = ax2.plot([], [])

def on_click(event):
    if event.inaxes == ax1:
        index = np.argmin(np.abs(x - event.xdata))
        line.set_data(x[index:], y2[index:])
        ax2.relim()
        ax2.autoscale_view()
        fig.canvas.draw_idle()

fig.canvas.mpl_connect('button_press_event', on_click)

plt.show()
Output:
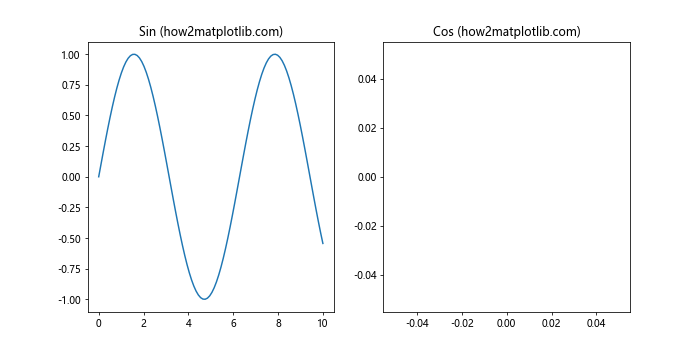
在这个例子中,我们创建了两个子图:一个显示正弦函数,另一个显示余弦函数。当用户在正弦图上点击时,余弦图会更新以显示从点击位置开始的余弦函数部分。
8. 自定义光标
Matplotlib允许我们自定义光标,这可以用来为用户提供额外的视觉反馈。让我们创建一个例子,当鼠标移动到图表上时,显示一个十字光标:
import matplotlib.pyplot as plt
import numpy as np

fig, ax = plt.subplots()
ax.set_title('Move mouse over the plot (how2matplotlib.com)')

x = np.linspace(0, 10, 100)
y = np.sin(x)
ax.plot(x, y)

horizontal_line = ax.axhline(y=0, color='r', lw=0.8, ls='--')
vertical_line = ax.axvline(x=0, color='r', lw=0.8, ls='--')

def on_move(event):
    if event.inaxes:
        horizontal_line.set_ydata(event.ydata)
        vertical_line.set_xdata(event.xdata)
        fig.canvas.draw_idle()

fig.canvas.mpl_connect('motion_notify_event', on_move)

plt.show()
Output:
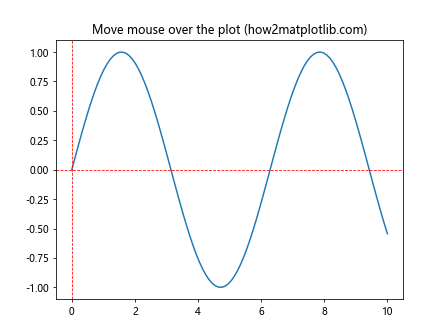
在这个例子中,我们创建了一个正弦函数图表,并添加了两条虚线来表示十字光标。当鼠标在图表上移动时,这些线会跟随鼠标位置更新。
9. 事件处理与动画结合
我们可以将事件处理与动画结合,创建更加复杂和有趣的交互式可视化。让我们创建一个例子,用户可以通过点击来添加弹跳的球:
import matplotlib.pyplot as plt
import numpy as np
from matplotlib.animation import FuncAnimation

fig, ax = plt.subplots()
ax.set_xlim(0, 10)
ax.set_ylim(0, 10)
ax.set_title('Click to add bouncing balls (how2matplotlib.com)')

balls = []

class Ball:
    def __init__(self, x, y):
        self.x = x
        self.y = y
        self.vx = np.random.rand() * 0.2 - 0.1
        self.vy = np.random.rand() * 0.2 - 0.1
        self.line, = ax.plot(x, y, 'ro')

    def update(self):
        self.x += self.vx
        self.y += self.vy
        if self.x < 0 or self.x > 10:
            self.vx *= -1
        if self.y < 0 or self.y > 10:
            self.vy *= -1
        self.line.set_data(self.x, self.y)

def on_click(event):
    if event.inaxes == ax:
        balls.append(Ball(event.xdata, event.ydata))

fig.canvas.mpl_connect('button_press_event', on_click)

def update(frame):
    for ball in balls:
        ball.update()
    return [ball.line for ball in balls]

ani = FuncAnimation(fig, update, interval=50, blit=True)

plt.show()
Output:
在这个例子中,我们创建了一个Ball类来表示弹跳的球。当用户点击图表时,会在点击位置添加一个新的球。动画函数update会更新所有球的位置,创建弹跳效果。
10. 事件处理与数据分析结合
事件处理不仅可以用于创建交互式可视化,还可以与数据分析结合,帮助用户更好地理解数据。让我们创建一个散点图,用户可以通过拖动鼠标来选择数据点,并实时显示选中点的统计信息:
import matplotlib.pyplot as plt
import numpy as np
from matplotlib.widgets import RectangleSelector

fig, (ax1, ax2) = plt.subplots(1, 2, figsize=(12, 5))

np.random.seed(42)
x = np.random.rand(100)
y = np.random.rand(100)

ax1.scatter(x, y)
ax1.set_title('Scatter plot (how2matplotlib.com)')
ax2.set_title('Statistics (how2matplotlib.com)')
ax2.axis('off')

stats_text = ax2.text(0.1, 0.9, '', transform=ax2.transAxes, va='top')

def onselect(eclick, erelease):
    x1, y1 = eclick.xdata, eclick.ydata
    x2, y2 = erelease.xdata, erelease.ydata

    xmin, xmax = min(x1, x2), max(x1, x2)
    ymin, ymax = min(y1, y2), max(y1, y2)

    selected = (x >= xmin) & (x <= xmax) & (y >= ymin) & (y <= ymax)
    selected_x = x[selected]
    selected_y = y[selected]

    stats = f"Selected points: {sum(selected)}\n"
    stats += f"Mean X: {np.mean(selected_x):.2f}\n"
    stats += f"Mean Y: {np.mean(selected_y):.2f}\n"
    stats += f"Std X: {np.std(selected_x):.2f}\n"
    stats += f"Std Y: {np.std(selected_y):.2f}\n"
    stats += f"Correlation: {np.corrcoef(selected_x, selected_y)[0, 1]:.2f}"

    stats_text.set_text(stats)
    fig.canvas.draw_idle()

rect_selector = RectangleSelector(ax1, onselect, useblit=True, button=[1],
                                  minspanx=5, minspany=5, spancoords='pixels',
                                  interactive=True)

plt.show()
Output:
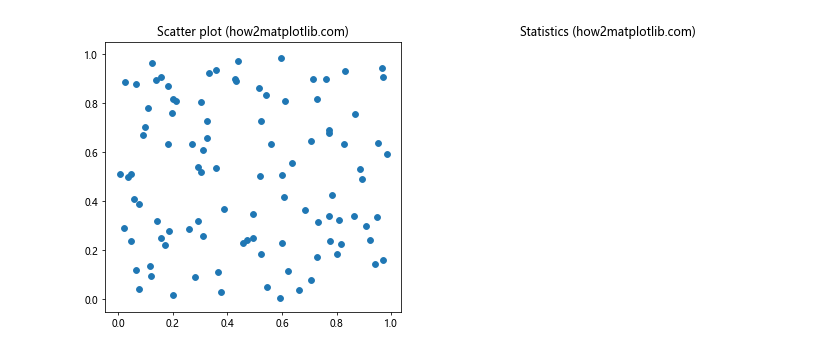
在这个例子中,我们创建了一个散点图和一个用于显示统计信息的文本区域。用户可以通过在散点图上拖动鼠标来选择数据点。每次选择后,onselect函数会计算选中点的统计信息并更新文本区域。
11. 事件处理与图表注释
事件处理还可以用于添加交互式注释。让我们创建一个例子,用户可以通过点击来添加文本注释:
import matplotlib.pyplot as plt
import numpy as np

fig, ax = plt.subplots()
ax.set_title('Click to add annotations (how2matplotlib.com)')

x = np.linspace(0, 10, 100)
y = np.sin(x)
ax.plot(x, y)

annotations = []

def on_click(event):
    if event.inaxes == ax:
        annotation = ax.annotate(f'({event.xdata:.2f}, {event.ydata:.2f})',
                                 (event.xdata, event.ydata),
                                 xytext=(10, 10),
                                 textcoords='offset points',
                                 bbox=dict(boxstyle='round,pad=0.5', fc='yellow', alpha=0.5),
                                 arrowprops=dict(arrowstyle='->'))
        annotations.append(annotation)
        fig.canvas.draw_idle()

def on_key(event):
    if event.key == 'c':
        for ann in annotations:
            ann.remove()
        annotations.clear()
        fig.canvas.draw_idle()

fig.canvas.mpl_connect('button_press_event', on_click)
fig.canvas.mpl_connect('key_press_event', on_key)

plt.show()
Output:
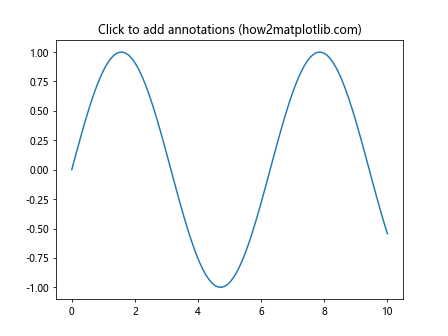
在这个例子中,用户可以通过点击图表来添加带有坐标信息的文本注释。每次点击都会创建一个新的注释并添加到图表中。此外,用户可以通过按’c’键来清除所有注释。
12. 事件处理与图表样式动态调整
我们可以使用事件处理来动态调整图表的样式。让我们创建一个例子,用户可以通过键盘快捷键来切换图表的颜色主题:
import matplotlib.pyplot as plt
import numpy as np

fig, ax = plt.subplots()
ax.set_title('Press "d" for dark theme, "l" for light theme (how2matplotlib.com)')

x = np.linspace(0, 10, 100)
y = np.sin(x)
line, = ax.plot(x, y)

def on_key(event):
    if event.key == 'd':
        plt.style.use('dark_background')
        line.set_color('w')
    elif event.key == 'l':
        plt.style.use('default')
        line.set_color('b')

    ax.set_facecolor(plt.rcParams['axes.facecolor'])
    fig.set_facecolor(plt.rcParams['figure.facecolor'])
    fig.canvas.draw_idle()

fig.canvas.mpl_connect('key_press_event', on_key)

plt.show()
Output:
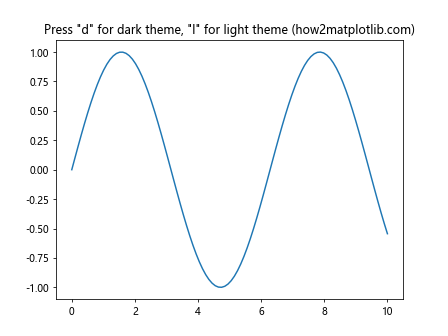
在这个例子中,用户可以通过按’d’键切换到深色主题,按’l’键切换到浅色主题。每次切换主题时,我们都会更新图表的背景色和线条颜色。
13. 事件处理与数据筛选
事件处理可以用于创建交互式数据筛选工具。让我们创建一个例子,用户可以通过拖动滑块来筛选数据:
import matplotlib.pyplot as plt
import numpy as np
from matplotlib.widgets import RangeSlider

fig, (ax1, ax2) = plt.subplots(2, 1, figsize=(8, 8))
plt.subplots_adjust(left=0.1, bottom=0.2)

np.random.seed(42)
x = np.random.rand(1000)
y = np.random.rand(1000)

scatter = ax1.scatter(x, y)
ax1.set_title('Original Data (how2matplotlib.com)')
ax2.set_title('Filtered Data (how2matplotlib.com)')

slider_ax = plt.axes([0.1, 0.05, 0.8, 0.03])
slider = RangeSlider(slider_ax, 'X Range', 0, 1, valinit=(0, 1))

def update(val):
    low, high = slider.val
    mask = (x >= low) & (x <= high)
    ax2.clear()
    ax2.scatter(x[mask], y[mask])
    ax2.set_title(f'Filtered Data: {sum(mask)} points (how2matplotlib.com)')
    fig.canvas.draw_idle()

slider.on_changed(update)

plt.show()
Output:
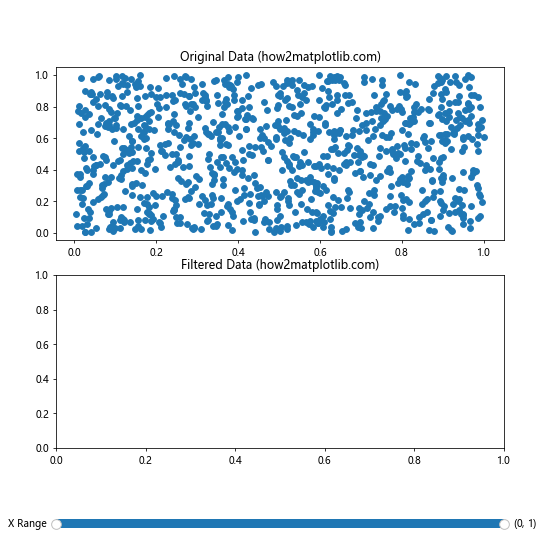
在这个例子中,我们创建了两个子图:一个显示原始数据,另一个显示筛选后的数据。用户可以通过拖动滑块来选择X轴的范围,下方的图表会实时更新以显示筛选后的数据点。
14. 事件处理与图表缩放
Matplotlib提供了内置的缩放功能,但我们也可以使用事件处理来创建自定义的缩放行为。让我们创建一个例子,用户可以通过鼠标滚轮来缩放图表:
import matplotlib.pyplot as plt
import numpy as np

fig, ax = plt.subplots()
ax.set_title('Use mouse wheel to zoom (how2matplotlib.com)')

x = np.linspace(0, 10, 100)
y = np.sin(x)
ax.plot(x, y)

def on_scroll(event):
    cur_xlim = ax.get_xlim()
    cur_ylim = ax.get_ylim()
    xdata = event.xdata
    ydata = event.ydata
    if event.button == 'up':
        scale_factor = 0.9
    elif event.button == 'down':
        scale_factor = 1.1
    else:
        scale_factor = 1

    new_width = (cur_xlim[1] - cur_xlim[0]) * scale_factor
    new_height = (cur_ylim[1] - cur_ylim[0]) * scale_factor

    relx = (cur_xlim[1] - xdata)/(cur_xlim[1] - cur_xlim[0])
    rely = (cur_ylim[1] - ydata)/(cur_ylim[1] - cur_ylim[0])

    ax.set_xlim([xdata - new_width * (1-relx), xdata + new_width * relx])
    ax.set_ylim([ydata - new_height * (1-rely), ydata + new_height * rely])

    fig.canvas.draw_idle()

fig.canvas.mpl_connect('scroll_event', on_scroll)

plt.show()
Output:
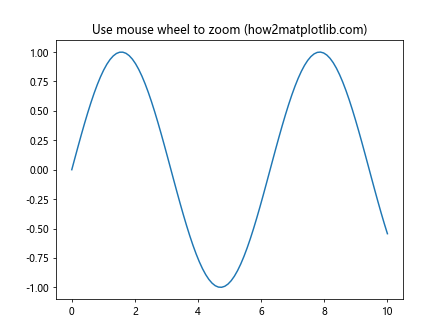
在这个例子中,用户可以通过鼠标滚轮来放大或缩小图表。向上滚动会放大,向下滚动会缩小。缩放会以鼠标所在位置为中心进行。
15. 事件处理与图表导航
我们可以使用事件处理来创建自定义的图表导航工具。让我们创建一个例子,用户可以通过键盘箭头键来平移图表:
import matplotlib.pyplot as plt
import numpy as np

fig, ax = plt.subplots()
ax.set_title('Use arrow keys to navigate (how2matplotlib.com)')

x = np.linspace(0, 10, 100)
y = np.sin(x)
ax.plot(x, y)

def on_key(event):
    xlim = ax.get_xlim()
    ylim = ax.get_ylim()

    if event.key == 'left':
        ax.set_xlim(xlim[0] - 0.5, xlim[1] - 0.5)
    elif event.key == 'right':
        ax.set_xlim(xlim[0] + 0.5, xlim[1] + 0.5)
    elif event.key == 'up':
        ax.set_ylim(ylim[0] + 0.1, ylim[1] + 0.1)
    elif event.key == 'down':
        ax.set_ylim(ylim[0] - 0.1, ylim[1] - 0.1)

    fig.canvas.draw_idle()

fig.canvas.mpl_connect('key_press_event', on_key)

plt.show()
Output:
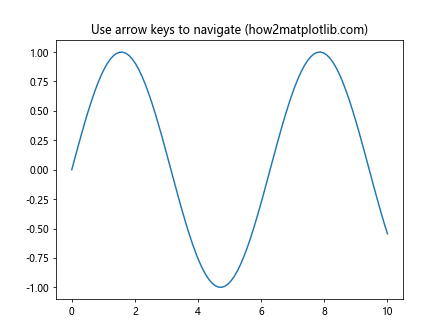
在这个例子中,用户可以使用键盘的箭头键来平移图表。左右箭头键用于水平平移,上下箭头键用于垂直平移。
结论
通过本文的详细介绍和丰富的示例,我们深入探讨了Matplotlib中的事件处理机制。事件处理为我们提供了创建交互式可视化的强大工具,使我们能够实现各种复杂的交互效果,如动态更新、自定义工具、多图表交互等。
事件处理不仅可以增强用户体验,还可以帮助我们更好地理解和分析数据。通过结合事件处理与其他Matplotlib功能,如动画、小部件等,我们可以创建出更加丰富和有吸引力的数据可视化效果。
在实际应用中,合理使用事件处理可以大大提高数据可视化的交互性和信息量。然而,在实现复杂的交互式可视化时,我们也需要注意性能问题,确保交互响应迅速,用户体验流畅。
总的来说,掌握Matplotlib的事件处理机制,将为我们在Python数据可视化领域打开一扇新的大门,让我们能够创建出更加专业和吸引人的可视化作品。
 极客笔记
极客笔记