Matplotlib绘制水平条形图:全面指南与实例
参考:Draw a horizontal bar chart with Matplotlib
Matplotlib是Python中最流行的数据可视化库之一,它提供了丰富的绘图功能,其中包括绘制水平条形图。水平条形图是一种常用的数据可视化方式,特别适合展示分类数据的比较和排序。本文将全面介绍如何使用Matplotlib绘制水平条形图,包括基础绘制、自定义样式、多组数据对比、堆叠条形图等多个方面,并提供详细的示例代码和解释。
1. 基础水平条形图
首先,让我们从最基本的水平条形图开始。使用Matplotlib的barh()函数可以轻松创建水平条形图。
import matplotlib.pyplot as plt

categories = ['Category A', 'Category B', 'Category C', 'Category D']
values = [4, 7, 2, 5]

plt.figure(figsize=(10, 6))
plt.barh(categories, values)
plt.title('Basic Horizontal Bar Chart - how2matplotlib.com')
plt.xlabel('Values')
plt.ylabel('Categories')
plt.show()
Output:
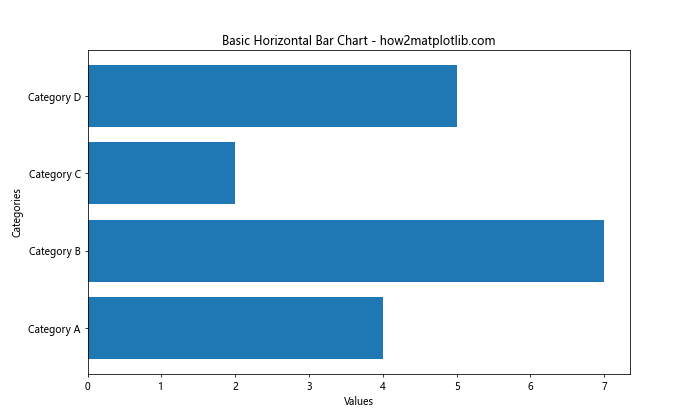
这段代码创建了一个简单的水平条形图。plt.barh()函数接受两个主要参数:类别标签和对应的数值。figsize参数设置图表的大小,title、xlabel和ylabel分别设置图表标题和坐标轴标签。
2. 自定义条形颜色
可以通过color参数自定义条形的颜色,使图表更具吸引力。
import matplotlib.pyplot as plt

categories = ['Product A', 'Product B', 'Product C', 'Product D']
sales = [300, 400, 350, 500]

plt.figure(figsize=(10, 6))
plt.barh(categories, sales, color='skyblue')
plt.title('Sales by Product - how2matplotlib.com')
plt.xlabel('Sales (units)')
plt.ylabel('Products')
plt.show()
Output:
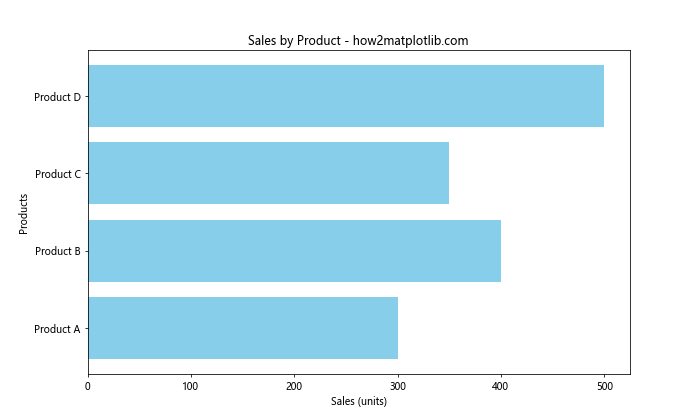
在这个例子中,我们将所有条形的颜色设置为天蓝色(skyblue)。你可以使用任何有效的颜色名称或十六进制颜色代码。
3. 添加数值标签
为了使图表更加信息丰富,我们可以在每个条形的末端添加数值标签。
import matplotlib.pyplot as plt

categories = ['Region 1', 'Region 2', 'Region 3', 'Region 4']
revenue = [5000, 7000, 3000, 8000]

fig, ax = plt.subplots(figsize=(10, 6))
bars = ax.barh(categories, revenue, color='lightgreen')

ax.set_title('Revenue by Region - how2matplotlib.com')
ax.set_xlabel('Revenue ()')
ax.set_ylabel('Regions')

# 添加数值标签
for bar in bars:
    width = bar.get_width()
    ax.text(width, bar.get_y() + bar.get_height()/2, f'{width:,}',
            ha='left', va='center')

plt.tight_layout()
plt.show()
Output:
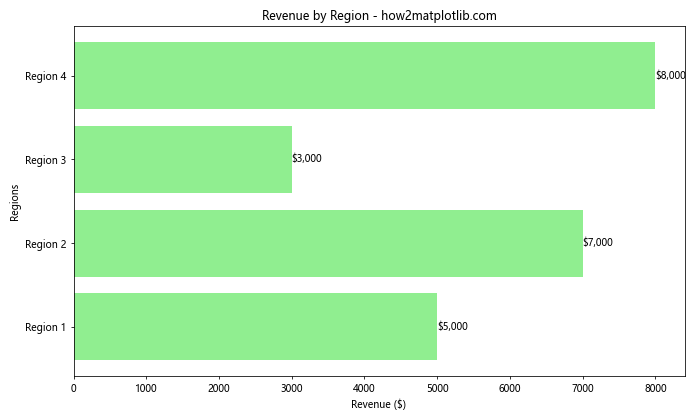
这个示例使用了ax.text()方法为每个条形添加数值标签。我们遍历每个条形,获取其宽度(即数值),然后在适当的位置添加文本。f'${width:,}'格式化字符串用于添加美元符号和千位分隔符。
4. 排序条形
通常,我们希望按照数值大小对条形进行排序,以便更清晰地展示数据的排名。
import matplotlib.pyplot as plt

countries = ['USA', 'China', 'Japan', 'Germany', 'UK']
gdp = [21400, 14300, 5100, 3800, 2700]

# 对数据进行排序
sorted_data = sorted(zip(gdp, countries), reverse=True)
gdp_sorted, countries_sorted = zip(*sorted_data)

plt.figure(figsize=(10, 6))
plt.barh(countries_sorted, gdp_sorted, color='coral')
plt.title('Top 5 Countries by GDP - how2matplotlib.com')
plt.xlabel('GDP (Billion USD)')
plt.ylabel('Countries')

# 添加数值标签
for i, v in enumerate(gdp_sorted):
    plt.text(v, i, f' ${v:,}B', va='center')

plt.tight_layout()
plt.show()
Output:
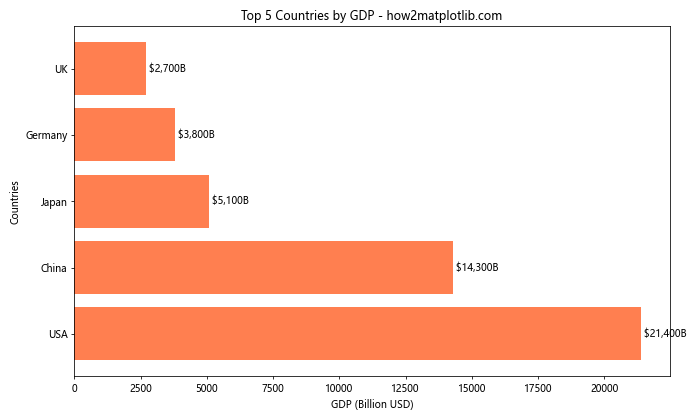
这个例子首先使用zip和sorted函数对数据进行排序,然后绘制排序后的数据。我们还添加了格式化的数值标签,显示每个国家的GDP值。
5. 使用不同颜色
为每个条形使用不同的颜色可以增加图表的视觉吸引力,并帮助区分不同类别。
import matplotlib.pyplot as plt

fruits = ['Apples', 'Bananas', 'Oranges', 'Grapes', 'Strawberries']
sales = [35, 25, 30, 20, 15]
colors = ['red', 'yellow', 'orange', 'purple', 'pink']

plt.figure(figsize=(10, 6))
bars = plt.barh(fruits, sales, color=colors)
plt.title('Fruit Sales - how2matplotlib.com')
plt.xlabel('Sales (tons)')
plt.ylabel('Fruits')

# 添加数值标签
for bar in bars:
    width = bar.get_width()
    plt.text(width, bar.get_y() + bar.get_height()/2, f'{width}',
             ha='left', va='center')

plt.tight_layout()
plt.show()
Output:
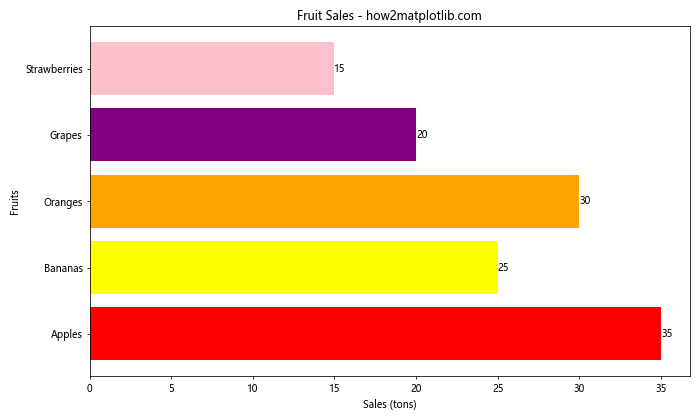
在这个例子中,我们为每种水果分配了一个相关的颜色。这不仅使图表更加生动,还增强了各类别之间的区分度。
6. 添加误差条
在某些情况下,我们可能需要显示数据的不确定性或变异性。这可以通过添加误差条来实现。
import matplotlib.pyplot as plt
import numpy as np

categories = ['Category A', 'Category B', 'Category C', 'Category D']
values = [4, 7, 2, 5]
errors = [0.5, 1, 0.3, 0.8]

plt.figure(figsize=(10, 6))
plt.barh(categories, values, xerr=errors, capsize=5, color='lightblue', ecolor='gray')
plt.title('Horizontal Bar Chart with Error Bars - how2matplotlib.com')
plt.xlabel('Values')
plt.ylabel('Categories')

plt.tight_layout()
plt.show()
Output:
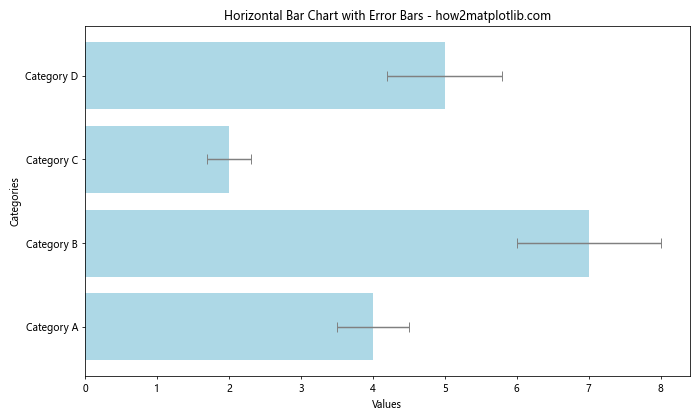
这个示例使用xerr参数添加了水平误差条。capsize参数设置误差条末端横线的长度,ecolor设置误差条的颜色。
7. 分组水平条形图
当需要比较多个组的多个类别时,分组水平条形图非常有用。
import matplotlib.pyplot as plt
import numpy as np

categories = ['Category A', 'Category B', 'Category C', 'Category D']
group1 = [4, 7, 2, 5]
group2 = [3, 6, 4, 3]

y = np.arange(len(categories))
height = 0.35

fig, ax = plt.subplots(figsize=(10, 6))
ax.barh(y - height/2, group1, height, label='Group 1', color='skyblue')
ax.barh(y + height/2, group2, height, label='Group 2', color='lightgreen')

ax.set_yticks(y)
ax.set_yticklabels(categories)
ax.legend()

plt.title('Grouped Horizontal Bar Chart - how2matplotlib.com')
plt.xlabel('Values')
plt.ylabel('Categories')

plt.tight_layout()
plt.show()
Output:
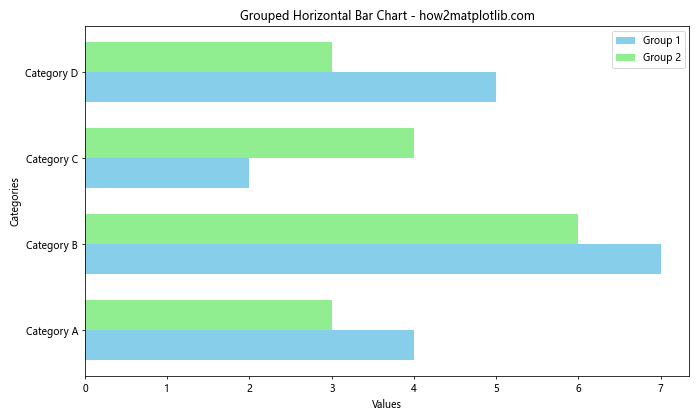
这个例子创建了一个分组水平条形图,比较了两个组在四个类别上的数据。我们使用numpy的arange函数来计算条形的位置,并通过调整y坐标来并排放置两组条形。
8. 堆叠水平条形图
堆叠条形图用于显示部分对整体的贡献,同时保持总量的对比。
import matplotlib.pyplot as plt

categories = ['Product A', 'Product B', 'Product C', 'Product D']
sales_q1 = [10, 15, 8, 12]
sales_q2 = [12, 18, 9, 11]
sales_q3 = [15, 20, 10, 14]

plt.figure(figsize=(10, 6))
plt.barh(categories, sales_q1, label='Q1', color='lightblue')
plt.barh(categories, sales_q2, left=sales_q1, label='Q2', color='lightgreen')
plt.barh(categories, sales_q3, left=[i+j for i,j in zip(sales_q1, sales_q2)], label='Q3', color='coral')

plt.title('Stacked Horizontal Bar Chart - Sales by Quarter - how2matplotlib.com')
plt.xlabel('Sales')
plt.ylabel('Products')
plt.legend()

plt.tight_layout()
plt.show()
Output:
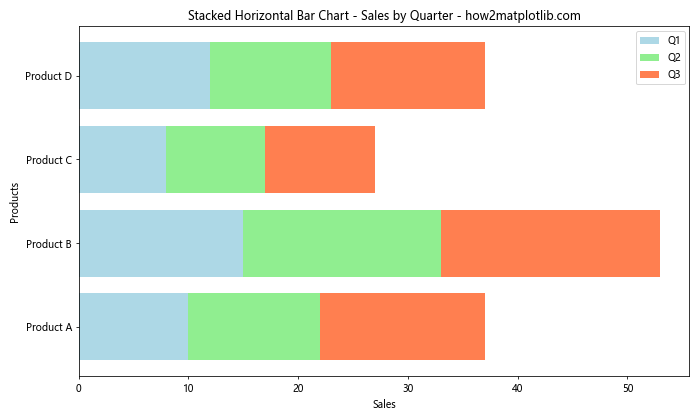
在这个堆叠条形图中,我们展示了四种产品在三个季度的销售情况。left参数用于指定每个条形的起始位置,确保条形正确堆叠。
9. 使用渐变色
使用颜色渐变可以为水平条形图添加额外的视觉维度,例如根据数值大小变化颜色深浅。
import matplotlib.pyplot as plt
import numpy as np

categories = ['Category A', 'Category B', 'Category C', 'Category D', 'Category E']
values = [23, 45, 56, 78, 32]

# 创建颜色映射
colors = plt.cm.Blues(np.linspace(0.3, 1, len(values)))

plt.figure(figsize=(10, 6))
bars = plt.barh(categories, values, color=colors)
plt.title('Horizontal Bar Chart with Color Gradient - how2matplotlib.com')
plt.xlabel('Values')
plt.ylabel('Categories')

# 添加数值标签
for bar in bars:
    width = bar.get_width()
    plt.text(width, bar.get_y() + bar.get_height()/2, f'{width}',
             ha='left', va='center')

plt.tight_layout()
plt.show()
Output:
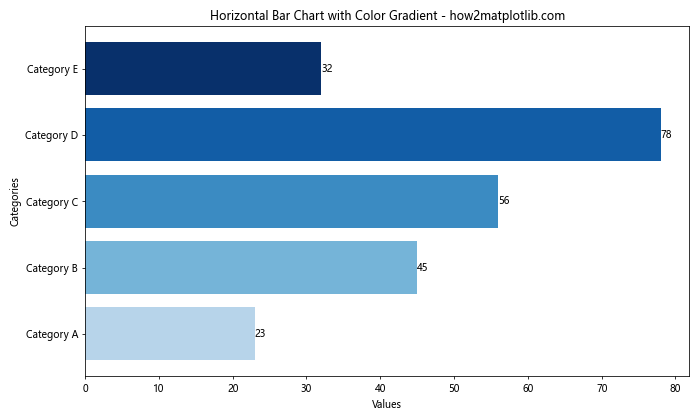
这个例子使用了Matplotlib的颜色映射(colormap)功能。我们选择了’Blues’色图,并使用np.linspace创建了一个从浅到深的蓝色渐变。
10. 添加网格线
网格线可以帮助读者更准确地解读数值。
import matplotlib.pyplot as plt

categories = ['Option A', 'Option B', 'Option C', 'Option D']
votes = [120, 250, 180, 310]

fig, ax = plt.subplots(figsize=(10, 6))
bars = ax.barh(categories, votes, color='lightcoral')

ax.set_title('Voting Results - how2matplotlib.com')
ax.set_xlabel('Number of Votes')
ax.set_ylabel('Options')

# 添加网格线
ax.grid(axis='x', linestyle='--', alpha=0.7)

# 添加数值标签
for bar in bars:
    width = bar.get_width()
    ax.text(width, bar.get_y() + bar.get_height()/2, f'{width}',
            ha='left', va='center')

plt.tight_layout()
plt.show()
Output:
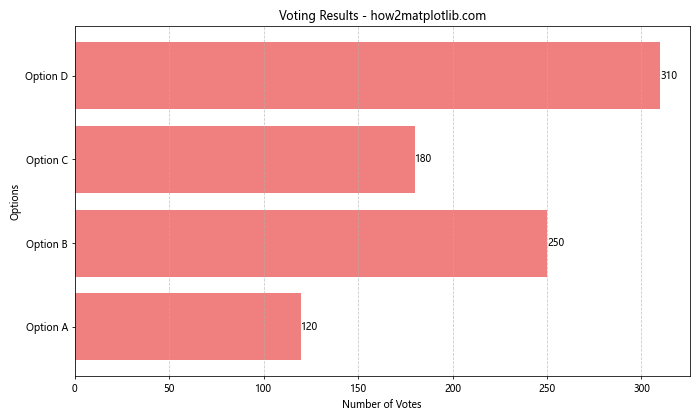
这个示例中,我们使用ax.grid()函数添加了垂直网格线。axis='x'参数指定只显示x轴的网格线,linestyle='--'设置网格线为虚线,alpha=0.7调整网格线的透明度。
11. 自定义刻度标签
有时,我们可能需要自定义坐标轴的刻度标签,以更好地展示数据。
import matplotlib.pyplot as plt

categories = ['Cat. A', 'Cat. B', 'Cat. C', 'Cat. D']
values = [1500000, 2700000, 900000, 1200000]

plt.figure(figsize=(10, 6))
bars = plt.barh(categories, values, color='mediumseagreen')

plt.title('Sales by Category - how2matplotlib.com')
plt.xlabel('Sales ()')
plt.ylabel('Categories')

# 自定义x轴刻度标签
plt.xticks([0, 1000000, 2000000, 3000000], ['0', '1M', '2M', '3M'])

# 添加数值标签
for bar in bars:
    width = bar.get_width()
    plt.text(width, bar.get_y() + bar.get_height()/2, f'{width:,.0f}',
             ha='left', va='center')

plt.tight_layout()
plt.show()
Output:
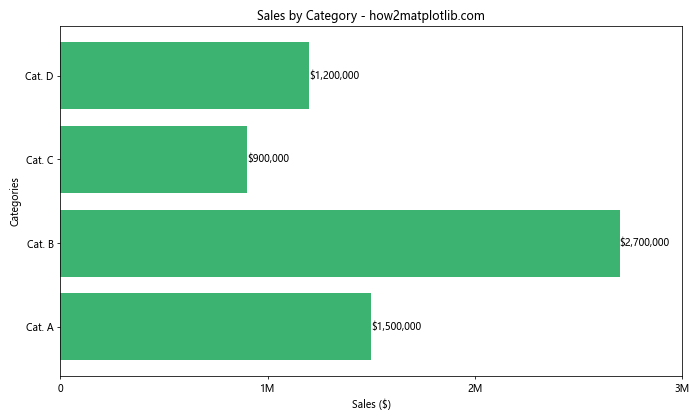
在这个例子中,我们使用plt.xticks()函数自定义了x轴的刻度标签,将大数字简化为更易读的形式。同时,我们在数值标签中使用了格式化字符串来显示完整的数值。
12. 条形图与线图结合
有时,将条形图与线图结合可以在同一图表中展示不同类型的数据。
import matplotlib.pyplot as plt

categories = ['Jan', 'Feb', 'Mar', 'Apr', 'May']
bar_values = [100, 120, 80, 140, 110]
line_values = [90, 100, 95, 120, 130]

fig, ax1 = plt.subplots(figsize=(10, 6))

# 绘制条形图
ax1.barh(categories, bar_values, color='lightblue', alpha=0.7)
ax1.set_xlabel('Sales')
ax1.set_ylabel('Months')
ax1.set_title('Sales and Profit - how2matplotlib.com')

# 创建第二个y轴
ax2 = ax1.twiny()

# 绘制线图
ax2.plot(line_values, categories, color='red', marker='o')
ax2.set_xlabel('Profit')

# 添加图例
ax1.legend(['Sales'], loc='lower right')
ax2.legend(['Profit'], loc='upper right')

plt.tight_layout()
plt.show()
Output:
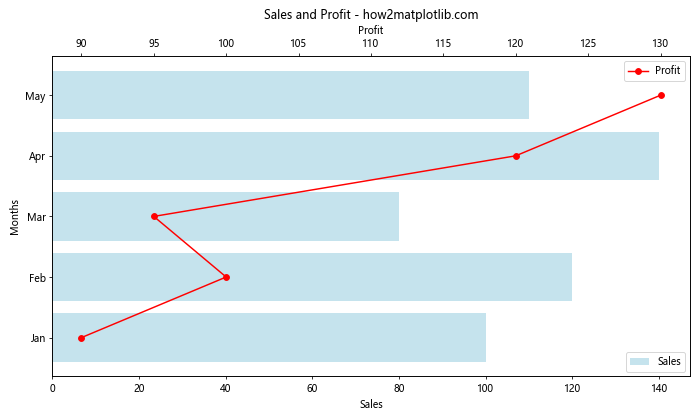
这个例子展示了如何在同一图表中结合水平条形图和线图。我们使用ax1.barh()绘制销售数据的条形图,然后使用ax1.twiny()创建一个共享y轴的新x轴。最后,我们在新的坐标轴上使用ax2.plot()绘制利润数据的线图。
13. 添加水平参考线
有时,添加水平参考线可以帮助读者更好地理解数据的相对位置。
import matplotlib.pyplot as plt

categories = ['Team A', 'Team B', 'Team C', 'Team D', 'Team E']
scores = [75, 88, 62, 95, 70]

fig, ax = plt.subplots(figsize=(10, 6))
bars = ax.barh(categories, scores, color='lightgreen')

ax.set_title('Team Performance Scores - how2matplotlib.com')
ax.set_xlabel('Scores')
ax.set_ylabel('Teams')

# 添加平均分参考线
average_score = sum(scores) / len(scores)
ax.axvline(average_score, color='red', linestyle='--', label=f'Average ({average_score:.1f})')

# 添加数值标签
for bar in bars:
    width = bar.get_width()
    ax.text(width, bar.get_y() + bar.get_height()/2, f'{width}',
            ha='left', va='center')

ax.legend()
plt.tight_layout()
plt.show()
Output:
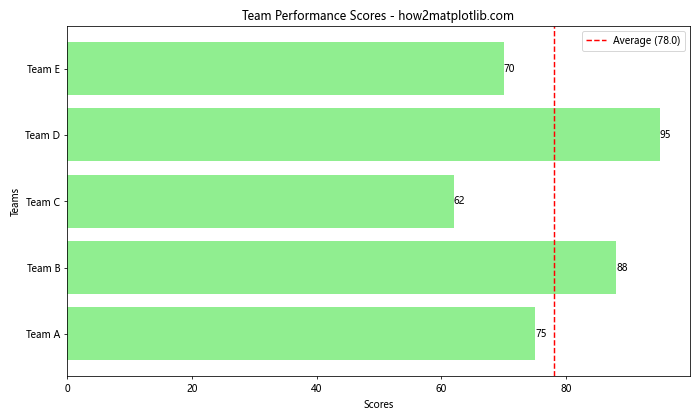
在这个例子中,我们计算了所有团队的平均分,并使用ax.axvline()函数添加了一条垂直参考线来表示平均分。这有助于快速识别哪些团队表现高于或低于平均水平。
14. 条形图与散点图结合
结合条形图和散点图可以同时展示总体趋势和个别数据点。
import matplotlib.pyplot as plt
import numpy as np

categories = ['Category A', 'Category B', 'Category C', 'Category D', 'Category E']
averages = [45, 60, 35, 50, 55]
individual_data = [
    [43, 47, 49, 44],
    [58, 61, 59, 62],
    [33, 36, 38, 33],
    [48, 51, 52, 49],
    [53, 56, 58, 53]
]

fig, ax = plt.subplots(figsize=(12, 6))

# 绘制条形图
bars = ax.barh(categories, averages, color='lightblue', alpha=0.7)

# 绘制散点图
for i, data in enumerate(individual_data):
    ax.scatter(data, [i] * len(data), color='navy', alpha=0.6)

ax.set_title('Average and Individual Scores - how2matplotlib.com')
ax.set_xlabel('Scores')
ax.set_ylabel('Categories')

# 添加平均值标签
for bar in bars:
    width = bar.get_width()
    ax.text(width, bar.get_y() + bar.get_height()/2, f'{width}',
            ha='left', va='center')

plt.tight_layout()
plt.show()
Output:
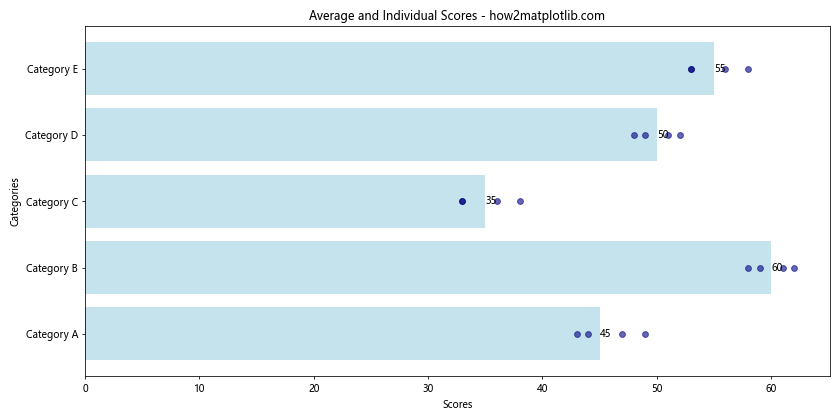
这个例子展示了如何将水平条形图与散点图结合。条形表示每个类别的平均分数,而散点则代表每个类别中的个别数据点。这种组合可以同时展示总体趋势和数据的分布情况。
15. 使用图像作为条形填充
为了使图表更加生动有趣,我们可以使用图像来填充条形。
import matplotlib.pyplot as plt
import numpy as np

# 假设我们有一个名为'pattern.png'的图像文件
from matplotlib.offsetbox import OffsetImage, AnnotationBbox

categories = ['Product A', 'Product B', 'Product C', 'Product D']
sales = [120, 200, 150, 180]

fig, ax = plt.subplots(figsize=(12, 6))

# 创建一个模式图像(这里用随机噪声代替实际图像)
pattern = np.random.rand(10, 10)
im = OffsetImage(pattern, zoom=2)

for i, (category, sale) in enumerate(zip(categories, sales)):
    bar = ax.barh(category, sale, color='lightgray', edgecolor='black')

    # 使用图像填充条形
    for patch in bar:
        ab = AnnotationBbox(im, (patch.get_width()/2, patch.get_y() + patch.get_height()/2),
                            frameon=False, box_alignment=(0.5, 0.5))
        ax.add_artist(ab)

ax.set_title('Product Sales with Pattern Fill - how2matplotlib.com')
ax.set_xlabel('Sales')
ax.set_ylabel('Products')

# 添加数值标签
for i, v in enumerate(sales):
    ax.text(v, i, f' {v}', va='center')

plt.tight_layout()
plt.show()
Output:
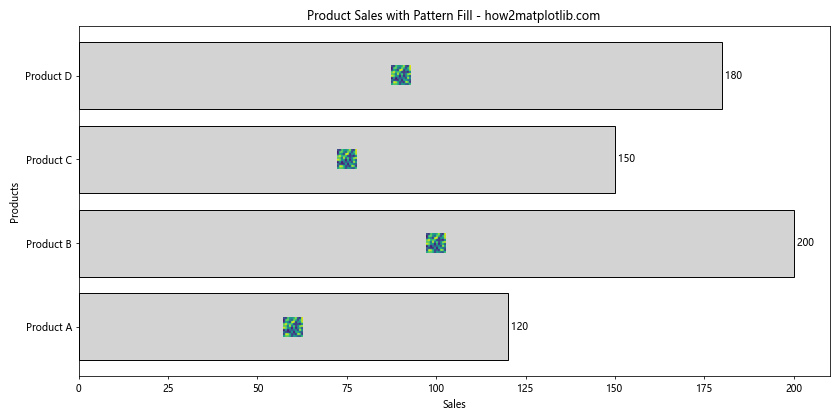
这个例子展示了如何使用图像来填充条形。我们使用OffsetImage和AnnotationBbox来将图像放置在每个条形内。在实际应用中,你可以替换pattern变量为实际的图像文件。
16. 添加注释
有时,我们需要为图表中的特定元素添加注释,以提供额外的上下文或解释。
import matplotlib.pyplot as plt

categories = ['Product A', 'Product B', 'Product C', 'Product D', 'Product E']
sales = [150, 230, 180, 310, 200]

fig, ax = plt.subplots(figsize=(12, 6))
bars = ax.barh(categories, sales, color='lightcoral')

ax.set_title('Product Sales - how2matplotlib.com')
ax.set_xlabel('Sales (units)')
ax.set_ylabel('Products')

# 添加数值标签
for bar in bars:
    width = bar.get_width()
    ax.text(width, bar.get_y() + bar.get_height()/2, f'{width}',
            ha='left', va='center')

# 添加注释
ax.annotate('Best Seller!', xy=(310, 3), xytext=(320, 3.5),
            arrowprops=dict(facecolor='black', shrink=0.05))

plt.tight_layout()
plt.show()
Output:
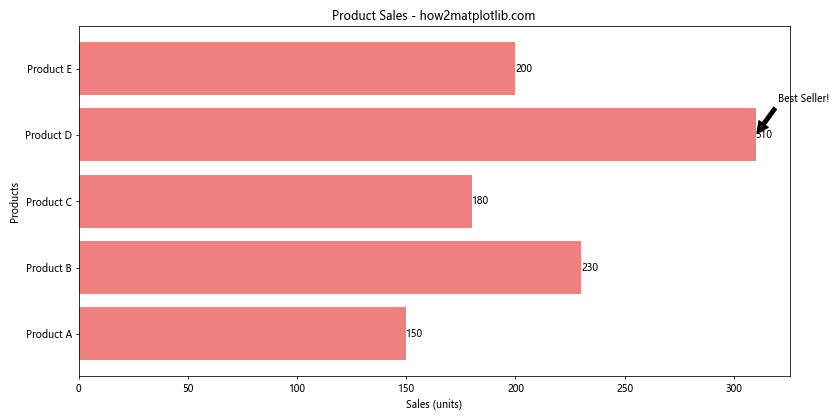
在这个例子中,我们使用ax.annotate()函数为销量最高的产品添加了一个注释。xy参数指定箭头的目标位置,xytext指定文本的位置,arrowprops定义了箭头的样式。
17. 条形图与误差线结合
当我们需要显示数据的不确定性或变异性时,可以将条形图与误差线结合使用。
import matplotlib.pyplot as plt
import numpy as np

categories = ['Group A', 'Group B', 'Group C', 'Group D']
means = [50, 65, 45, 70]
std_devs = [5, 7, 4, 6]

fig, ax = plt.subplots(figsize=(10, 6))

# 绘制条形图和误差线
bars = ax.barh(categories, means, xerr=std_devs, capsize=5,
               color='skyblue', edgecolor='navy', alpha=0.7)

ax.set_title('Group Scores with Standard Deviation - how2matplotlib.com')
ax.set_xlabel('Scores')
ax.set_ylabel('Groups')

# 添加均值标签
for bar in bars:
    width = bar.get_width()
    ax.text(width, bar.get_y() + bar.get_height()/2, f'{width:.1f}',
            ha='left', va='center')

plt.tight_layout()
plt.show()
Output:
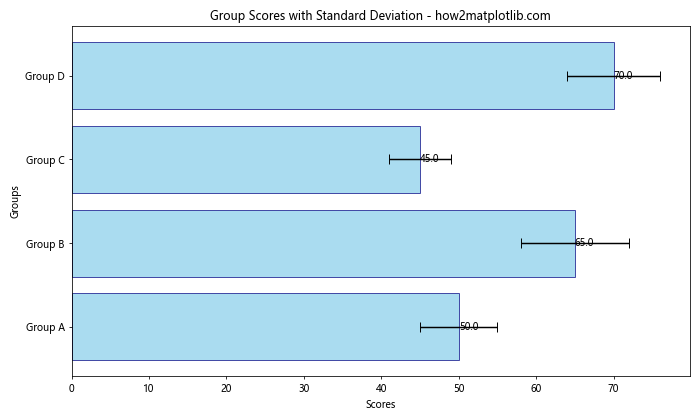
这个例子展示了如何在水平条形图中添加误差线。xerr参数用于指定误差值,capsize参数设置误差线末端横线的长度。这种图表形式特别适合展示数据的平均值和标准差。
18. 使用对数刻度
当数据范围跨越多个数量级时,使用对数刻度可以更好地展示数据。
import matplotlib.pyplot as plt
import numpy as np

categories = ['Category A', 'Category B', 'Category C', 'Category D', 'Category E']
values = [100, 1000, 10000, 100000, 1000000]

fig, ax = plt.subplots(figsize=(10, 6))
bars = ax.barh(categories, values, color='lightgreen', log=True)

ax.set_title('Data on Logarithmic Scale - how2matplotlib.com')
ax.set_xlabel('Values (log scale)')
ax.set_ylabel('Categories')

# 添加数值标签
for bar in bars:
    width = bar.get_width()
    ax.text(width, bar.get_y() + bar.get_height()/2, f'{width:,.0f}',
            ha='left', va='center')

plt.tight_layout()
plt.show()
Output:
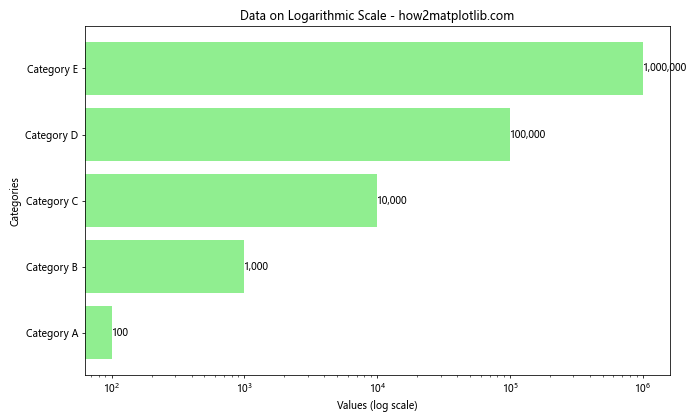
在这个例子中,我们通过设置log=True参数来使用对数刻度。这使得跨越多个数量级的数据可以在同一图表中清晰地展示。
19. 条形图与饼图结合
有时,将条形图与饼图结合可以同时展示绝对值和比例信息。
import matplotlib.pyplot as plt

categories = ['Category A', 'Category B', 'Category C', 'Category D']
values = [35, 25, 20, 20]

fig, (ax1, ax2) = plt.subplots(1, 2, figsize=(15, 6))

# 绘制水平条形图
bars = ax1.barh(categories, values, color=['#ff9999', '#66b3ff', '#99ff99', '#ffcc99'])
ax1.set_title('Values by Category - how2matplotlib.com')
ax1.set_xlabel('Values')
ax1.set_ylabel('Categories')

# 添加数值标签
for bar in bars:
    width = bar.get_width()
    ax1.text(width, bar.get_y() + bar.get_height()/2, f'{width}',
             ha='left', va='center')

# 绘制饼图
ax2.pie(values, labels=categories, autopct='%1.1f%%', startangle=90,
        colors=['#ff9999', '#66b3ff', '#99ff99', '#ffcc99'])
ax2.set_title('Percentage by Category - how2matplotlib.com')

plt.tight_layout()
plt.show()
Output:
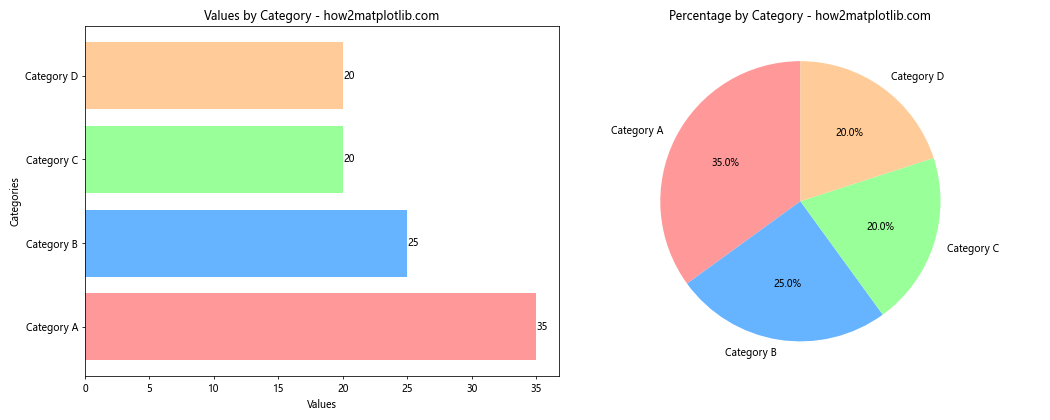
这个例子展示了如何在同一图表中结合水平条形图和饼图。条形图显示了每个类别的绝对值,而饼图则展示了各类别的相对比例。
20. 动态更新的条形图
最后,让我们看一个稍微高级一点的例子:如何创建一个动态更新的水平条形图。这在实时数据可视化中非常有用。
import matplotlib.pyplot as plt
import matplotlib.animation as animation
import numpy as np

categories = ['Category A', 'Category B', 'Category C', 'Category D']
values = [0, 0, 0, 0]

fig, ax = plt.subplots(figsize=(10, 6))

def animate(frame):
    # 更新数据
    for i in range(len(values)):
        values[i] += np.random.randint(1, 10)

    ax.clear()
    bars = ax.barh(categories, values, color='lightblue')

    ax.set_title('Dynamic Horizontal Bar Chart - how2matplotlib.com')
    ax.set_xlabel('Values')
    ax.set_ylabel('Categories')

    # 添加数值标签
    for bar in bars:
        width = bar.get_width()
        ax.text(width, bar.get_y() + bar.get_height()/2, f'{width}',
                ha='left', va='center')

    ax.set_xlim(0, max(values) + 10)  # 动态调整x轴范围

ani = animation.FuncAnimation(fig, animate, frames=50, interval=200, repeat=False)

plt.tight_layout()
plt.show()
Output:
这个例子创建了一个动态更新的水平条形图。animate函数在每一帧中更新数据并重新绘制图表。animation.FuncAnimation用于创建动画效果,frames参数指定动画的帧数,interval参数设置帧之间的间隔(毫秒)。
总结
本文详细介绍了如何使用Matplotlib绘制水平条形图,涵盖了从基础绘图到高级定制的多个方面。我们探讨了颜色定制、数据排序、添加标签、分组和堆叠条形图、结合其他图表类型等多种技巧。这些技巧可以帮助你创建更加丰富、信息量大且视觉吸引力强的数据可视化。
水平条形图是一种强大的数据可视化工具,特别适合展示分类数据的比较和排序。通过恰当的使用和定制,你可以有效地传达复杂的数据信息,使你的数据故事更加生动和易于理解。
记住,好的数据可视化不仅仅是about正确显示数据,还关乎如何以最有效的方式传达信息。因此,在选择和设计图表时,始终要考虑你的目标受众和你想要传达的核心信息。
 极客笔记
极客笔记