使用Pandas和Matplotlib创建棒棒糖图:数据可视化的新选择
参考:Create lollipop charts with Pandas and Matplotlib
棒棒糖图(Lollipop Chart)是一种独特而有效的数据可视化方式,它结合了条形图和散点图的特点,能够清晰地展示数据点的分布和数值大小。本文将详细介绍如何使用Python的Pandas和Matplotlib库来创建棒棒糖图,为您的数据分析和展示提供一种新的选择。
1. 棒棒糖图简介
棒棒糖图得名于其形状resembling棒棒糖,由一条垂直或水平的线(棒)和一个圆点(糖)组成。这种图表特别适合展示离散数据点的分布和比较,尤其在数据点较少时效果显著。
1.1 棒棒糖图的优势
- 视觉吸引力:独特的设计使得图表更加引人注目。
- 数据清晰度:相比传统条形图,棒棒糖图减少了视觉噪音,使数据更易读。
- 空间效率:适合展示多个类别的数据,尤其是在水平方向上。
- 灵活性:可以轻松地添加额外的数据维度,如颜色编码或大小变化。
1.2 适用场景
- 比较不同类别的单一数值
- 展示时间序列数据的变化
- 显示排名或等级数据
- 突出显示极值或异常值
2. 环境准备
在开始创建棒棒糖图之前,我们需要确保已经安装了必要的Python库。
import pandas as pd
import matplotlib.pyplot as plt

# 检查版本
print(f"Pandas version: {pd.__version__}")
print(f"Matplotlib version: {matplotlib.__version__}")
print("How to create lollipop charts with Pandas and Matplotlib - how2matplotlib.com")
确保您的环境中已安装最新版本的Pandas和Matplotlib。如果没有,可以使用pip进行安装:
pip install pandas matplotlib
3. 基础棒棒糖图
让我们从一个简单的垂直棒棒糖图开始,展示不同水果的销售量。
import pandas as pd
import matplotlib.pyplot as plt

# 创建示例数据
data = {'Fruit': ['Apple', 'Banana', 'Orange', 'Mango', 'Pineapple'],
        'Sales': [35, 25, 45, 30, 20]}
df = pd.DataFrame(data)

# 创建棒棒糖图
fig, ax = plt.subplots(figsize=(10, 6))
ax.stem(df['Fruit'], df['Sales'], linefmt='grey', markerfmt='D')

# 设置标题和标签
ax.set_title('Fruit Sales - how2matplotlib.com', fontsize=15)
ax.set_xlabel('Fruit')
ax.set_ylabel('Sales')

# 显示图表
plt.show()
Output:
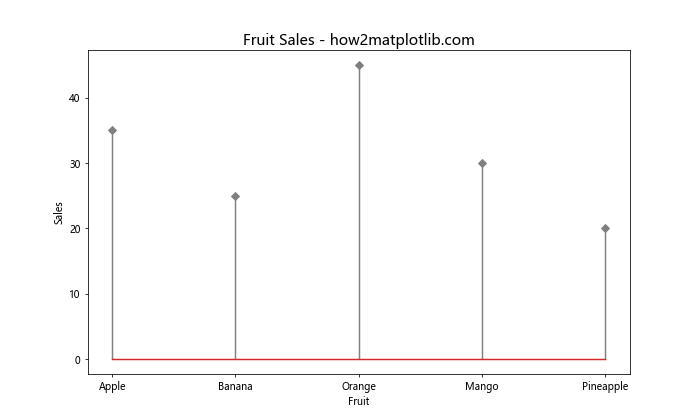
在这个例子中,我们使用stem()函数创建了一个基本的棒棒糖图。linefmt参数设置线的格式,markerfmt设置标记点的样式。
4. 水平棒棒糖图
有时,水平方向的棒棒糖图可能更适合展示某些类型的数据,特别是当类别名称较长时。
import pandas as pd
import matplotlib.pyplot as plt

# 创建示例数据
data = {'Country': ['United States', 'China', 'Japan', 'Germany', 'United Kingdom'],
        'GDP': [21433.23, 14342.90, 5081.77, 3846.41, 2829.11]}
df = pd.DataFrame(data)

# 创建水平棒棒糖图
fig, ax = plt.subplots(figsize=(12, 6))
ax.hlines(y=df.index, xmin=0, xmax=df['GDP'], color='skyblue')
ax.plot(df['GDP'], df.index, "o")

# 设置y轴标签
ax.set_yticks(df.index)
ax.set_yticklabels(df['Country'])

# 设置标题和标签
ax.set_title('GDP by Country (in billions USD) - how2matplotlib.com', fontsize=15)
ax.set_xlabel('GDP')

# 反转y轴以使最高值在顶部
ax.invert_yaxis()

plt.tight_layout()
plt.show()
Output:
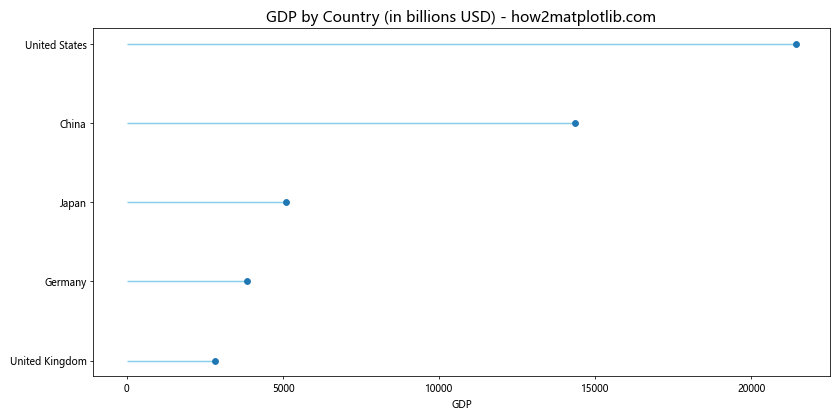
在这个例子中,我们使用hlines()函数创建水平线,然后用plot()函数添加端点标记。invert_yaxis()函数用于反转y轴,使最高值显示在顶部。
5. 添加数据标签
为了使图表更加信息丰富,我们可以在棒棒糖的顶端添加数据标签。
import pandas as pd
import matplotlib.pyplot as plt

# 创建示例数据
data = {'Category': ['A', 'B', 'C', 'D', 'E'],
        'Value': [23, 45, 56, 78, 32]}
df = pd.DataFrame(data)

# 创建棒棒糖图
fig, ax = plt.subplots(figsize=(10, 6))
ax.stem(df['Category'], df['Value'], linefmt='grey', markerfmt='D')

# 添加数据标签
for i, v in enumerate(df['Value']):
    ax.text(i, v, str(v), ha='center', va='bottom')

# 设置标题和标签
ax.set_title('Values by Category - how2matplotlib.com', fontsize=15)
ax.set_xlabel('Category')
ax.set_ylabel('Value')

plt.show()
Output:
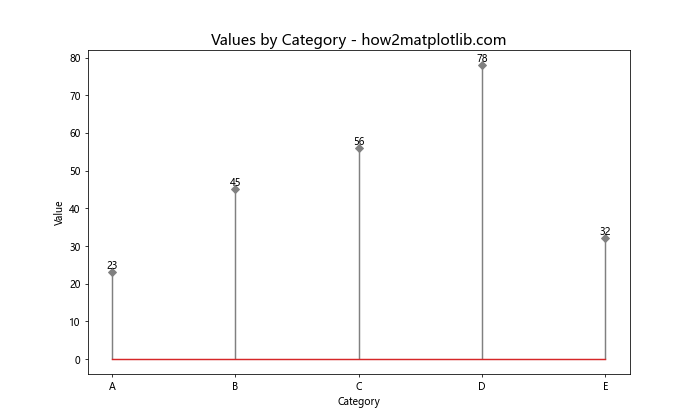
这个例子展示了如何使用text()函数在每个数据点上方添加数值标签。
6. 自定义颜色和样式
通过自定义颜色和样式,我们可以使棒棒糖图更加吸引眼球和信息丰富。
import pandas as pd
import matplotlib.pyplot as plt

# 创建示例数据
data = {'Month': ['Jan', 'Feb', 'Mar', 'Apr', 'May'],
        'Temperature': [5, 7, 12, 18, 23]}
df = pd.DataFrame(data)

# 创建棒棒糖图
fig, ax = plt.subplots(figsize=(10, 6))
ax.stem(df['Month'], df['Temperature'], linefmt='--', markerfmt='o', bottom=0)

# 自定义颜色和样式
plt.setp(ax.lines, color='red', linewidth=2)
plt.setp(ax.collections, color='navy', alpha=0.8, markersize=10)

# 设置标题和标签
ax.set_title('Monthly Temperature - how2matplotlib.com', fontsize=15)
ax.set_xlabel('Month')
ax.set_ylabel('Temperature (°C)')

plt.show()
在这个例子中,我们使用setp()函数来设置线条和标记点的颜色和样式。linefmt='--'创建了虚线效果,而alpha参数控制标记点的透明度。
7. 多系列棒棒糖图
当需要比较多个系列的数据时,我们可以创建多系列棒棒糖图。
import pandas as pd
import matplotlib.pyplot as plt

# 创建示例数据
data = {'Year': [2018, 2019, 2020, 2021, 2022],
        'Product A': [100, 120, 140, 160, 180],
        'Product B': [90, 110, 130, 150, 170]}
df = pd.DataFrame(data)

# 创建多系列棒棒糖图
fig, ax = plt.subplots(figsize=(12, 6))

# 绘制Product A
ax.stem(df['Year'], df['Product A'], linefmt='C0-', markerfmt='C0o', label='Product A')

# 绘制Product B
ax.stem(df['Year'], df['Product B'], linefmt='C1--', markerfmt='C1s', label='Product B')

# 设置标题和标签
ax.set_title('Sales Comparison - how2matplotlib.com', fontsize=15)
ax.set_xlabel('Year')
ax.set_ylabel('Sales')

# 添加图例
ax.legend()

plt.show()
Output:
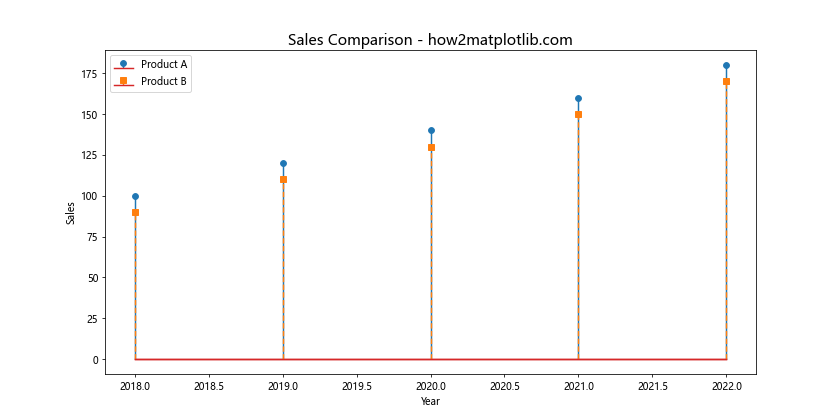
这个例子展示了如何在同一个图表中绘制两个不同的数据系列,使用不同的颜色和标记样式来区分。
8. 带有误差线的棒棒糖图
在某些情况下,我们可能需要显示数据的不确定性或变异性。这可以通过添加误差线来实现。
import pandas as pd
import matplotlib.pyplot as plt
import numpy as np

# 创建示例数据
np.random.seed(42)
data = {'Category': ['A', 'B', 'C', 'D', 'E'],
        'Value': np.random.randint(50, 100, 5),
        'Error': np.random.randint(5, 15, 5)}
df = pd.DataFrame(data)

# 创建带有误差线的棒棒糖图
fig, ax = plt.subplots(figsize=(10, 6))
ax.stem(df['Category'], df['Value'], linefmt='grey', markerfmt='D')

# 添加误差线
ax.errorbar(df['Category'], df['Value'], yerr=df['Error'], fmt='none', capsize=5, color='red', alpha=0.5)

# 设置标题和标签
ax.set_title('Values with Error Bars - how2matplotlib.com', fontsize=15)
ax.set_xlabel('Category')
ax.set_ylabel('Value')

plt.show()
Output:
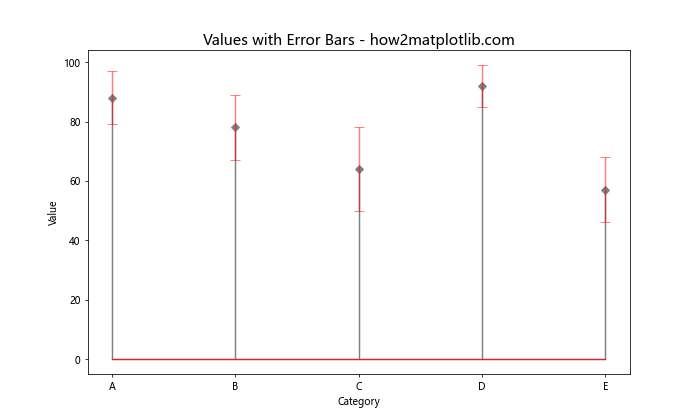
在这个例子中,我们使用errorbar()函数添加了误差线。capsize参数控制误差线末端横线的长度,而alpha参数调整透明度。
9. 分组棒棒糖图
当我们需要比较多个类别across不同组时,分组棒棒糖图可能是一个好选择。
import pandas as pd
import matplotlib.pyplot as plt
import numpy as np

# 创建示例数据
categories = ['A', 'B', 'C', 'D']
group1 = np.random.randint(20, 50, 4)
group2 = np.random.randint(20, 50, 4)

# 创建分组棒棒糖图
fig, ax = plt.subplots(figsize=(12, 6))

# 计算x轴位置
x = np.arange(len(categories))
width = 0.35

# 绘制两组棒棒糖
ax.stem(x - width/2, group1, linefmt='C0-', markerfmt='C0o', label='Group 1')
ax.stem(x + width/2, group2, linefmt='C1-', markerfmt='C1s', label='Group 2')

# 设置x轴刻度和标签
ax.set_xticks(x)
ax.set_xticklabels(categories)

# 设置标题和标签
ax.set_title('Grouped Lollipop Chart - how2matplotlib.com', fontsize=15)
ax.set_xlabel('Category')
ax.set_ylabel('Value')

# 添加图例
ax.legend()

plt.show()
Output:
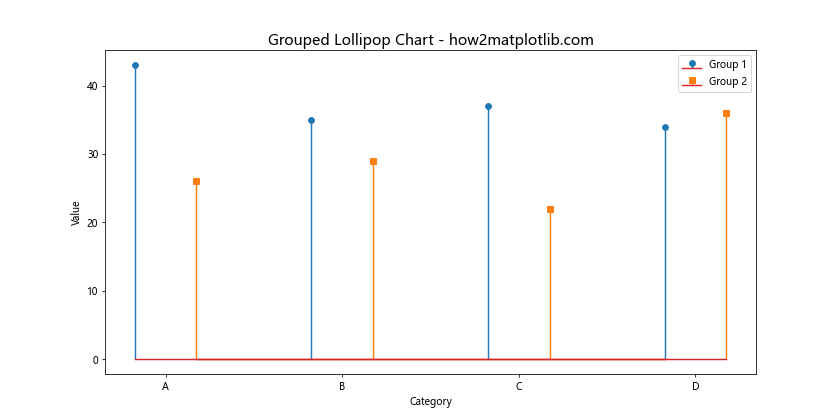
这个例子展示了如何创建分组棒棒糖图,通过调整x轴位置来并排显示不同组的数据。
10. 带有阈值线的棒棒糖图
有时,我们可能想要突出显示某个特定的阈值或目标值。这可以通过添加一条水平线来实现。
import pandas as pd
import matplotlib.pyplot as plt

# 创建示例数据
data = {'Department': ['HR', 'Marketing', 'Sales', 'IT', 'Finance'],
        'Budget': [50000, 75000, 100000, 65000, 80000]}
df = pd.DataFrame(data)

# 设置阈值
threshold = 70000

# 创建带有阈值线的棒棒糖图
fig, ax = plt.subplots(figsize=(10, 6))
ax.stem(df['Department'], df['Budget'], linefmt='grey', markerfmt='D')

# 添加阈值线
ax.axhline(y=threshold, color='r', linestyle='--', label='Threshold')

# 设置标题和标签
ax.set_title('Department Budgets - how2matplotlib.com', fontsize=15)
ax.set_xlabel('Department')
ax.set_ylabel('Budget ($)')

# 添加图例
ax.legend()

plt.show()
Output:
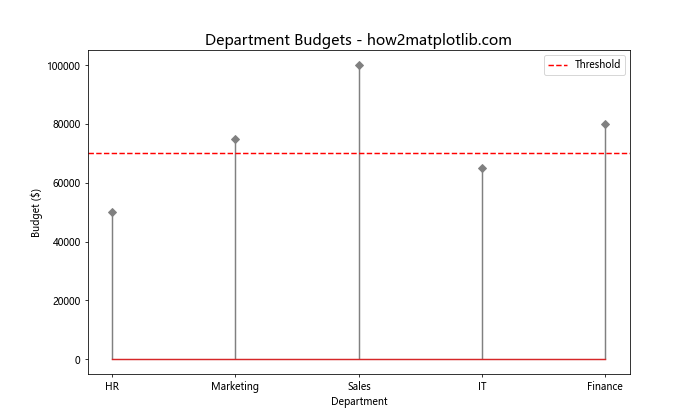
在这个例子中,我们使用axhline()函数添加了一条水平的阈值线。这有助于快速识别哪些部门的预算超过了设定的阈值。
11. 带有渐变色的棒棒糖图
使用颜色渐变可以为棒棒糖图添加额外的维度,例如表示数值的大小或重要性。
import pandas as pd
import matplotlib.pyplot as plt
import numpy as np

# 创建示例数据
data = {'City': ['New York', 'Los Angeles', 'Chicago', 'Houston', 'Phoenix'],
        'Population': [8336817, 3898747, 2746388, 2304580, 1608139]}
df = pd.DataFrame(data)

# 创建带有渐变色的棒棒糖图
fig, ax = plt.subplots(figsize=(12, 6))

# 创建颜色映射
colors = plt.cm.viridis(np.linspace(0, 1, len(df)))

# 绘制棒棒糖
for i, (city, pop) in enumerate(zip(df['City'], df['Population'])):
    ax.stem([city], [pop], linefmt=colors[i], markerfmt=f'o', bottom=0)

# 设置标题和标签
ax.set_title('CityPopulations - how2matplotlib.com', fontsize=15)
ax.set_xlabel('City')
ax.set_ylabel('Population')

# 旋转x轴标签以避免重叠
plt.xticks(rotation=45, ha='right')

plt.tight_layout()
plt.show()
在这个例子中,我们使用plt.cm.viridis颜色映射创建了一个渐变色方案。每个棒棒糖的颜色都根据其在数据集中的位置而变化,提供了一种视觉上的数据排序。
12. 双向棒棒糖图
双向棒棒糖图可以用来比较两个相关但对立的数据集,例如收入和支出。
import pandas as pd
import matplotlib.pyplot as plt

# 创建示例数据
data = {'Month': ['Jan', 'Feb', 'Mar', 'Apr', 'May'],
        'Income': [5000, 5500, 6000, 5800, 6200],
        'Expenses': [-4500, -4800, -5200, -5000, -5500]}
df = pd.DataFrame(data)

# 创建双向棒棒糖图
fig, ax = plt.subplots(figsize=(12, 6))

# 绘制收入
ax.stem(df['Month'], df['Income'], linefmt='g-', markerfmt='go', label='Income')

# 绘制支出
ax.stem(df['Month'], df['Expenses'], linefmt='r-', markerfmt='ro', label='Expenses')

# 设置标题和标签
ax.set_title('Income vs Expenses - how2matplotlib.com', fontsize=15)
ax.set_xlabel('Month')
ax.set_ylabel('Amount ($)')

# 添加图例
ax.legend()

# 添加零线
ax.axhline(y=0, color='k', linestyle='-', linewidth=0.5)

plt.show()
Output:
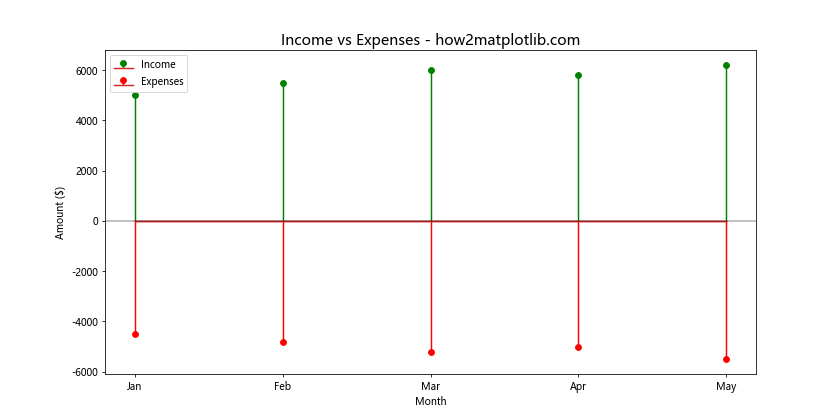
这个例子展示了如何创建双向棒棒糖图,其中正值(收入)向上延伸,负值(支出)向下延伸。零线的添加有助于清晰地区分正负值。
13. 带有标注的棒棒糖图
有时,我们可能想要为特定的数据点添加额外的信息或解释。这可以通过添加文本标注来实现。
import pandas as pd
import matplotlib.pyplot as plt

# 创建示例数据
data = {'Product': ['A', 'B', 'C', 'D', 'E'],
        'Sales': [120, 90, 180, 140, 160]}
df = pd.DataFrame(data)

# 创建带有标注的棒棒糖图
fig, ax = plt.subplots(figsize=(12, 6))
ax.stem(df['Product'], df['Sales'], linefmt='grey', markerfmt='D')

# 添加标注
ax.annotate('Best Seller', xy=('C', 180), xytext=(0.5, 0.95),
            textcoords='axes fraction',
            arrowprops=dict(facecolor='black', shrink=0.05),
            horizontalalignment='center', verticalalignment='top')

# 设置标题和标签
ax.set_title('Product Sales with Annotation - how2matplotlib.com', fontsize=15)
ax.set_xlabel('Product')
ax.set_ylabel('Sales')

plt.show()
Output:
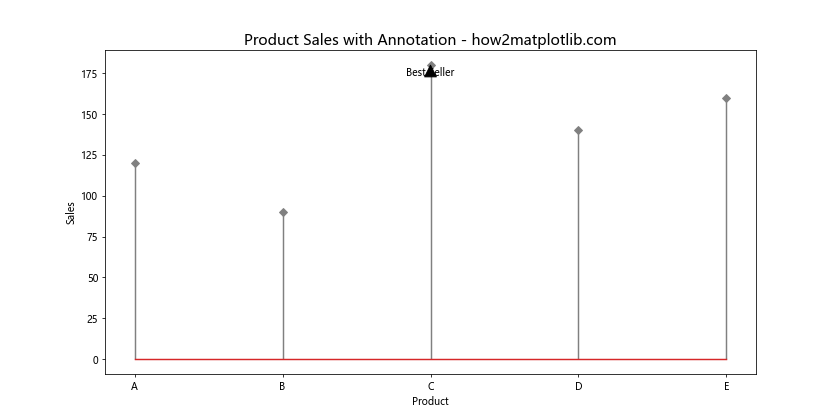
在这个例子中,我们使用annotate()函数为最高销售额的产品添加了一个标注。xy参数指定了箭头的目标位置,而xytext指定了文本的位置。
14. 带有填充区域的棒棒糖图
为了强调某些数据点或区域,我们可以在棒棒糖图中添加填充区域。
import pandas as pd
import matplotlib.pyplot as plt
import numpy as np

# 创建示例数据
data = {'Year': range(2010, 2021),
        'Value': [23, 25, 28, 32, 35, 40, 42, 45, 50, 52, 55]}
df = pd.DataFrame(data)

# 创建带有填充区域的棒棒糖图
fig, ax = plt.subplots(figsize=(12, 6))
ax.stem(df['Year'], df['Value'], linefmt='grey', markerfmt='D')

# 添加填充区域
ax.fill_between(df['Year'], df['Value'], alpha=0.2)

# 设置标题和标签
ax.set_title('Yearly Values with Filled Area - how2matplotlib.com', fontsize=15)
ax.set_xlabel('Year')
ax.set_ylabel('Value')

plt.show()
Output:
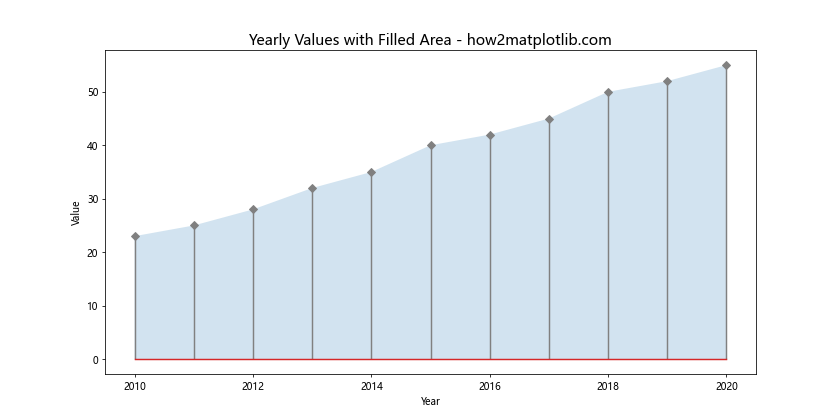
这个例子展示了如何使用fill_between()函数在棒棒糖下方添加一个半透明的填充区域,这可以帮助突出显示数据的整体趋势。
15. 带有子图的棒棒糖图
当我们需要比较多个相关但独立的数据集时,可以使用子图来创建多个棒棒糖图。
import pandas as pd
import matplotlib.pyplot as plt
import numpy as np

# 创建示例数据
np.random.seed(42)
data = {
    'Category': ['A', 'B', 'C', 'D', 'E'],
    'Group1': np.random.randint(20, 50, 5),
    'Group2': np.random.randint(30, 60, 5),
    'Group3': np.random.randint(40, 70, 5)
}
df = pd.DataFrame(data)

# 创建带有子图的棒棒糖图
fig, (ax1, ax2, ax3) = plt.subplots(1, 3, figsize=(18, 6))

# 绘制第一个子图
ax1.stem(df['Category'], df['Group1'], linefmt='C0-', markerfmt='C0o')
ax1.set_title('Group 1')

# 绘制第二个子图
ax2.stem(df['Category'], df['Group2'], linefmt='C1-', markerfmt='C1s')
ax2.set_title('Group 2')

# 绘制第三个子图
ax3.stem(df['Category'], df['Group3'], linefmt='C2-', markerfmt='C2D')
ax3.set_title('Group 3')

# 设置总标题
fig.suptitle('Comparison of Three Groups - how2matplotlib.com', fontsize=16)

plt.tight_layout()
plt.show()
Output:
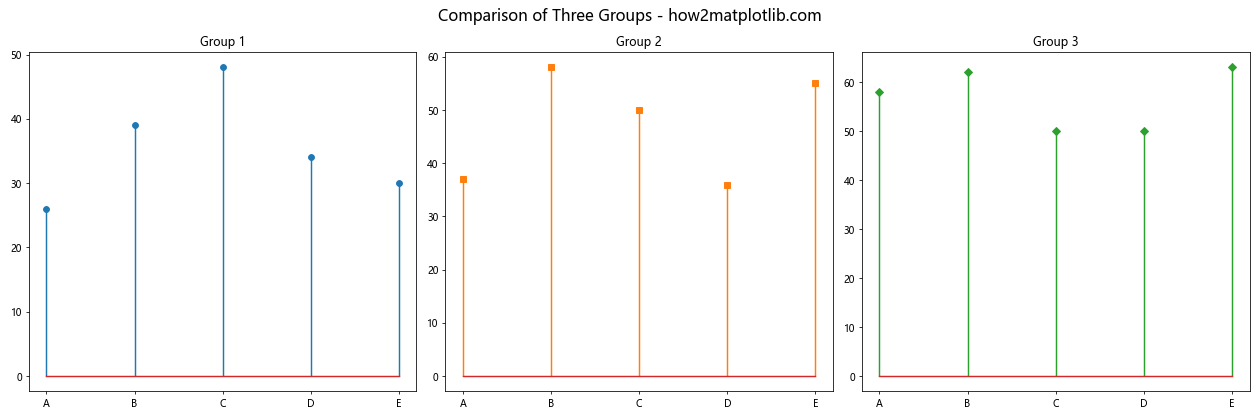
这个例子展示了如何创建包含多个子图的棒棒糖图,每个子图代表一个不同的数据组。这种方法允许我们在一个图形中并排比较多个数据集。
结论
棒棒糖图是一种versatile和吸引人的数据可视化方式,特别适合展示离散数据点的分布和比较。通过使用Pandas进行数据处理和Matplotlib进行绘图,我们可以创建各种类型的棒棒糖图,从简单的单系列图到复杂的多系列、多子图的可视化。
本文介绍了多种创建和自定义棒棒糖图的方法,包括基础垂直和水平图、添加数据标签、自定义颜色和样式、多系列比较、添加误差线和阈值线、使用渐变色、创建双向图、添加标注和填充区域等。这些技术可以根据具体的数据和分析需求进行组合和调整,以创建最适合您的数据故事的可视化效果。
在数据分析和展示过程中,选择合适的可视化方法至关重要。棒棒糖图作为条形图和散点图的结合,在某些场景下可能比传统图表更有效。它们特别适合展示排名数据、时间序列变化、类别比较等,并且在数据点较少时尤其有效。
通过掌握这些创建棒棒糖图的技巧,您可以为您的数据分析工具箱添加一个强大而灵活的可视化选项。无论是在商业报告、学术论文还是数据科学项目中,棒棒糖图都能帮助您以清晰、吸引人的方式传达数据洞察。
记住,好的数据可视化不仅仅是about创建漂亮的图表,更重要的是有效地传达信息和见解。因此,在选择和设计棒棒糖图时,始终要考虑您的目标受众和您想要传达的核心信息。通过实践和经验,您将能够熟练运用这些技术,创建出既美观又富有洞察力的数据可视化。
 极客笔记
极客笔记