Matplotlib中如何调整误差条的粗细:全面指南
参考:Change the error bar thickness in Matplotlib
在数据可视化中,误差条是表示数据不确定性或变异性的重要工具。Matplotlib作为Python中最流行的绘图库之一,提供了丰富的功能来创建和自定义误差条。本文将深入探讨如何在Matplotlib中调整误差条的粗细,以及与之相关的各种技巧和最佳实践。
1. 误差条的基本概念
误差条(Error bars)是数据可视化中用来表示测量或估计不确定性的图形元素。它们通常以线段或条形的形式出现在数据点周围,指示数据的可能变化范围。在科学研究、统计分析和数据报告中,误差条是非常重要的,因为它们提供了关于数据精确度和可靠性的关键信息。
在Matplotlib中,我们可以使用errorbar()函数来添加误差条。这个函数非常灵活,允许我们自定义误差条的各个方面,包括其粗细。
以下是一个基本的误差条示例:
import matplotlib.pyplot as plt
import numpy as np

x = np.linspace(0, 10, 50)
y = np.sin(x)
yerr = 0.1 + 0.2 * np.random.rand(len(x))

plt.figure(figsize=(10, 6))
plt.errorbar(x, y, yerr=yerr, fmt='o', label='Data with error bars')
plt.title('Basic Error Bar Plot - how2matplotlib.com')
plt.xlabel('X-axis')
plt.ylabel('Y-axis')
plt.legend()
plt.show()
Output:
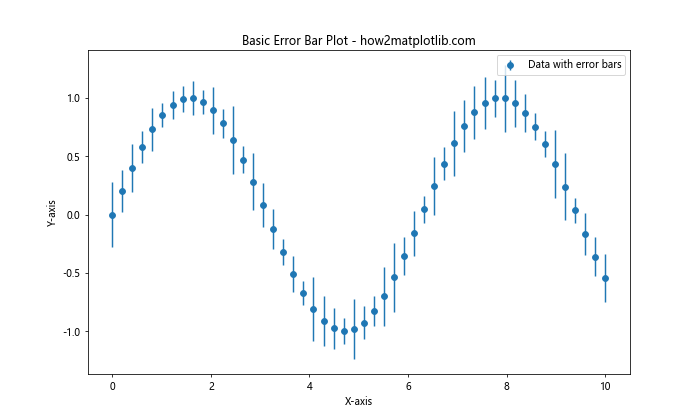
在这个例子中,我们创建了一个简单的正弦波数据集,并添加了随机的误差。errorbar()函数用于绘制数据点和相应的误差条。
2. 调整误差条的粗细
调整误差条的粗细是自定义误差条外观的重要方面。Matplotlib提供了多种方法来实现这一目标。
2.1 使用elinewidth参数
最直接的方法是使用errorbar()函数的elinewidth参数。这个参数控制误差条线段的宽度。
import matplotlib.pyplot as plt
import numpy as np

x = np.arange(1, 5)
y = np.exp(x)
yerr = 0.1 * y

plt.figure(figsize=(10, 6))
plt.errorbar(x, y, yerr=yerr, fmt='o', elinewidth=3, capsize=5, label='Thick error bars')
plt.title('Error Bars with Increased Thickness - how2matplotlib.com')
plt.xlabel('X-axis')
plt.ylabel('Y-axis')
plt.legend()
plt.show()
Output:
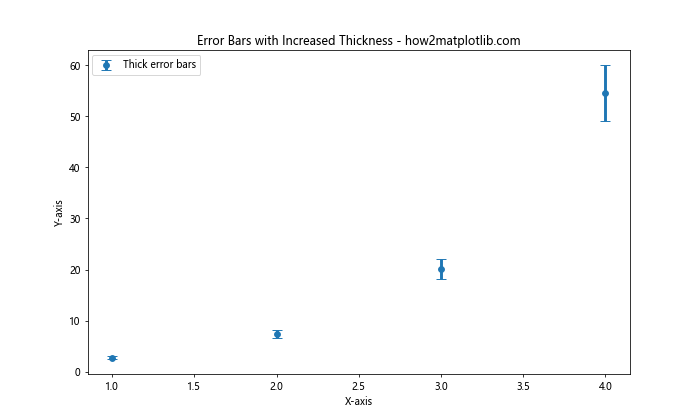
在这个例子中,我们将elinewidth设置为3,这会使误差条比默认值更粗。capsize参数用于设置误差条端点的大小。
2.2 使用errorevery参数减少误差条数量
有时,当数据点很多时,过多的误差条可能会使图表变得杂乱。使用errorevery参数可以控制显示误差条的频率,间接影响视觉上的粗细效果。
import matplotlib.pyplot as plt
import numpy as np

x = np.linspace(0, 10, 100)
y = np.sin(x)
yerr = 0.2 * np.random.rand(len(x))

plt.figure(figsize=(12, 6))
plt.errorbar(x, y, yerr=yerr, fmt='o', errorevery=10, capsize=3, label='Sparse error bars')
plt.title('Error Bars with Reduced Frequency - how2matplotlib.com')
plt.xlabel('X-axis')
plt.ylabel('Y-axis')
plt.legend()
plt.show()
Output:
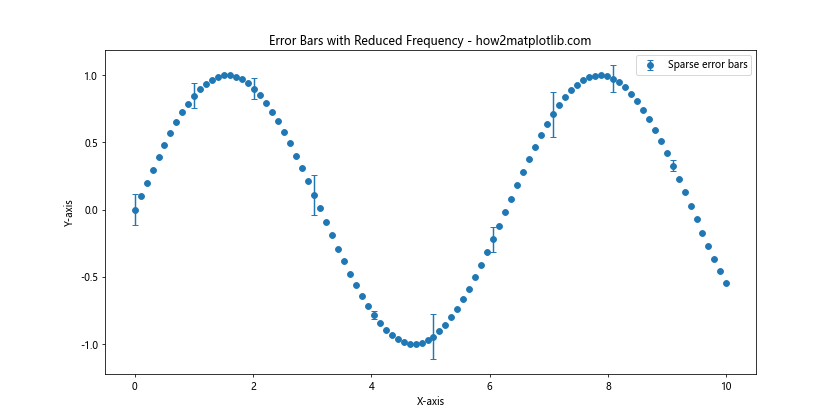
这个例子中,errorevery=10意味着每10个数据点才显示一个误差条,这样可以减少图表中误差条的数量,使其看起来不那么密集。
2.3 使用capthick参数调整端点粗细
误差条的端点(cap)也可以单独调整粗细,使用capthick参数:
import matplotlib.pyplot as plt
import numpy as np

x = np.arange(1, 6)
y = x ** 2
yerr = 0.1 * y

plt.figure(figsize=(10, 6))
plt.errorbar(x, y, yerr=yerr, fmt='o', elinewidth=2, capsize=10, capthick=4, label='Thick caps')
plt.title('Error Bars with Thick Caps - how2matplotlib.com')
plt.xlabel('X-axis')
plt.ylabel('Y-axis')
plt.legend()
plt.show()
Output:
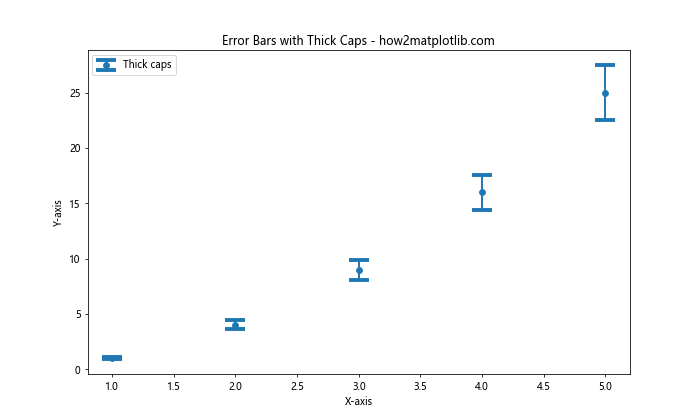
在这个例子中,我们将capthick设置为4,使误差条的端点比线段更粗。
3. 高级误差条自定义
除了基本的粗细调整,Matplotlib还提供了更多高级选项来自定义误差条的外观。
3.1 使用不同颜色的误差条
可以为误差条设置不同于数据点的颜色,以增强视觉对比:
import matplotlib.pyplot as plt
import numpy as np

x = np.linspace(0, 5, 10)
y = np.exp(-x)
yerr = 0.1 + 0.2 * np.random.rand(len(x))

plt.figure(figsize=(10, 6))
plt.errorbar(x, y, yerr=yerr, fmt='ro', ecolor='blue', elinewidth=3, capsize=5, label='Data')
plt.title('Error Bars with Different Color - how2matplotlib.com')
plt.xlabel('X-axis')
plt.ylabel('Y-axis')
plt.legend()
plt.show()
Output:
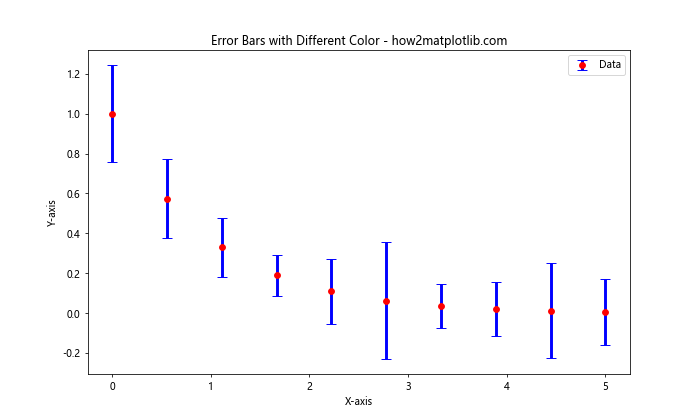
在这个例子中,我们使用ecolor参数将误差条的颜色设置为蓝色,而数据点保持红色。
3.2 asymmetric误差条
有时,上下误差可能不同。Matplotlib允许我们为上下误差分别指定值:
import matplotlib.pyplot as plt
import numpy as np

x = np.arange(1, 6)
y = np.log(x)
yerr = [0.1, 0.2, 0.3, 0.1, 0.2]  # 下误差
yerr_upper = [0.2, 0.3, 0.4, 0.2, 0.3]  # 上误差

plt.figure(figsize=(10, 6))
plt.errorbar(x, y, yerr=[yerr, yerr_upper], fmt='o', elinewidth=2, capsize=5, label='Asymmetric errors')
plt.title('Asymmetric Error Bars - how2matplotlib.com')
plt.xlabel('X-axis')
plt.ylabel('Y-axis')
plt.legend()
plt.show()
Output:
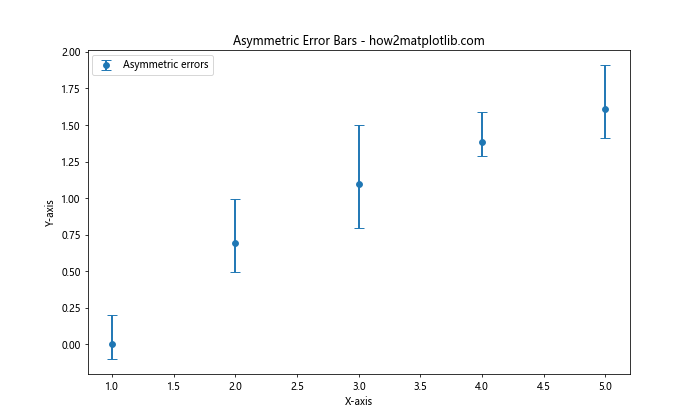
这个例子展示了如何创建不对称的误差条,上下误差值可以不同。
3.3 自定义误差条样式
我们可以使用ls(linestyle)参数来改变误差条的线型:
import matplotlib.pyplot as plt
import numpy as np

x = np.arange(1, 6)
y = x ** 1.5
yerr = 0.5 * np.sqrt(y)

plt.figure(figsize=(10, 6))
plt.errorbar(x, y, yerr=yerr, fmt='o', elinewidth=2, capsize=5, ls=':', label='Dotted error bars')
plt.title('Error Bars with Custom Line Style - how2matplotlib.com')
plt.xlabel('X-axis')
plt.ylabel('Y-axis')
plt.legend()
plt.show()
Output:
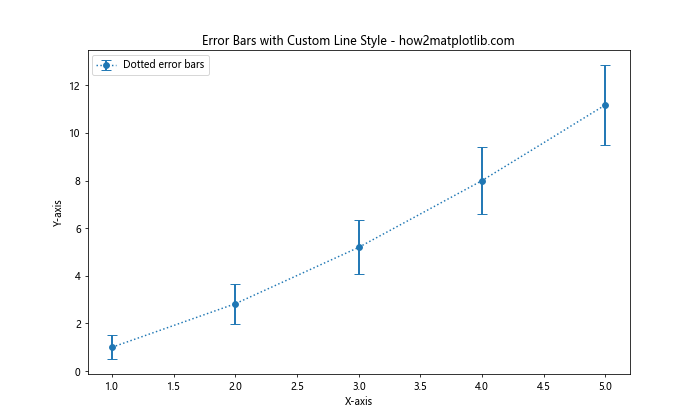
这个例子中,我们使用了点线样式(':')来绘制误差条。
4. 在复杂图表中使用误差条
误差条不仅可以用于简单的散点图,还可以与其他类型的图表结合使用。
4.1 在条形图中添加误差条
条形图是另一种常见的需要误差条的图表类型:
import matplotlib.pyplot as plt
import numpy as np

categories = ['A', 'B', 'C', 'D']
values = [3, 5, 2, 4]
error = [0.5, 0.7, 0.3, 0.6]

plt.figure(figsize=(10, 6))
plt.bar(categories, values, yerr=error, capsize=5, ecolor='red', alpha=0.7)
plt.title('Bar Chart with Error Bars - how2matplotlib.com')
plt.xlabel('Categories')
plt.ylabel('Values')
plt.show()
Output:
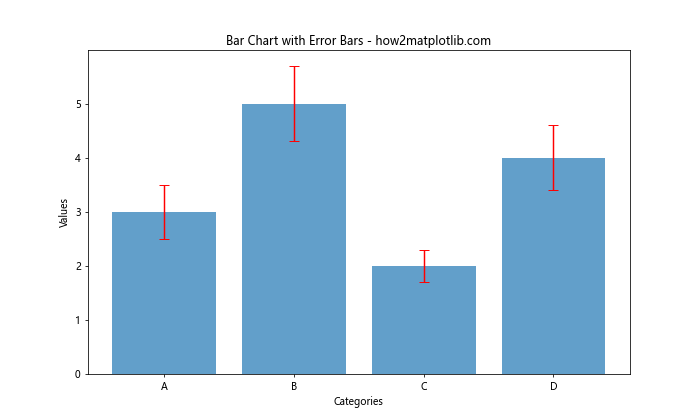
这个例子展示了如何在条形图中添加误差条,并使用ecolor参数设置误差条的颜色。
4.2 在折线图中添加误差条
折线图也经常需要误差条来表示数据的不确定性:
import matplotlib.pyplot as plt
import numpy as np

x = np.linspace(0, 10, 50)
y1 = np.sin(x)
y2 = np.cos(x)
yerr1 = 0.1 + 0.2 * np.random.rand(len(x))
yerr2 = 0.1 + 0.2 * np.random.rand(len(x))

plt.figure(figsize=(12, 6))
plt.errorbar(x, y1, yerr=yerr1, fmt='-o', elinewidth=2, capsize=3, label='sin(x)')
plt.errorbar(x, y2, yerr=yerr2, fmt='-s', elinewidth=2, capsize=3, label='cos(x)')
plt.title('Line Plot with Error Bars - how2matplotlib.com')
plt.xlabel('X-axis')
plt.ylabel('Y-axis')
plt.legend()
plt.show()
Output:
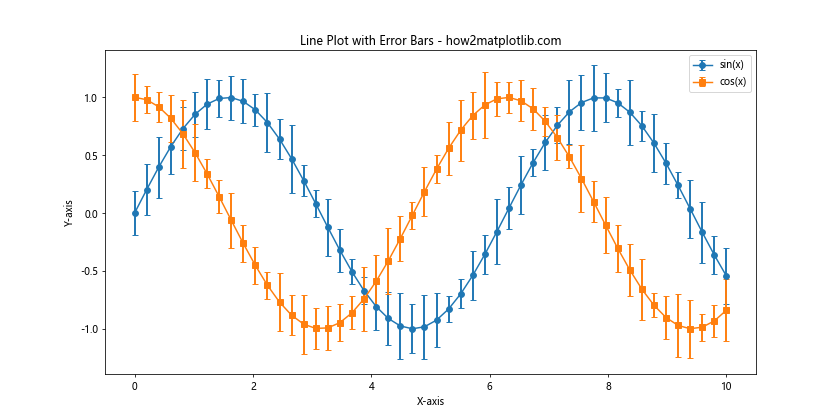
这个例子展示了如何在同一个图表中为多条折线添加误差条。
5. 误差条的统计意义
理解误差条的统计意义对于正确解释数据可视化结果至关重要。
5.1 标准误差
标准误差是样本均值的标准偏差的估计,通常用于表示样本均值的精确度:
import matplotlib.pyplot as plt
import numpy as np

np.random.seed(0)
x = np.arange(1, 6)
y = np.random.normal(10, 2, (5, 30))
yerr = np.std(y, axis=1) / np.sqrt(y.shape[1])

plt.figure(figsize=(10, 6))
plt.errorbar(x, np.mean(y, axis=1), yerr=yerr, fmt='o', capsize=5, label='Mean with SE')
plt.title('Error Bars Representing Standard Error - how2matplotlib.com')
plt.xlabel('X-axis')
plt.ylabel('Y-axis')
plt.legend()
plt.show()
Output:
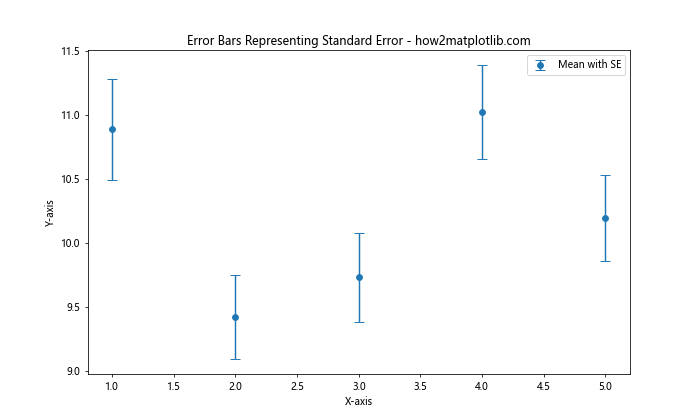
这个例子展示了如何计算并绘制标准误差作为误差条。
5.2 置信区间
置信区间提供了一个范围估计,表示真实参数值落在这个范围内的概率:
import matplotlib.pyplot as plt
import numpy as np
from scipy import stats

np.random.seed(0)
x = np.arange(1, 6)
y = np.random.normal(10, 2, (5, 30))
yerr = stats.t.ppf(0.975, df=y.shape[1]-1) * np.std(y, axis=1) / np.sqrt(y.shape[1])

plt.figure(figsize=(10, 6))
plt.errorbar(x, np.mean(y, axis=1), yerr=yerr, fmt='o', capsize=5, label='Mean with 95% CI')
plt.title('Error Bars Representing 95% Confidence Intervals - how2matplotlib.com')
plt.xlabel('X-axis')
plt.ylabel('Y-axis')
plt.legend()
plt.show()
Output:
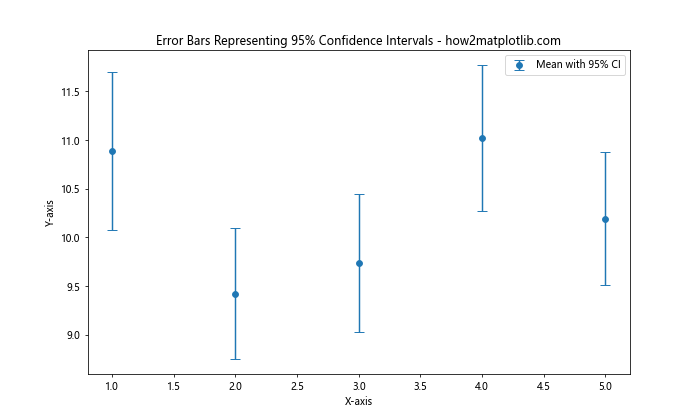
这个例子展示了如何计算并绘制95%置信区间作为误差条。
6. 误差条的最佳实践
在使用误差条时,有一些最佳实践可以帮助我们更有效地传达信息:
6.1 避免视觉混乱
当数据点很多时,显示所有点的误差条可能会导致图表变得混乱。在这种情况下,可以考虑使用errorevery参数或者只显示关键点的误差条:
import matplotlib.pyplot as plt
import numpy as np

x = np.linspace(0, 10, 100)
y = np.sin(x) + np.random.normal(0, 0.1, len(x))
yerr = np.random.uniform(0.05, 0.2, len(x))

plt.figure(figsize=(12, 6))
plt.errorbar(x, y, yerr=yerr, fmt='.', errorevery=10, capsize=3, alpha=0.7, label='Data')
plt.title('Sparse Error Bars to Avoid Clutter - how2matplotlib.com')
plt.xlabel('X-axis')
plt.ylabel('Y-axis')
plt.legend()
plt.show()
Output:
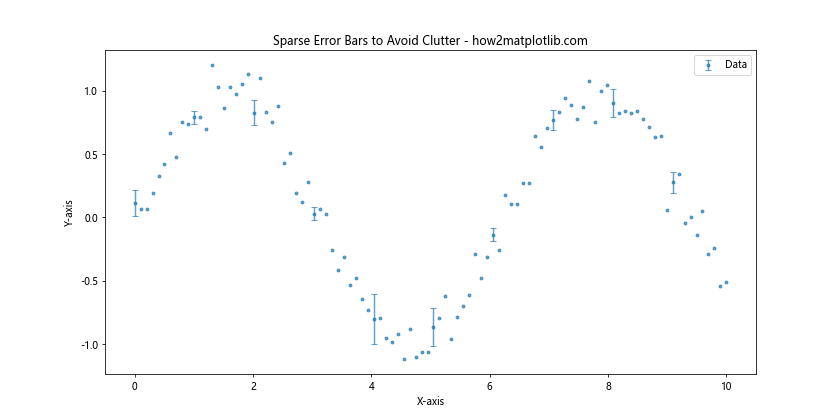
这个例子展示了如何使用errorevery参数来减少误差条的数量,从而避免视觉混乱。
6.2 合理选择误差条的大小
误差条的大小应该与数据的尺度相匹配。太小的误差条可能难以察觉,而太大的误差条可能会掩盖数据的趋势:
import matplotlib.pyplot as plt
import numpy as np

x = np.arange(1, 5)
y = np.exp(x)
yerr_small = 0.1 * y
yerr_large = 0.5 * y

fig, (ax1, ax2) = plt.subplots(1, 2, figsize=(15, 6))

ax1.errorbar(x, y, yerr=yerr_small, fmt='o', capsize=5, label='Small errors')
ax1.set_title('Small Error Bars - how2matplotlib.com')ax2.errorbar(x, y, yerr=yerr_large, fmt='o', capsize=5, label='Large errors')
ax2.set_title('Large Error Bars - how2matplotlib.com')

for ax in (ax1, ax2):
    ax.set_xlabel('X-axis')
    ax.set_ylabel('Y-axis')
    ax.legend()

plt.tight_layout()
plt.show()
这个例子对比了小误差条和大误差条的视觉效果,帮助我们理解如何选择合适的误差条大小。
6.3 使用颜色和透明度
适当使用颜色和透明度可以使误差条更加清晰,同时不会干扰主要数据的展示:
import matplotlib.pyplot as plt
import numpy as np

x = np.linspace(0, 10, 50)
y1 = np.sin(x)
y2 = np.cos(x)
yerr1 = 0.2 * np.random.rand(len(x))
yerr2 = 0.2 * np.random.rand(len(x))

plt.figure(figsize=(12, 6))
plt.errorbar(x, y1, yerr=yerr1, fmt='o', ecolor='lightblue', elinewidth=3, capsize=0, alpha=0.5, label='sin(x)')
plt.errorbar(x, y2, yerr=yerr2, fmt='s', ecolor='lightgreen', elinewidth=3, capsize=0, alpha=0.5, label='cos(x)')
plt.title('Error Bars with Color and Transparency - how2matplotlib.com')
plt.xlabel('X-axis')
plt.ylabel('Y-axis')
plt.legend()
plt.show()
Output:
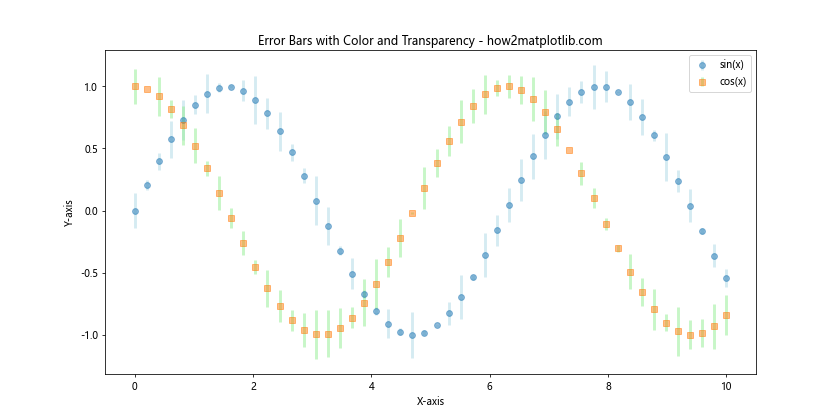
在这个例子中,我们使用了浅色和半透明的误差条,使其不会过分吸引注意力,同时仍然清晰可见。
7. 高级技巧和特殊情况
7.1 自定义误差条形状
有时,标准的误差条可能不足以表达特定类型的不确定性。在这种情况下,我们可以自定义误差条的形状:
import matplotlib.pyplot as plt
import numpy as np

x = np.arange(1, 5)
y = np.exp(x)
yerr = 0.2 * y

fig, ax = plt.subplots(figsize=(10, 6))

# 绘制数据点
ax.plot(x, y, 'ro', label='Data')

# 自定义误差条
for i in range(len(x)):
    ax.add_patch(plt.Rectangle((x[i]-0.2, y[i]-yerr[i]), 0.4, 2*yerr[i], fill=False, edgecolor='blue'))

ax.set_title('Custom Error Bar Shapes - how2matplotlib.com')
ax.set_xlabel('X-axis')
ax.set_ylabel('Y-axis')
ax.legend()
plt.show()
Output:
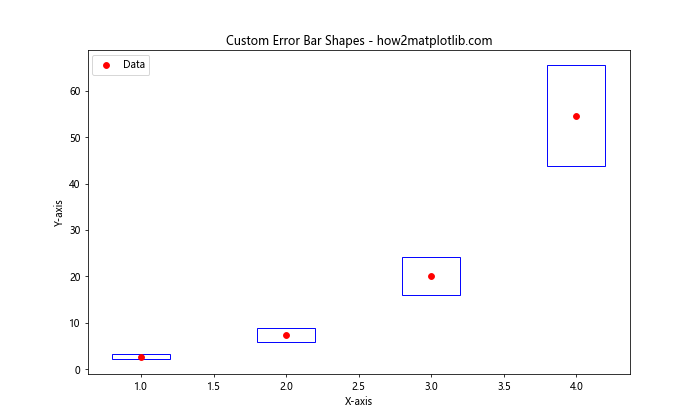
这个例子展示了如何使用矩形代替传统的线段来表示误差范围。
7.2 处理对数刻度
当使用对数刻度时,误差条的表示需要特别注意:
import matplotlib.pyplot as plt
import numpy as np

x = np.logspace(0, 2, 20)
y = np.exp(-x/10.0)
yerr = 0.1 * y

plt.figure(figsize=(10, 6))
plt.errorbar(x, y, yerr=yerr, fmt='o', elinewidth=2, capsize=5)
plt.xscale('log')
plt.yscale('log')
plt.title('Error Bars on Log Scale - how2matplotlib.com')
plt.xlabel('X-axis (log scale)')
plt.ylabel('Y-axis (log scale)')
plt.show()
Output:
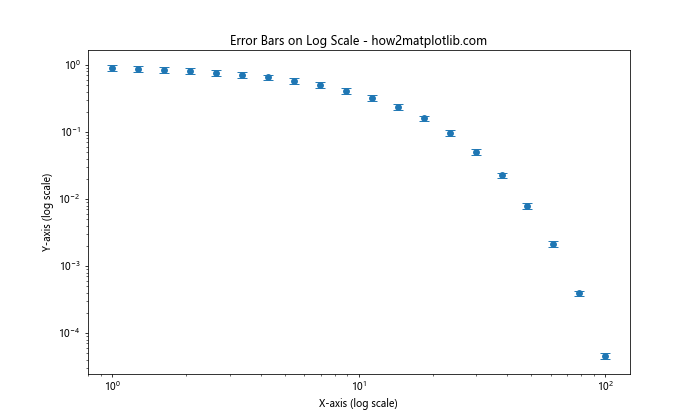
这个例子展示了如何在对数刻度上正确显示误差条。
7.3 3D图表中的误差条
虽然不太常见,但Matplotlib也支持在3D图表中添加误差条:
import matplotlib.pyplot as plt
import numpy as np
from mpl_toolkits.mplot3d import Axes3D

fig = plt.figure(figsize=(10, 8))
ax = fig.add_subplot(111, projection='3d')

x = np.arange(1, 5)
y = np.arange(2, 6)
z = x * y
zerr = 0.2 * z

ax.errorbar(x, y, z, zerr=zerr, fmt='o', ecolor='gray', capsize=5)
ax.set_title('3D Error Bars - how2matplotlib.com')
ax.set_xlabel('X-axis')
ax.set_ylabel('Y-axis')
ax.set_zlabel('Z-axis')
plt.show()
Output:
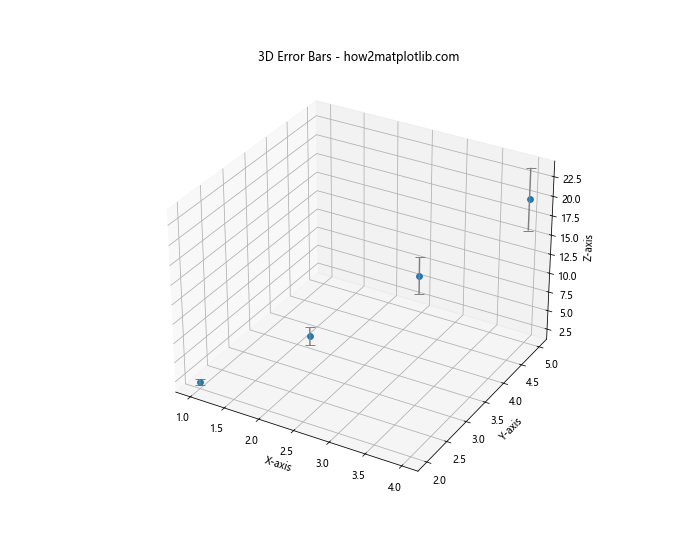
这个例子展示了如何在3D图表中添加误差条,这在某些科学可视化场景中可能会很有用。
8. 误差条与其他可视化技术的结合
误差条可以与其他可视化技术结合,以提供更丰富的数据表示。
8.1 误差条与填充区域
有时,使用填充区域代替传统的误差条可以更好地展示数据的不确定性范围:
import matplotlib.pyplot as plt
import numpy as np

x = np.linspace(0, 10, 50)
y = np.sin(x)
yerr = 0.2 + 0.1 * np.random.rand(len(x))

plt.figure(figsize=(12, 6))
plt.plot(x, y, 'r-', label='sin(x)')
plt.fill_between(x, y-yerr, y+yerr, alpha=0.3, label='Error range')
plt.title('Error Range as Filled Area - how2matplotlib.com')
plt.xlabel('X-axis')
plt.ylabel('Y-axis')
plt.legend()
plt.show()
Output:
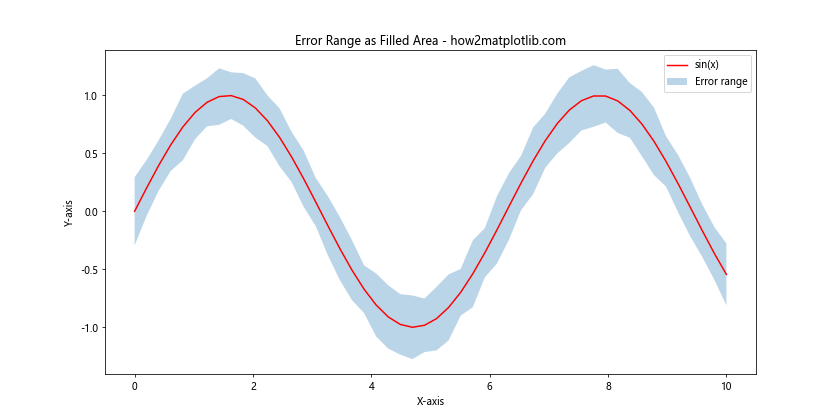
这个例子展示了如何使用fill_between()函数来创建一个表示误差范围的填充区域。
8.2 误差条与箱线图
箱线图是另一种展示数据分布的有效方式,可以与误差条结合使用:
import matplotlib.pyplot as plt
import numpy as np

np.random.seed(0)
data = [np.random.normal(0, std, 100) for std in range(1, 4)]

fig, (ax1, ax2) = plt.subplots(1, 2, figsize=(15, 6))

# 箱线图
ax1.boxplot(data)
ax1.set_title('Box Plot - how2matplotlib.com')

# 误差条
means = [np.mean(d) for d in data]
stds = [np.std(d) for d in data]
ax2.errorbar(range(1, 4), means, yerr=stds, fmt='o', capsize=5)
ax2.set_title('Error Bar Plot - how2matplotlib.com')

for ax in (ax1, ax2):
    ax.set_xlabel('Group')
    ax.set_ylabel('Value')

plt.tight_layout()
plt.show()
Output:
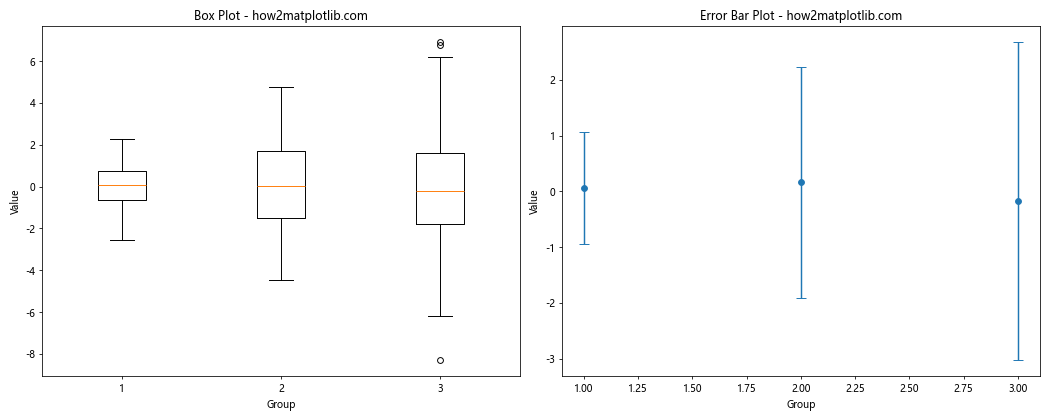
这个例子对比了箱线图和误差条图,两者都能展示数据的分布特征,但以不同的方式呈现。
9. 误差条在实际应用中的注意事项
在实际应用中使用误差条时,需要注意以下几点:
9.1 数据类型的考虑
不同类型的数据可能需要不同的误差表示方法。例如,计数数据可能更适合使用泊松分布的误差估计:
import matplotlib.pyplot as plt
import numpy as np

x = np.arange(1, 6)
y = np.array([5, 10, 4, 12, 8])
yerr = np.sqrt(y)  # 泊松分布的标准差

plt.figure(figsize=(10, 6))
plt.errorbar(x, y, yerr=yerr, fmt='o', capsize=5, label='Count data')
plt.title('Error Bars for Count Data - how2matplotlib.com')
plt.xlabel('Sample')
plt.ylabel('Count')
plt.legend()
plt.show()
Output:
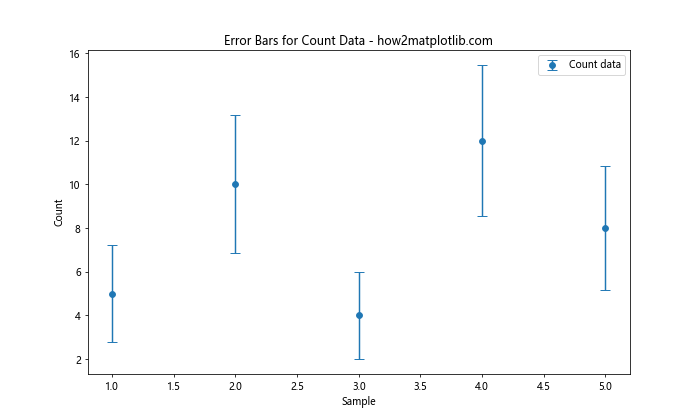
这个例子展示了如何为计数数据创建适当的误差条。
9.2 误差条的解释
在报告结果时,清楚地说明误差条代表什么(如标准差、标准误差、置信区间等)是非常重要的:
import matplotlib.pyplot as plt
import numpy as np
from scipy import stats

np.random.seed(0)
x = np.arange(1, 6)
y = np.random.normal(10, 2, (5, 30))

fig, (ax1, ax2) = plt.subplots(1, 2, figsize=(15, 6))

# 标准差
yerr_std = np.std(y, axis=1)
ax1.errorbar(x, np.mean(y, axis=1), yerr=yerr_std, fmt='o', capsize=5, label='Mean ± SD')
ax1.set_title('Error Bars: Standard Deviation - how2matplotlib.com')

# 95% 置信区间
yerr_ci = stats.t.ppf(0.975, df=y.shape[1]-1) * stats.sem(y, axis=1)
ax2.errorbar(x, np.mean(y, axis=1), yerr=yerr_ci, fmt='o', capsize=5, label='Mean ± 95% CI')
ax2.set_title('Error Bars: 95% Confidence Interval - how2matplotlib.com')

for ax in (ax1, ax2):
    ax.set_xlabel('Sample')
    ax.set_ylabel('Value')
    ax.legend()

plt.tight_layout()
plt.show()
Output:
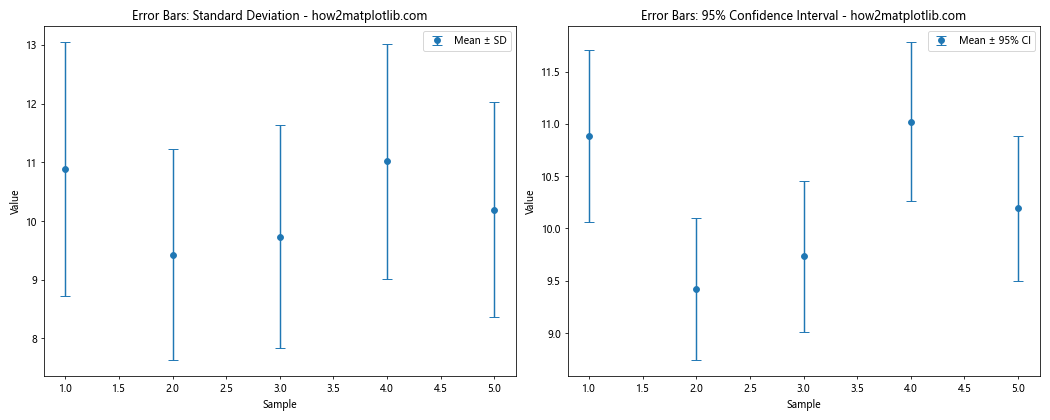
这个例子对比了使用标准差和95%置信区间作为误差条的不同效果。
10. 结论
调整误差条的粗细是数据可视化中的一个重要技巧。通过适当地设置误差条的粗细,我们可以增强数据的可读性,突出重要信息,同时避免视觉混乱。本文详细介绍了在Matplotlib中调整误差条粗细的多种方法,包括使用elinewidth参数、调整误差条的频率、自定义误差条的样式等。
我们还探讨了误差条的统计意义,以及如何在不同类型的图表中应用误差条。通过结合颜色、透明度和其他可视化技术,我们可以创建既美观又信息丰富的数据可视化。
在实际应用中,选择合适的误差表示方法,考虑数据类型的特性,并清晰地解释误差条的含义,都是至关重要的。通过掌握这些技巧,我们可以更有效地传达数据中的不确定性和变异性,从而帮助读者更好地理解和解释数据。
最后,记住数据可视化是一门艺术,需要不断实践和改进。通过灵活运用本文介绍的各种技巧,相信你可以创造出既准确又富有洞察力的数据图表。
 极客笔记
极客笔记