JavaScript 如何绘制一条直线和一条曲线的双线图
问题描述
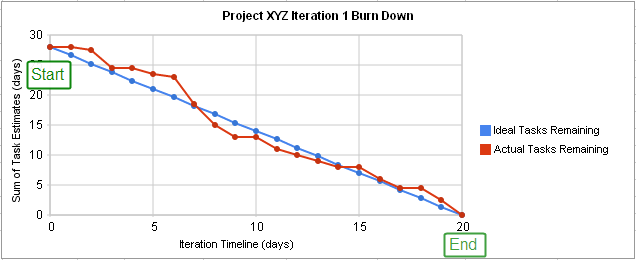
我想制作一个看起来像下面图片的图表

现在的问题是,我只有”理想任务剩余”的起始值2000和结束值0。我有”实际任务剩余”的所有值。这样的可视化在apex-chart或其他任何图表上是否可能?谢谢!
我已经尝试只给出起始值和结束值,但是直线不可见。其他的线都正常显示。
解决方案
也许这个方法会有所帮助。如果你知道”理想任务剩余”的起始和结束值,那么你可以计算出该直线的斜率和它在数据的每个x点上的y值。然后将这些数据传入图表中。下面是一个示例:
// Sample data
let days = [0, 1, 2, 3, 4, 5, 6, 7, 8, 9, 10]
let sums = [2000, 2557, 1146, 1833, 990, 1250, 268, 700, 800, 90, 0]

// When x is 0, y is 2000
let x1 = 0 //
let y1 = 2000

// At the last point of the data, y is 0 <-- Assumed from the example chart posted
let x2 = days.slice(-1)
let y2 = 0

// Calcuate the slope of the Ideal Tasks Remaining line
let slope = (y2 - y1) / (x2 - x1)

// Calculate the y values of Ideal Tasks Remaining at each x
let trend = days.map((x) => slope * x + y1)

// Make the chart
let options = {
  chart: { type: 'line' },
  markers: {
    size: 5
  },
  series: [
    {
      name: 'Actual Tasks Remaining',
      data: sums
    },
    { name: 'Ideal Tasks Remaining', data: trend }
  ],
  xaxis: {
    categories: days,
    title: {
      text: 'Itiration Timeline (days)'
    }
  },
  yaxis: {
    title: {
      text: 'Sum of Task Estimates (days)'
    }
  }
}

let chart = new ApexCharts(document.querySelector('#chart'), options)

chart.render()
<script src="https://cdn.jsdelivr.net/npm/apexcharts"></script>
<div id="chart"></div>
 极客笔记
极客笔记