Matplotlib绘制宽数据框:自定义颜色和线型的高级技巧
参考:Plotting a Wide DataFrame with Custom Colors and Linestyles
在数据可视化领域,Matplotlib是Python中最流行和强大的绘图库之一。当我们需要绘制包含多列数据的宽数据框(Wide DataFrame)时,自定义颜色和线型可以大大提升图表的可读性和美观度。本文将深入探讨如何使用Matplotlib绘制宽数据框,并着重介绍自定义颜色和线型的高级技巧。
1. 理解宽数据框
宽数据框是指每一行代表一个观察值,而每一列代表一个变量的数据结构。在数据可视化中,绘制宽数据框通常意味着我们需要在同一个图表中展示多个变量的趋势或关系。
示例代码:
import pandas as pd
import matplotlib.pyplot as plt

# 创建一个宽数据框
data = {
    'Date': pd.date_range(start='2023-01-01', periods=10),
    'A': [10, 12, 15, 14, 16, 18, 17, 20, 22, 25],
    'B': [5, 7, 8, 10, 12, 15, 14, 16, 18, 20],
    'C': [8, 9, 11, 13, 15, 14, 16, 18, 20, 22]
}
df = pd.DataFrame(data)
df.set_index('Date', inplace=True)

# 基本绘图
plt.figure(figsize=(10, 6))
df.plot(title='How2matplotlib.com: Wide DataFrame Plot')
plt.xlabel('Date')
plt.ylabel('Value')
plt.legend(title='Variables')
plt.show()
Output:
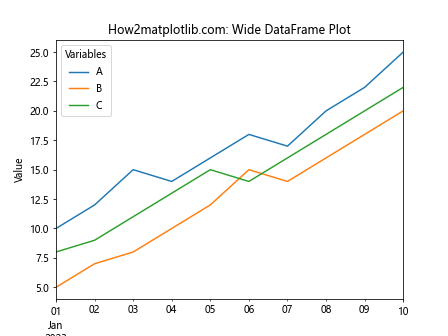
这个示例创建了一个包含三个变量(A、B、C)的宽数据框,并使用Matplotlib的基本绘图功能进行可视化。然而,这种基本绘图方法可能不足以清晰地展示复杂的数据关系。
2. 自定义颜色
自定义颜色是提升图表可读性的关键技巧之一。Matplotlib提供了多种方式来指定颜色,包括颜色名称、RGB值和十六进制代码。
示例代码:
import pandas as pd
import matplotlib.pyplot as plt

# 创建数据
df = pd.DataFrame({
    'Date': pd.date_range(start='2023-01-01', periods=10),
    'A': [10, 12, 15, 14, 16, 18, 17, 20, 22, 25],
    'B': [5, 7, 8, 10, 12, 15, 14, 16, 18, 20],
    'C': [8, 9, 11, 13, 15, 14, 16, 18, 20, 22]
})
df.set_index('Date', inplace=True)

# 自定义颜色
colors = ['#FF9999', '#66B2FF', '#99FF99']

plt.figure(figsize=(10, 6))
for column, color in zip(df.columns, colors):
    plt.plot(df.index, df[column], color=color, label=column)

plt.title('How2matplotlib.com: Custom Colors in Wide DataFrame Plot')
plt.xlabel('Date')
plt.ylabel('Value')
plt.legend(title='Variables')
plt.show()
Output:
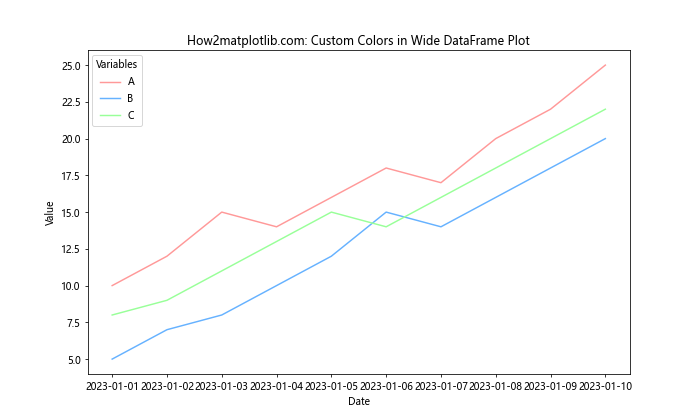
在这个示例中,我们为每个变量指定了自定义的颜色。使用十六进制颜色代码可以精确控制每条线的颜色,从而提高图表的视觉吸引力和可读性。
3. 自定义线型
除了颜色,线型也是区分不同数据系列的重要视觉元素。Matplotlib提供了多种线型选项,如实线、虚线、点线等。
示例代码:
import pandas as pd
import matplotlib.pyplot as plt

# 创建数据
df = pd.DataFrame({
    'Date': pd.date_range(start='2023-01-01', periods=10),
    'A': [10, 12, 15, 14, 16, 18, 17, 20, 22, 25],
    'B': [5, 7, 8, 10, 12, 15, 14, 16, 18, 20],
    'C': [8, 9, 11, 13, 15, 14, 16, 18, 20, 22]
})
df.set_index('Date', inplace=True)

# 自定义线型
linestyles = ['-', '--', '-.']

plt.figure(figsize=(10, 6))
for column, linestyle in zip(df.columns, linestyles):
    plt.plot(df.index, df[column], linestyle=linestyle, label=column)

plt.title('How2matplotlib.com: Custom Linestyles in Wide DataFrame Plot')
plt.xlabel('Date')
plt.ylabel('Value')
plt.legend(title='Variables')
plt.show()
Output:
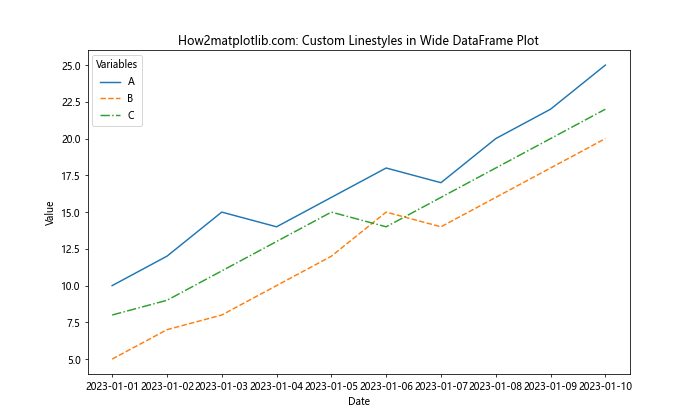
这个示例展示了如何为每个数据系列应用不同的线型。通过组合不同的线型,我们可以在不依赖颜色的情况下区分多个数据系列,这对于色盲用户或黑白打印特别有用。
4. 结合颜色和线型
为了最大化图表的可读性,我们可以同时自定义颜色和线型。这种方法特别适用于需要展示大量变量的复杂图表。
示例代码:
import pandas as pd
import matplotlib.pyplot as plt

# 创建更复杂的数据集
df = pd.DataFrame({
    'Date': pd.date_range(start='2023-01-01', periods=10),
    'A': [10, 12, 15, 14, 16, 18, 17, 20, 22, 25],
    'B': [5, 7, 8, 10, 12, 15, 14, 16, 18, 20],
    'C': [8, 9, 11, 13, 15, 14, 16, 18, 20, 22],
    'D': [15, 14, 13, 12, 11, 10, 12, 14, 16, 18],
    'E': [7, 9, 11, 13, 15, 17, 19, 21, 23, 25]
})
df.set_index('Date', inplace=True)

# 自定义颜色和线型
colors = ['#FF9999', '#66B2FF', '#99FF99', '#FFCC99', '#FF99CC']
linestyles = ['-', '--', '-.', ':', '-']

plt.figure(figsize=(12, 7))
for column, color, linestyle in zip(df.columns, colors, linestyles):
    plt.plot(df.index, df[column], color=color, linestyle=linestyle, label=column)

plt.title('How2matplotlib.com: Custom Colors and Linestyles in Wide DataFrame Plot')
plt.xlabel('Date')
plt.ylabel('Value')
plt.legend(title='Variables', loc='center left', bbox_to_anchor=(1, 0.5))
plt.tight_layout()
plt.show()
Output:
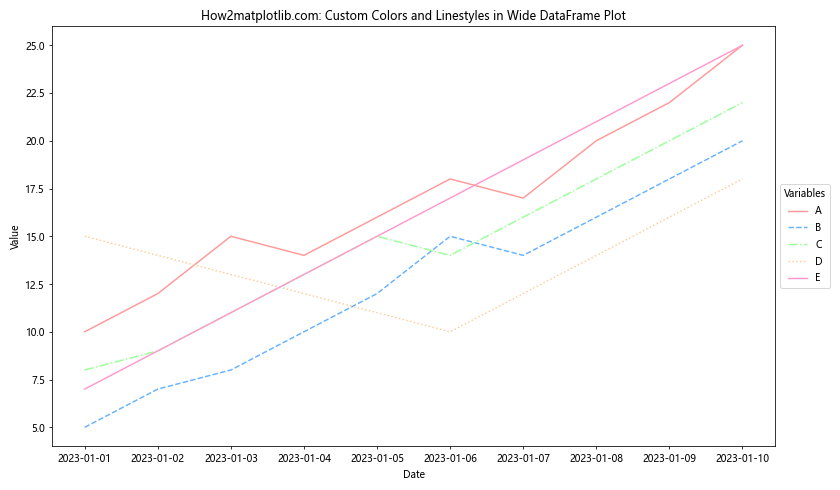
这个示例展示了如何同时使用自定义颜色和线型来区分多个数据系列。通过这种方法,即使在包含多个变量的复杂图表中,也能清晰地识别每个数据系列。
5. 使用颜色映射
对于包含大量变量的数据框,手动指定每个颜色可能会变得繁琐。在这种情况下,使用颜色映射(colormap)是一个更好的选择。
示例代码:
import pandas as pd
import matplotlib.pyplot as plt
import numpy as np

# 创建包含多个变量的数据框
columns = ['Var' + str(i) for i in range(10)]
df = pd.DataFrame(np.random.rand(20, 10), columns=columns, index=pd.date_range(start='2023-01-01', periods=20))

# 使用颜色映射
plt.figure(figsize=(12, 7))
cmap = plt.get_cmap('tab10')
for i, column in enumerate(df.columns):
    plt.plot(df.index, df[column], color=cmap(i / len(df.columns)), label=column)

plt.title('How2matplotlib.com: Using Colormap for Wide DataFrame Plot')
plt.xlabel('Date')
plt.ylabel('Value')
plt.legend(title='Variables', loc='center left', bbox_to_anchor=(1, 0.5))
plt.tight_layout()
plt.show()
Output:
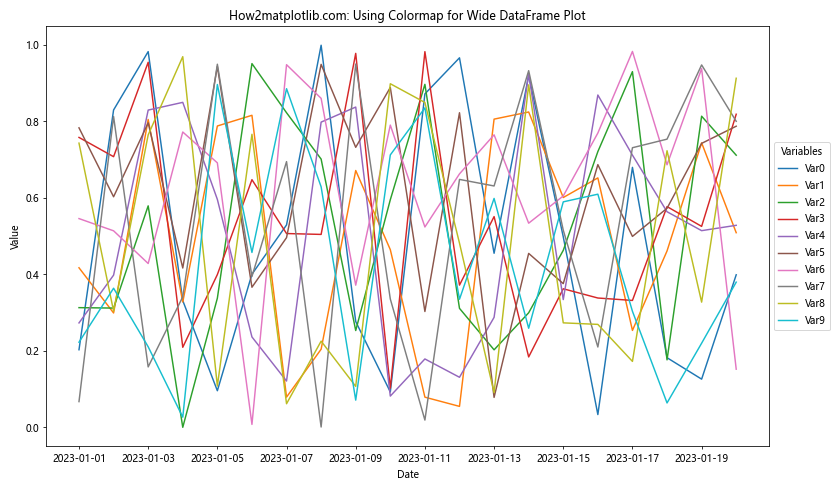
这个示例使用了’tab10’颜色映射来自动为每个变量分配颜色。这种方法特别适用于需要可视化大量变量的情况,因为它可以自动生成视觉上协调的颜色方案。
6. 分组绘制
当数据框中的变量可以分为不同的组时,我们可以使用分组绘制的方法来增强可视化效果。
示例代码:
import pandas as pd
import matplotlib.pyplot as plt

# 创建分组数据
df = pd.DataFrame({
    'Date': pd.date_range(start='2023-01-01', periods=10),
    'A1': [10, 12, 15, 14, 16, 18, 17, 20, 22, 25],
    'A2': [8, 10, 13, 12, 14, 16, 15, 18, 20, 23],
    'B1': [5, 7, 8, 10, 12, 15, 14, 16, 18, 20],
    'B2': [3, 5, 6, 8, 10, 13, 12, 14, 16, 18],
    'C1': [8, 9, 11, 13, 15, 14, 16, 18, 20, 22],
    'C2': [6, 7, 9, 11, 13, 12, 14, 16, 18, 20]
})
df.set_index('Date', inplace=True)

# 定义组和颜色
groups = {'A': ['A1', 'A2'], 'B': ['B1', 'B2'], 'C': ['C1', 'C2']}
colors = {'A': '#FF9999', 'B': '#66B2FF', 'C': '#99FF99'}

plt.figure(figsize=(12, 7))
for group, vars in groups.items():
    for var in vars:
        plt.plot(df.index, df[var], color=colors[group], label=var,
                 linestyle='-' if var.endswith('1') else '--')

plt.title('How2matplotlib.com: Grouped Plot of Wide DataFrame')
plt.xlabel('Date')
plt.ylabel('Value')
plt.legend(title='Variables', loc='center left', bbox_to_anchor=(1, 0.5))
plt.tight_layout()
plt.show()
Output:
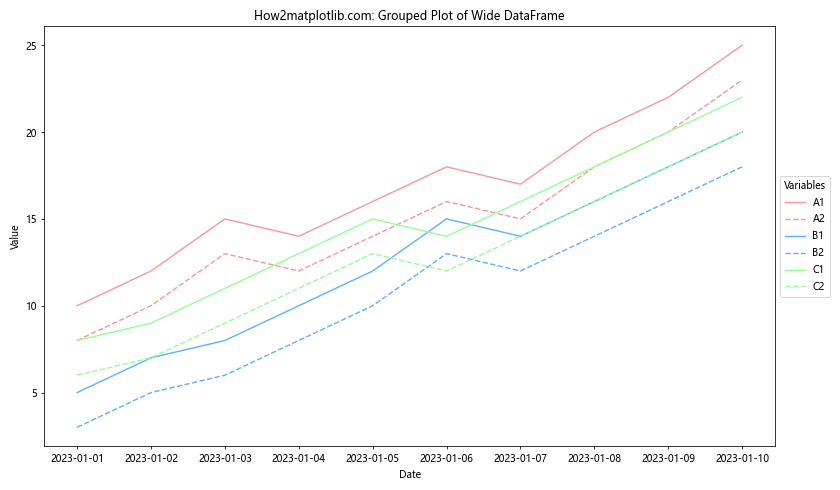
这个示例展示了如何将相关的变量分组,并使用相同的颜色但不同的线型来区分同组内的不同变量。这种方法可以有效地展示变量之间的关系和组间的差异。
7. 使用标记
除了线型和颜色,添加标记也是区分数据系列的有效方法,特别是当数据点较少时。
示例代码:
import pandas as pd
import matplotlib.pyplot as plt

# 创建数据
df = pd.DataFrame({
    'Date': pd.date_range(start='2023-01-01', periods=5),
    'A': [10, 12, 15, 14, 16],
    'B': [5, 7, 8, 10, 12],
    'C': [8, 9, 11, 13, 15]
})
df.set_index('Date', inplace=True)

# 定义标记
markers = ['o', 's', '^']

plt.figure(figsize=(10, 6))
for column, marker in zip(df.columns, markers):
    plt.plot(df.index, df[column], marker=marker, label=column, linestyle='-', markersize=8)

plt.title('How2matplotlib.com: Using Markers in Wide DataFrame Plot')
plt.xlabel('Date')
plt.ylabel('Value')
plt.legend(title='Variables')
plt.grid(True, linestyle='--', alpha=0.7)
plt.show()
Output:
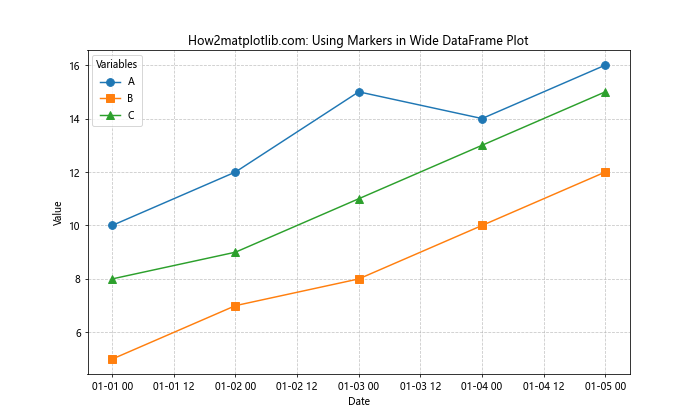
这个示例为每个数据系列添加了不同的标记。使用标记可以突出显示实际的数据点,这在数据点较少或需要强调特定点时特别有用。
8. 双轴图表
当数据框中的变量具有不同的数量级时,使用双轴图表可以更好地展示它们的关系。
示例代码:
import pandas as pd
import matplotlib.pyplot as plt

# 创建具有不同数量级的数据
df = pd.DataFrame({
    'Date': pd.date_range(start='2023-01-01', periods=10),
    'A': [100, 120, 150, 140, 160, 180, 170, 200, 220, 250],
    'B': [5, 7, 8, 10, 12, 15, 14, 16, 18, 20]
})
df.set_index('Date', inplace=True)

fig, ax1 = plt.subplots(figsize=(10, 6))

color1 = '#FF9999'
color2 = '#66B2FF'

ax1.set_xlabel('Date')
ax1.set_ylabel('A', color=color1)
ax1.plot(df.index, df['A'], color=color1)
ax1.tick_params(axis='y', labelcolor=color1)

ax2 = ax1.twinx()
ax2.set_ylabel('B', color=color2)
ax2.plot(df.index, df['B'], color=color2)
ax2.tick_params(axis='y', labelcolor=color2)

plt.title('How2matplotlib.com: Dual Axis Plot for Wide DataFrame')
fig.tight_layout()
plt.show()
Output:
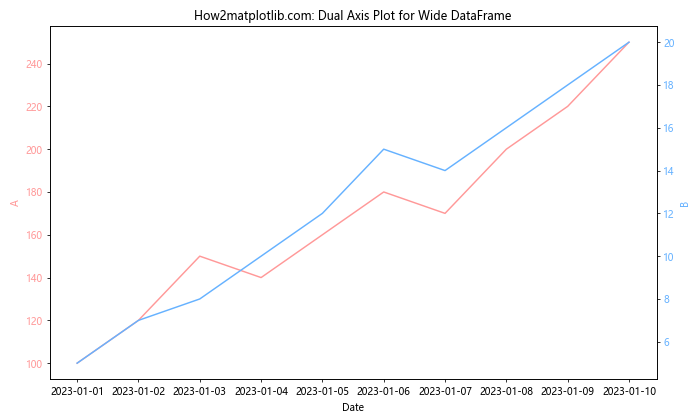
这个示例创建了一个双轴图表,左侧Y轴表示变量A,右侧Y轴表示变量B。这种方法允许我们在同一图表中比较具有不同数量级的变量。
9. 堆叠面积图
对于某些类型的数据,堆叠面积图可以有效地展示各个变量的组成和变化。
示例代码:
import pandas as pd
import matplotlib.pyplot as plt

# 创建数据
df = pd.DataFrame({
    'Date': pd.date_range(start='2023-01-01', periods=10),
    'A': [10, 12, 15, 14, 16, 18, 17, 20, 22, 25],
    'B': [5, 7, 8, 10, 12, 15, 14, 16, 18, 20],
    'C': [8, 9, 11, 13, 15, 14, 16, 18, 20, 22]
})
df.set_index('Date', inplace=True)

plt.figure(figsize=(10, 6))
plt.stackplot(df.index, df['A'], df['B'], df['C'],
              labels=['A', 'B', 'C'],
              colors=['#FF9999', '#66B2FF', '#99FF99'])

plt.title('How2matplotlib.com: Stacked Area Plot for Wide DataFrame')
plt.xlabel('Date')
plt.ylabel('Value')
plt.legend(loc='upper left')
plt.show()
Output:
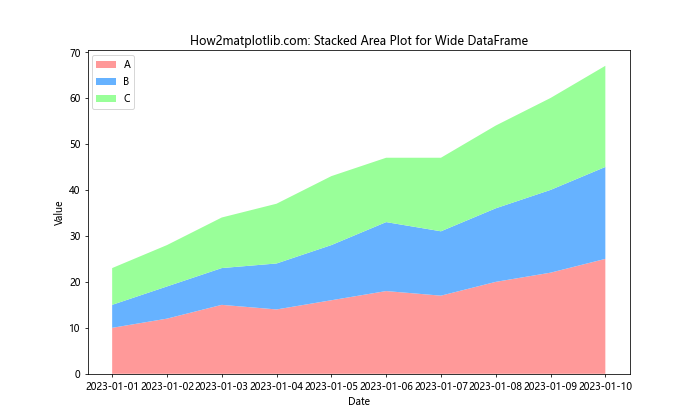
这个示例创建了一个堆叠面积图,展示了三个变量随时间的变化和累积效果。这种图表特别适合展示部分与整体的关系。
10. 使用样式表
Matplotlib提供了多种预定义的样式表,可以快速改变图表的整体外观。
示例代码:
import pandas as pd
import matplotlib.pyplot as plt

# 创建数据
df = pd.DataFrame({
    'Date': pd.date_range(start='2023-01-01', periods=10),
    'A': [10, 12, 15, 14, 16, 18, 17, 20, 22, 25],
    'B': [5, 7, 8, 10, 12, 15, 14, 16, 18, 20],
    'C': [8, 9, 11, 13, 15, 14, 16, 18, 20, 22]
})
df.set_index('Date', inplace=True)

# 使用'seaborn'样式
plt.style.use('seaborn')

plt.figure(figsize=(10, 6))
for column in df.columns:
    plt.plot(df.index, df[column], label=column)

plt.title('How2matplotlib.com: Using Seaborn Style for Wide DataFrame Plot')
plt.xlabel('Date')
plt.ylabel('Value')
plt.legend(title='Variables')
plt.show()
这个示例使用了’seaborn’样式,它提供了一个更现代和美观的外观。使用预定义的样式表可以快速改善图表的视觉效果,而无需手动调整多个参数。
11. 自定义图例
对于包含多个变量的图表,合理布置图例可以大大提高可读性。
示例代码:
import pandas as pd
import matplotlib.pyplot as plt

# 创建数据
df = pd.DataFrame({
    'Date': pd.date_range(start='2023-01-01', periods=10),
    'A': [10, 12, 15, 14, 16, 18, 17, 20, 22, 25],
    'B': [5, 7, 8, 10, 12, 15, 14, 16, 18, 20],
    'C': [8, 9, 11, 13, 15, 14, 16, 18, 20, 22],
    'D': [15, 14, 13, 12, 11, 10, 12, 14, 16, 18],
    'E': [7, 9, 11, 13, 15, 17, 19, 21, 23, 25]
})
df.set_index('Date', inplace=True)

plt.figure(figsize=(12, 7))
for column in df.columns:
    plt.plot(df.index, df[column], label=column)

plt.title('How2matplotlib.com: Custom Legend for Wide DataFrame Plot')
plt.xlabel('Date')
plt.ylabel('Value')

# 自定义图例
plt.legend(title='Variables', loc='center left', bbox_to_anchor=(1, 0.5),
           fancybox=True, shadow=True, ncol=1)

plt.tight_layout()
plt.show()
Output:
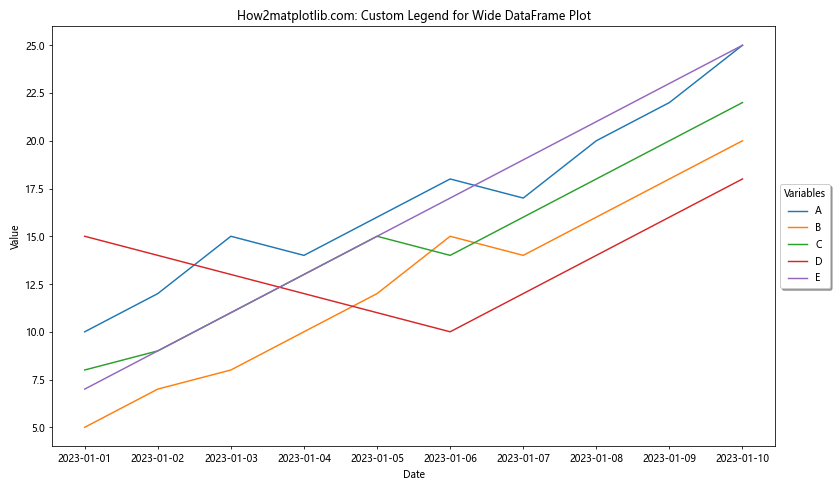
这个示例展示了如何自定义图例的位置和样式。将图例放置在图表外部可以避免遮挡数据,而使用阴影和边框可以使图例更加突出。
12. 添加注释
在复杂的图表中,添加注释可以帮助读者更好地理解数据的特定特征或重要点。
示例代码:
import pandas as pd
import matplotlib.pyplot as plt

# 创建数据
df = pd.DataFrame({
    'Date': pd.date_range(start='2023-01-01', periods=10),
    'A': [10, 12, 15, 14, 16, 18, 17, 20, 22, 25],
    'B': [5, 7, 8, 10, 12, 15, 14, 16, 18, 20],
    'C': [8, 9, 11, 13, 15, 14, 16, 18, 20, 22]
})
df.set_index('Date', inplace=True)

plt.figure(figsize=(12, 7))
for column in df.columns:
    plt.plot(df.index, df[column], label=column)

plt.title('How2matplotlib.com: Annotated Wide DataFrame Plot')
plt.xlabel('Date')
plt.ylabel('Value')
plt.legend(title='Variables')

# 添加注释
plt.annotate('Peak value', xy=(df.index[7], df['A'][7]),
             xytext=(10, 10), textcoords='offset points',
             arrowprops=dict(arrowstyle='->', connectionstyle='arc3,rad=0.2'))

plt.tight_layout()
plt.show()
Output:
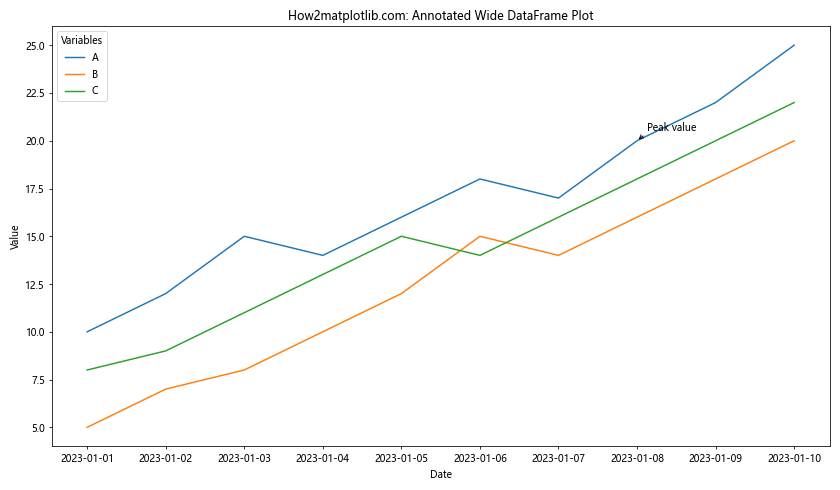
这个示例在图表中添加了一个注释,指出了一个特定的数据点。注释可以用来强调重要的趋势、异常值或其他值得注意的特征。
13. 使用填充区域
填充区域可以用来强调某些数据范围或展示数据的不确定性。
示例代码:
import pandas as pd
import matplotlib.pyplot as plt
import numpy as np

# 创建数据
df = pd.DataFrame({
    'Date': pd.date_range(start='2023-01-01', periods=10),
    'A': [10, 12, 15, 14, 16, 18, 17, 20, 22, 25],
    'B': [5, 7, 8, 10, 12, 15, 14, 16, 18, 20]
})
df.set_index('Date', inplace=True)

# 创建上下限
df['A_upper'] = df['A'] + 2
df['A_lower'] = df['A'] - 2

plt.figure(figsize=(10, 6))
plt.plot(df.index, df['A'], label='A', color='#FF9999')
plt.plot(df.index, df['B'], label='B', color='#66B2FF')
plt.fill_between(df.index, df['A_lower'], df['A_upper'], alpha=0.2, color='#FF9999')

plt.title('How2matplotlib.com: Wide DataFrame Plot with Filled Area')
plt.xlabel('Date')
plt.ylabel('Value')
plt.legend(title='Variables')
plt.show()
Output:
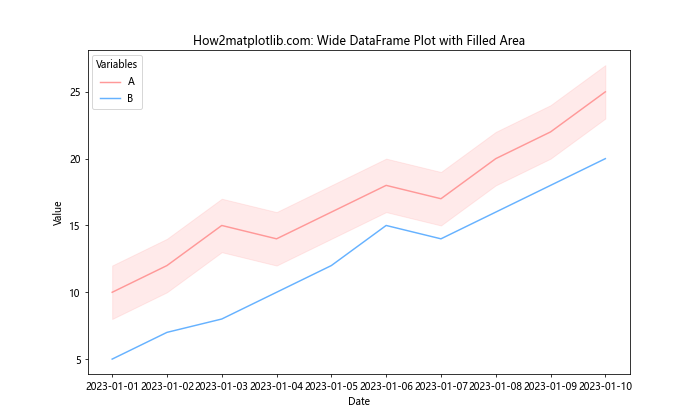
这个示例为变量A添加了一个填充区域,表示数据的可能范围或不确定性。这种技术对于展示置信区间或数据的变化范围特别有用。
14. 使用网格线
添加网格线可以帮助读者更准确地解读数据值。
示例代码:
import pandas as pd
import matplotlib.pyplot as plt

# 创建数据
df = pd.DataFrame({
    'Date': pd.date_range(start='2023-01-01', periods=10),
    'A': [10, 12, 15, 14, 16, 18, 17, 20, 22, 25],
    'B': [5, 7, 8, 10, 12, 15, 14, 16, 18, 20],
    'C': [8, 9, 11, 13, 15, 14, 16, 18, 20, 22]
})
df.set_index('Date', inplace=True)

plt.figure(figsize=(10, 6))
for column in df.columns:
    plt.plot(df.index, df[column], label=column)

plt.title('How2matplotlib.com: Wide DataFrame Plot with Grid')
plt.xlabel('Date')
plt.ylabel('Value')
plt.legend(title='Variables')

plt.grid(True, linestyle='--', alpha=0.7)
plt.show()
Output:
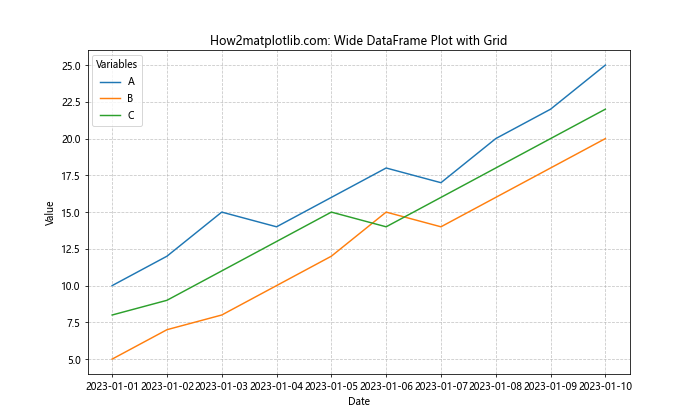
这个示例添加了网格线,使得读取具体数值变得更加容易。通过调整网格线的样式和透明度,我们可以在提高可读性的同时保持图表的美观。
15. 使用子图
当需要比较多个相关但独立的数据集时,使用子图是一个很好的选择。
示例代码:
import pandas as pd
import matplotlib.pyplot as plt

# 创建数据
df1 = pd.DataFrame({
    'Date': pd.date_range(start='2023-01-01', periods=10),
    'A': [10, 12, 15, 14, 16, 18, 17, 20, 22, 25],
    'B': [5, 7, 8, 10, 12, 15, 14, 16, 18, 20]
})
df1.set_index('Date', inplace=True)

df2 = pd.DataFrame({
    'Date': pd.date_range(start='2023-01-01', periods=10),
    'C': [8, 9, 11, 13, 15, 14, 16, 18, 20, 22],
    'D': [15, 14, 13, 12, 11, 10, 12, 14, 16, 18]
})
df2.set_index('Date', inplace=True)

fig, (ax1, ax2) = plt.subplots(2, 1, figsize=(10, 10), sharex=True)

df1.plot(ax=ax1)
ax1.set_title('How2matplotlib.com: Dataset 1')
ax1.set_ylabel('Value')
ax1.legend(title='Variables')

df2.plot(ax=ax2)
ax2.set_title('How2matplotlib.com: Dataset 2')
ax2.set_xlabel('Date')
ax2.set_ylabel('Value')
ax2.legend(title='Variables')

plt.tight_layout()
plt.show()
Output:
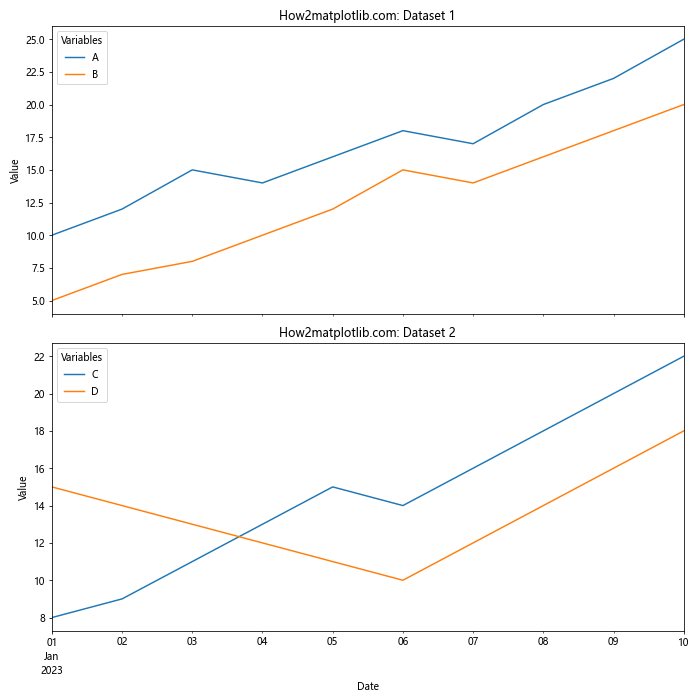
这个示例创建了两个子图,每个子图显示不同的数据集。这种方法允许我们在一个图形中比较多个相关但独立的数据集。
结论
通过本文的详细探讨,我们深入了解了如何使用Matplotlib绘制宽数据框,并掌握了自定义颜色和线型的高级技巧。从基本的绘图开始,我们逐步学习了如何使用自定义颜色、线型、标记等元素来增强图表的可读性和美观度。我们还探讨了更高级的技术,如使用颜色映射、创建双轴图表、堆叠面积图等,以应对更复杂的数据可视化需求。
重要的是要记住,数据可视化不仅仅是about美观,更是about有效地传达信息。在选择颜色、线型和其他视觉元素时,应始终考虑您的目标受众和要传达的关键信息。通过恰当地运用这些技巧,您可以创建既美观又信息丰富的图表,有效地展示复杂的数据关系和趋势。
最后,Matplotlib的灵活性意味着还有更多可以探索的技巧和方法。随着您继续深入学习和实践,您将能够创建更加复杂和定制化的数据可视化作品,以满足各种数据分析和展示需求。
 极客笔记
极客笔记