Matplotlib中在同一图表上放置两个不同图例的详细指南
参考:Placing Two Different Legends on the Same Graph With Matplotlib
Matplotlib是Python中强大的数据可视化库,它提供了丰富的功能来创建各种类型的图表。在数据可视化过程中,我们经常需要在同一张图表上展示多组数据,并为每组数据添加相应的图例。有时,这些数据可能需要不同的图例来更好地解释。本文将详细介绍如何在Matplotlib中在同一图表上放置两个不同的图例,以及相关的技巧和注意事项。
1. 为什么需要两个图例?
在某些情况下,我们可能需要在同一张图表上放置两个不同的图例。这通常发生在以下场景:
- 展示多组相关但不同类型的数据
- 比较不同数据集的特征
- 显示主要和次要信息
- 区分不同的数据分类方法
使用两个图例可以让我们更灵活地组织和展示复杂的数据关系,提高图表的可读性和信息传递效率。
2. Matplotlib中创建基本图表
在开始学习如何添加两个图例之前,让我们先回顾一下如何使用Matplotlib创建基本图表。以下是一个简单的示例:
import matplotlib.pyplot as plt
import numpy as np

# 生成数据
x = np.linspace(0, 10, 100)
y1 = np.sin(x)
y2 = np.cos(x)

# 创建图表
plt.figure(figsize=(10, 6))
plt.plot(x, y1, label='Sin')
plt.plot(x, y2, label='Cos')

# 添加标题和轴标签
plt.title('Sin and Cos Functions - how2matplotlib.com')
plt.xlabel('X axis')
plt.ylabel('Y axis')

# 添加图例
plt.legend()

# 显示图表
plt.show()
Output:
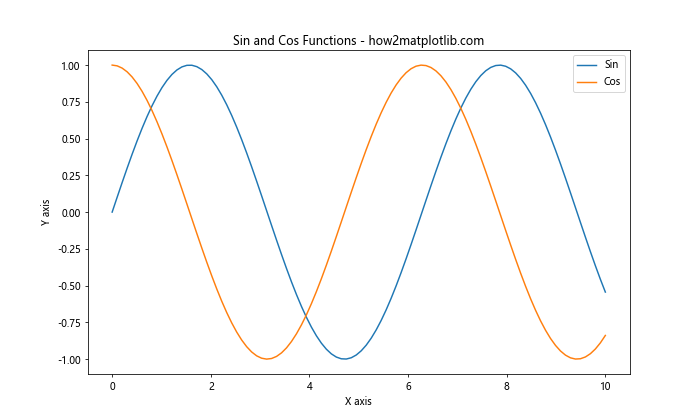
这个示例创建了一个包含正弦和余弦函数的简单图表,并添加了一个基本的图例。接下来,我们将学习如何在这个基础上添加第二个图例。
3. 在同一图表上添加两个图例的基本方法
要在同一图表上添加两个图例,我们可以使用Matplotlib的legend()函数多次。以下是一个基本示例:
import matplotlib.pyplot as plt
import numpy as np

# 生成数据
x = np.linspace(0, 10, 100)
y1 = np.sin(x)
y2 = np.cos(x)
y3 = np.tan(x)
y4 = x**2

# 创建图表
fig, ax = plt.subplots(figsize=(12, 8))

# 绘制曲线
line1, = ax.plot(x, y1, 'r-', label='Sin')
line2, = ax.plot(x, y2, 'b-', label='Cos')
line3, = ax.plot(x, y3, 'g-', label='Tan')
line4, = ax.plot(x, y4, 'm-', label='X^2')

# 添加第一个图例
legend1 = ax.legend(handles=[line1, line2], loc='upper left', title='Trigonometric Functions')

# 添加第二个图例
ax.add_artist(legend1)  # 确保第一个图例不被覆盖
legend2 = ax.legend(handles=[line3, line4], loc='upper right', title='Other Functions')

# 添加标题和轴标签
ax.set_title('Multiple Functions with Two Legends - how2matplotlib.com')
ax.set_xlabel('X axis')
ax.set_ylabel('Y axis')

# 显示图表
plt.show()
Output:
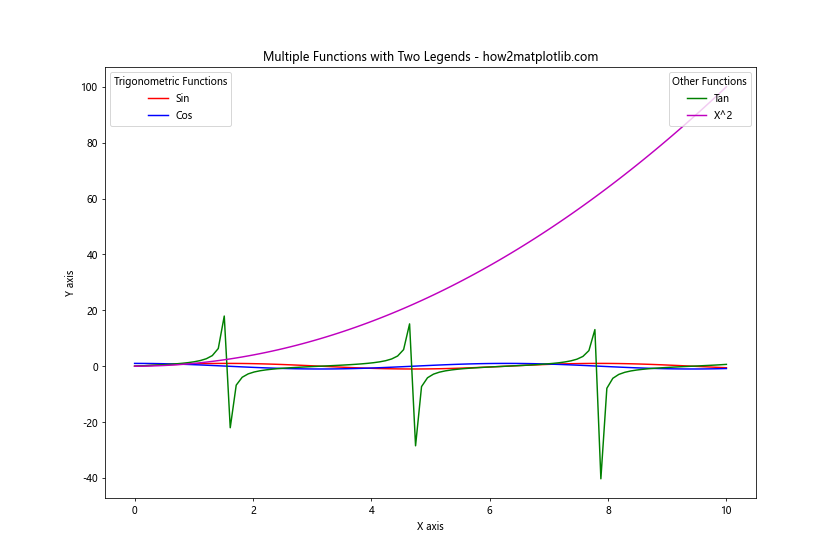
在这个示例中,我们使用ax.legend()创建了第一个图例,然后使用ax.add_artist()将其添加到图表中。接着,我们再次调用ax.legend()创建第二个图例。这样,我们就成功地在同一图表上放置了两个不同的图例。
4. 自定义图例的位置和样式
Matplotlib提供了多种方法来自定义图例的位置和样式。以下是一些常用的技巧:
4.1 调整图例位置
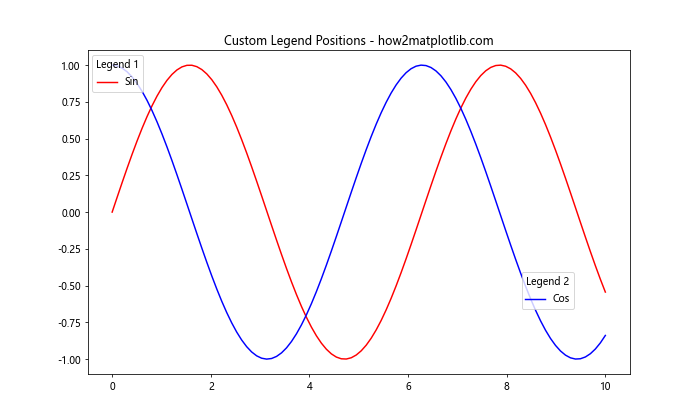
我们可以使用loc参数来指定图例的位置。Matplotlib提供了多个预定义的位置,如’upper left’、’lower right’等。我们也可以使用数字来精确定位图例。
import matplotlib.pyplot as plt
import numpy as np

x = np.linspace(0, 10, 100)
y1 = np.sin(x)
y2 = np.cos(x)

fig, ax = plt.subplots(figsize=(10, 6))

line1, = ax.plot(x, y1, 'r-', label='Sin')
line2, = ax.plot(x, y2, 'b-', label='Cos')

# 使用预定义位置
legend1 = ax.legend(handles=[line1], loc='upper left', title='Legend 1')

# 使用精确坐标
ax.add_artist(legend1)
legend2 = ax.legend(handles=[line2], loc=(0.8, 0.2), title='Legend 2')

ax.set_title('Custom Legend Positions - how2matplotlib.com')
plt.show()
Output:
4.2 调整图例样式
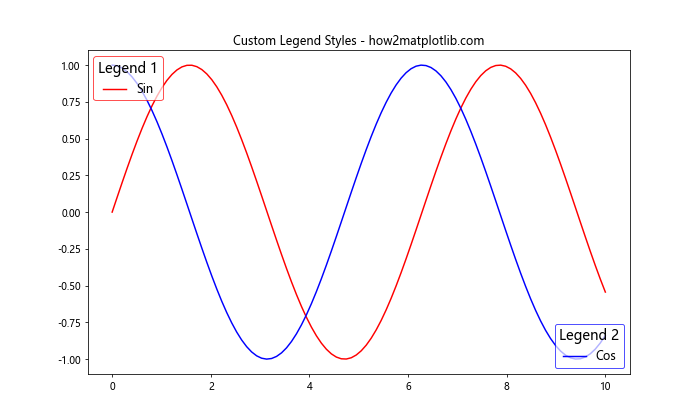
我们可以通过设置各种参数来自定义图例的样式,包括字体大小、边框颜色、背景色等。
import matplotlib.pyplot as plt
import numpy as np

x = np.linspace(0, 10, 100)
y1 = np.sin(x)
y2 = np.cos(x)

fig, ax = plt.subplots(figsize=(10, 6))

line1, = ax.plot(x, y1, 'r-', label='Sin')
line2, = ax.plot(x, y2, 'b-', label='Cos')

legend1 = ax.legend(handles=[line1], loc='upper left', title='Legend 1',
                    fontsize=12, fancybox=True, framealpha=0.7,
                    edgecolor='red', title_fontsize=14)

ax.add_artist(legend1)
legend2 = ax.legend(handles=[line2], loc='lower right', title='Legend 2',
                    fontsize=12, fancybox=True, framealpha=0.7,
                    edgecolor='blue', title_fontsize=14)

ax.set_title('Custom Legend Styles - how2matplotlib.com')
plt.show()
Output:
5. 处理重叠图例
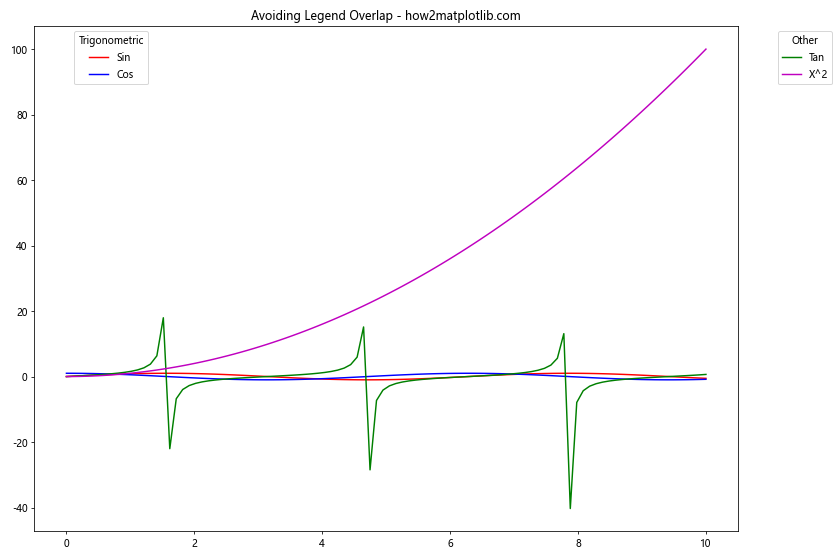
当我们在图表上放置两个图例时,可能会遇到图例重叠的问题。以下是一些解决方法:
5.1 调整图例大小
我们可以通过设置bbox_to_anchor参数来调整图例的大小和位置,以避免重叠。
import matplotlib.pyplot as plt
import numpy as np

x = np.linspace(0, 10, 100)
y1 = np.sin(x)
y2 = np.cos(x)
y3 = np.tan(x)
y4 = x**2

fig, ax = plt.subplots(figsize=(12, 8))

line1, = ax.plot(x, y1, 'r-', label='Sin')
line2, = ax.plot(x, y2, 'b-', label='Cos')
line3, = ax.plot(x, y3, 'g-', label='Tan')
line4, = ax.plot(x, y4, 'm-', label='X^2')

legend1 = ax.legend(handles=[line1, line2], bbox_to_anchor=(0.05, 1), loc='upper left', title='Trigonometric')
ax.add_artist(legend1)
legend2 = ax.legend(handles=[line3, line4], bbox_to_anchor=(1.05, 1), loc='upper left', title='Other')

ax.set_title('Avoiding Legend Overlap - how2matplotlib.com')
plt.tight_layout()
plt.show()
Output:
5.2 使用图表外的空间
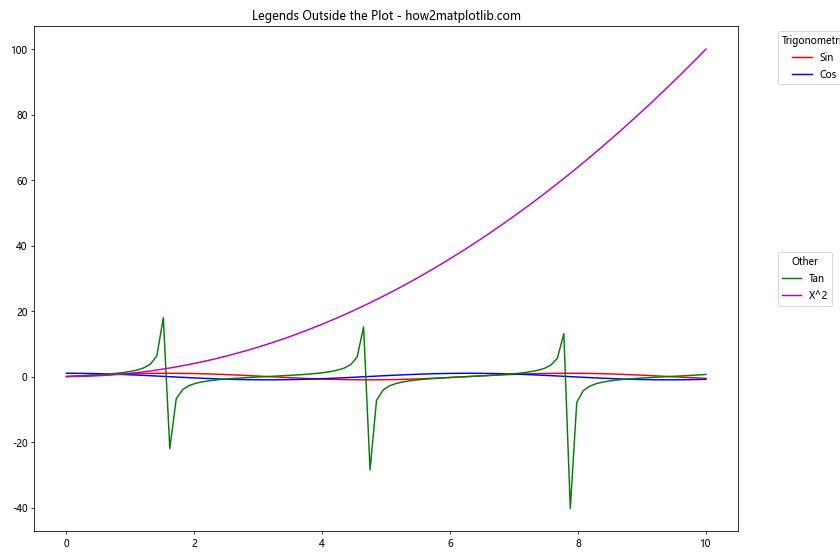
我们可以将图例放置在图表的外部,以充分利用空间并避免重叠。
import matplotlib.pyplot as plt
import numpy as np

x = np.linspace(0, 10, 100)
y1 = np.sin(x)
y2 = np.cos(x)
y3 = np.tan(x)
y4 = x**2

fig, ax = plt.subplots(figsize=(12, 8))

line1, = ax.plot(x, y1, 'r-', label='Sin')
line2, = ax.plot(x, y2, 'b-', label='Cos')
line3, = ax.plot(x, y3, 'g-', label='Tan')
line4, = ax.plot(x, y4, 'm-', label='X^2')

legend1 = ax.legend(handles=[line1, line2], bbox_to_anchor=(1.05, 1), loc='upper left', title='Trigonometric')
ax.add_artist(legend1)
legend2 = ax.legend(handles=[line3, line4], bbox_to_anchor=(1.05, 0.5), loc='center left', title='Other')

ax.set_title('Legends Outside the Plot - how2matplotlib.com')
plt.tight_layout()
plt.show()
Output:
6. 为不同类型的图表元素创建图例
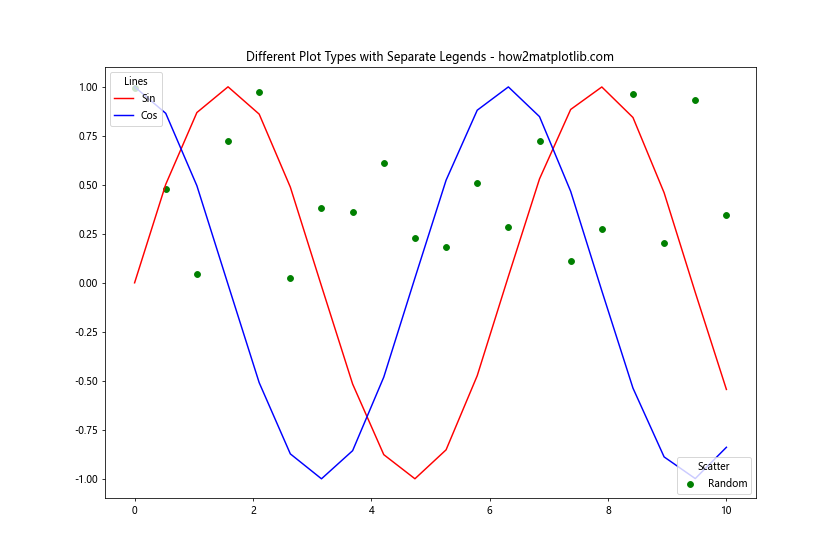
有时,我们可能需要为不同类型的图表元素(如线条、散点、柱状图等)创建单独的图例。以下是一个示例:
import matplotlib.pyplot as plt
import numpy as np

x = np.linspace(0, 10, 20)
y1 = np.sin(x)
y2 = np.cos(x)
y3 = np.random.rand(20)

fig, ax = plt.subplots(figsize=(12, 8))

line1, = ax.plot(x, y1, 'r-', label='Sin')
line2, = ax.plot(x, y2, 'b-', label='Cos')
scatter = ax.scatter(x, y3, c='g', label='Random')

legend1 = ax.legend(handles=[line1, line2], loc='upper left', title='Lines')
ax.add_artist(legend1)
legend2 = ax.legend(handles=[scatter], loc='lower right', title='Scatter')

ax.set_title('Different Plot Types with Separate Legends - how2matplotlib.com')
plt.show()
Output:
7. 使用自定义图例句柄
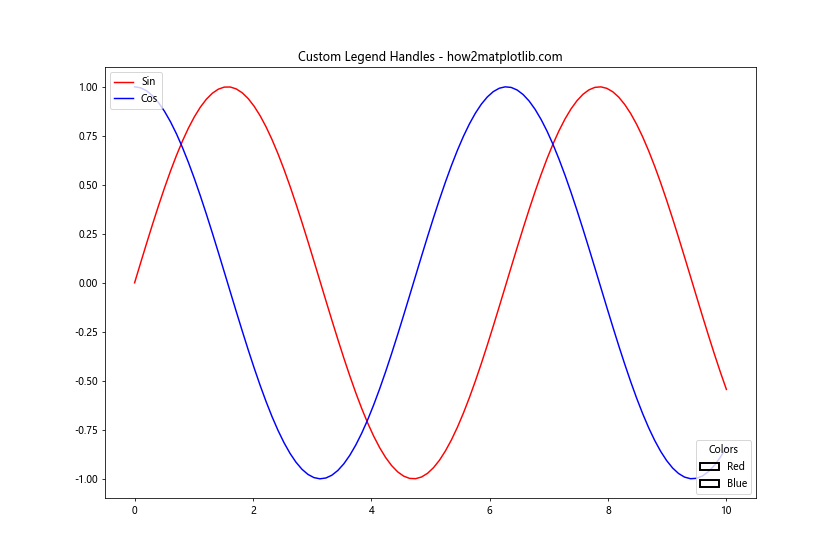
有时,我们可能需要创建自定义的图例句柄,以更好地表示数据或添加额外的信息。以下是一个示例:
import matplotlib.pyplot as plt
import numpy as np
from matplotlib.patches import Rectangle

x = np.linspace(0, 10, 100)
y1 = np.sin(x)
y2 = np.cos(x)

fig, ax = plt.subplots(figsize=(12, 8))

ax.plot(x, y1, 'r-', label='Sin')
ax.plot(x, y2, 'b-', label='Cos')

# 创建自定义图例句柄
custom_lines = [Rectangle((0, 0), 1, 1, fc="r", fill=False, lw=2),
                Rectangle((0, 0), 1, 1, fc="b", fill=False, lw=2)]

legend1 = ax.legend(loc='upper left')
ax.add_artist(legend1)
legend2 = ax.legend(custom_lines, ['Red', 'Blue'], loc='lower right', title='Colors')

ax.set_title('Custom Legend Handles - how2matplotlib.com')
plt.show()
Output:
8. 处理复杂的多图例场景
在某些情况下,我们可能需要处理更复杂的多图例场景,例如包含多个子图或需要更灵活的图例布局。以下是一个示例:
import matplotlib.pyplot as plt
import numpy as np

x = np.linspace(0, 10, 100)
y1 = np.sin(x)
y2 = np.cos(x)
y3 = np.tan(x)
y4 = x**2

fig, (ax1, ax2) = plt.subplots(2, 1, figsize=(12, 12))

# 第一个子图
line1, = ax1.plot(x, y1, 'r-', label='Sin')
line2, = ax1.plot(x, y2, 'b-', label='Cos')
legend1 = ax1.legend(loc='upper left', title='Trigonometric')
ax1.add_artist(legend1)
legend2 = ax1.legend(handles=[line1], loc='lower right', title='Sin Only')
ax1.set_title('Subplot 1 - how2matplotlib.com')

# 第二个子图
line3, = ax2.plot(x, y3, 'g-', label='Tan')
line4, = ax2.plot(x, y4, 'm-', label='X^2')
legend3 = ax2.legend(loc='upper left', title='All Functions')
ax2.add_artist(legend3)
legend4 = ax2.legend(handles=[line4], loc='lower right', title='X^2 Only')
ax2.set_title('Subplot 2 - how2matplotlib.com')

plt.tight_layout()
plt.show()
Output:
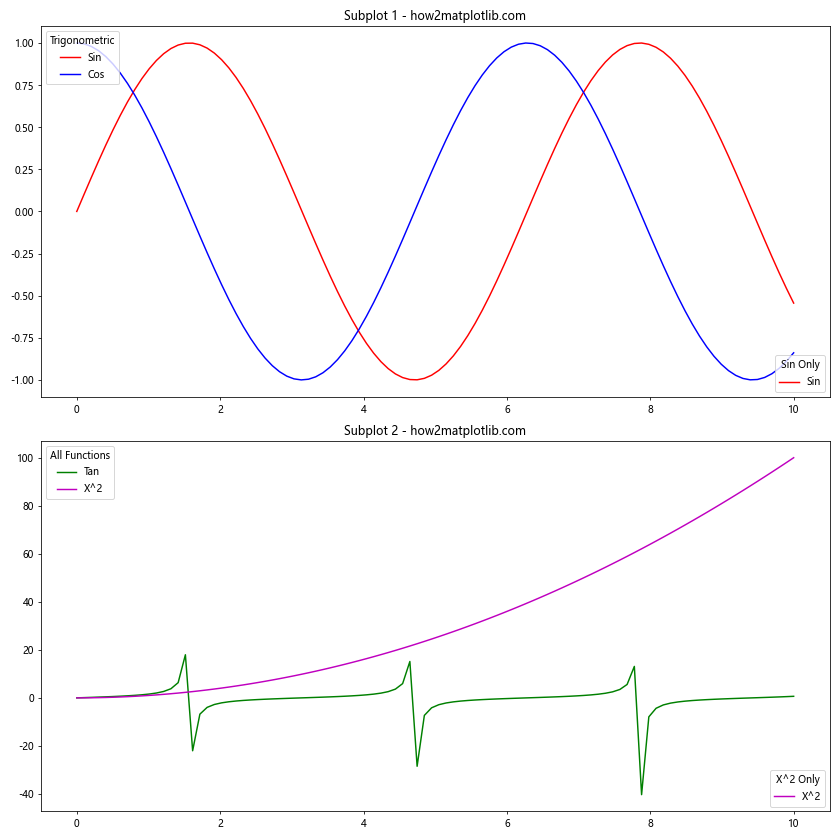
9. 使用图例组合不同数据集
有时,我们可能需要使用图例来组合来自不同数据集的信息。以下是一个示例:
import matplotlib.pyplot as plt
import numpy as np

# 数据集1
x1 = np.linspace(0, 10, 100)
y1 = np.sin(x1)
y2 = np.cos(x1)

# 数据集2
x2 = np.linspace(0, 10, 20)
y3 = np.random.rand(20)
y4 = np.random.rand(20)

fig, ax = plt.subplots(figsize=(12, 8))

# 绘制数据集1
line1, = ax.plot(x1, y1, 'r-', label='Sin')
line2, = ax.plot(x1, y2, 'b-', label='Cos')

# 绘制数据集2
scatter1 = ax.scatter(x2, y3, c='g', label='Random 1')
scatter2 = ax.scatter(x2, y4, c='m', label='Random 2')

# 创建第一个图例(线图)
legend1 = ax.legend(handles=[line1, line2], loc='upper left', title='Continuous Data')
ax.add_artist(legend1)

# 创建第二个图例(散点图)
legend2 = ax.legend(handles=[scatter1, scatter2], loc='lower right', title='Discrete Data')

ax.set_title('Combining Different Datasets with Legends - how2matplotlib.com')
plt.show()
Output:
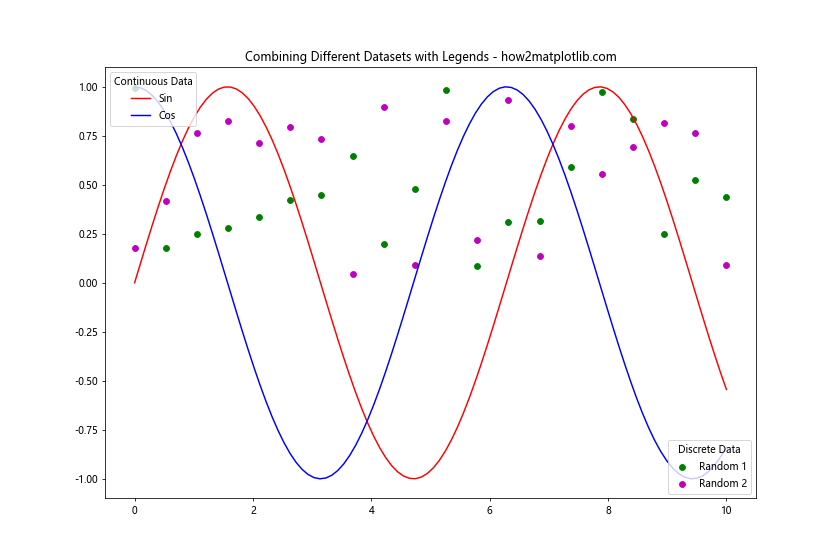
这个示例展示了如何在同一图表上组合不同类型的数据(连续数据和离散数据),并使用两个独立的图例来解释它们。
10. 使用图例分组显示数据
在某些情况下,我们可能希望使用图例来对数据进行分组显示。以下是一个示例:
import matplotlib.pyplot as plt
import numpy as np

x = np.linspace(0, 10, 100)
y1 = np.sin(x)
y2 = np.sin(x + np.pi/4)
y3 = np.sin(x + np.pi/2)
y4 = np.cos(x)
y5 = np.cos(x + np.pi/4)
y6 = np.cos(x + np.pi/2)

fig, ax = plt.subplots(figsize=(12, 8))

# 绘制所有曲线
lines = []
lines.append(ax.plot(x, y1, 'r-', label='Sin 0')[0])
lines.append(ax.plot(x, y2, 'r--', label='Sin π/4')[0])
lines.append(ax.plot(x, y3, 'r:', label='Sin π/2')[0])
lines.append(ax.plot(x, y4, 'b-', label='Cos 0')[0])
lines.append(ax.plot(x, y5, 'b--', label='Cos π/4')[0])
lines.append(ax.plot(x, y6, 'b:', label='Cos π/2')[0])

# 创建第一个图例(正弦函数)
legend1 = ax.legend(handles=lines[:3], loc='upper left', title='Sine Functions')
ax.add_artist(legend1)

# 创建第二个图例(余弦函数)
legend2 = ax.legend(handles=lines[3:], loc='lower left', title='Cosine Functions')

ax.set_title('Grouped Data Display with Legends - how2matplotlib.com')
plt.show()
Output:
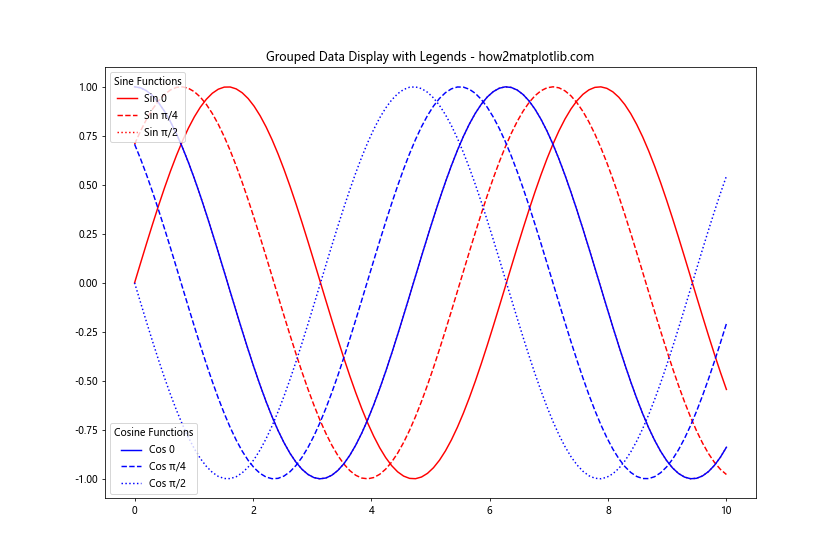
这个示例展示了如何使用两个独立的图例来分组显示正弦和余弦函数族。
11. 使用图例突出显示特定数据
有时,我们可能希望使用图例来突出显示某些特定的数据点或曲线。以下是一个示例:
import matplotlib.pyplot as plt
import numpy as np

x = np.linspace(0, 10, 100)
y1 = np.sin(x)
y2 = np.cos(x)
y3 = np.tan(x)

fig, ax = plt.subplots(figsize=(12, 8))

# 绘制所有曲线
line1, = ax.plot(x, y1, 'r-', label='Sin')
line2, = ax.plot(x, y2, 'b-', label='Cos')
line3, = ax.plot(x, y3, 'g-', label='Tan')

# 创建第一个图例(所有函数)
legend1 = ax.legend(handles=[line1, line2, line3], loc='upper left', title='All Functions')
ax.add_artist(legend1)

# 突出显示正切函数
line3.set_linewidth(3)
line3.set_linestyle(':')
legend2 = ax.legend(handles=[line3], loc='lower right', title='Highlighted Function')

ax.set_title('Highlighting Specific Data with Legends - how2matplotlib.com')
plt.show()
Output:
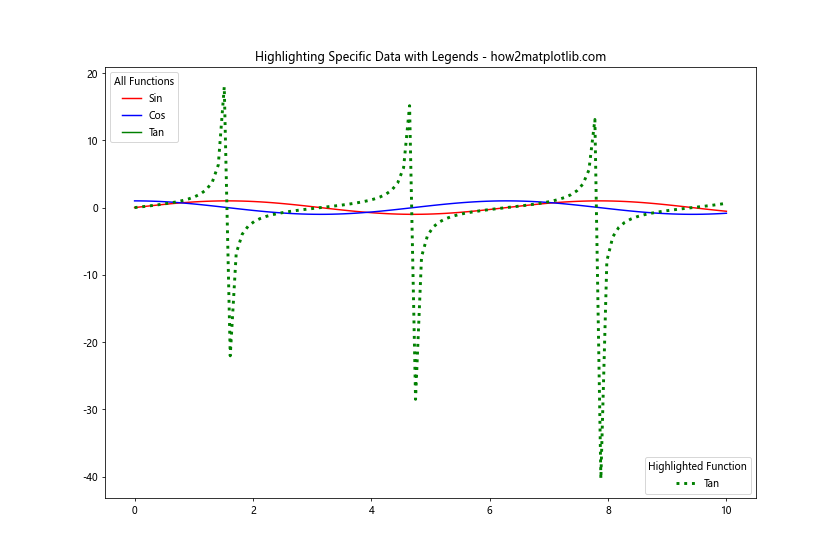
这个示例展示了如何使用单独的图例来突出显示正切函数,同时保留所有函数的完整图例。
12. 使用图例显示统计信息
图例不仅可以用来标识不同的数据系列,还可以用来显示一些统计信息。以下是一个示例:
import matplotlib.pyplot as plt
import numpy as np

x = np.linspace(0, 10, 100)
y1 = np.sin(x) + np.random.normal(0, 0.1, 100)
y2 = np.cos(x) + np.random.normal(0, 0.1, 100)

fig, ax = plt.subplots(figsize=(12, 8))

# 绘制数据点和拟合曲线
scatter1 = ax.scatter(x, y1, c='r', label='Sin Data')
scatter2 = ax.scatter(x, y2, c='b', label='Cos Data')
line1, = ax.plot(x, np.sin(x), 'r-', label='Sin Fit')
line2, = ax.plot(x, np.cos(x), 'b-', label='Cos Fit')

# 创建第一个图例(数据点)
legend1 = ax.legend(handles=[scatter1, scatter2], loc='upper left', title='Data Points')
ax.add_artist(legend1)

# 创建第二个图例(拟合曲线和统计信息)
from matplotlib.lines import Line2D
custom_lines = [Line2D([0], [0], color='r', lw=2),
                Line2D([0], [0], color='b', lw=2)]
legend2 = ax.legend(custom_lines, [f'Sin Fit (R²={np.random.rand():.2f})',
                                   f'Cos Fit (R²={np.random.rand():.2f})'],
                    loc='lower right', title='Fit Statistics')

ax.set_title('Displaying Statistical Information with Legends - how2matplotlib.com')
plt.show()
Output:
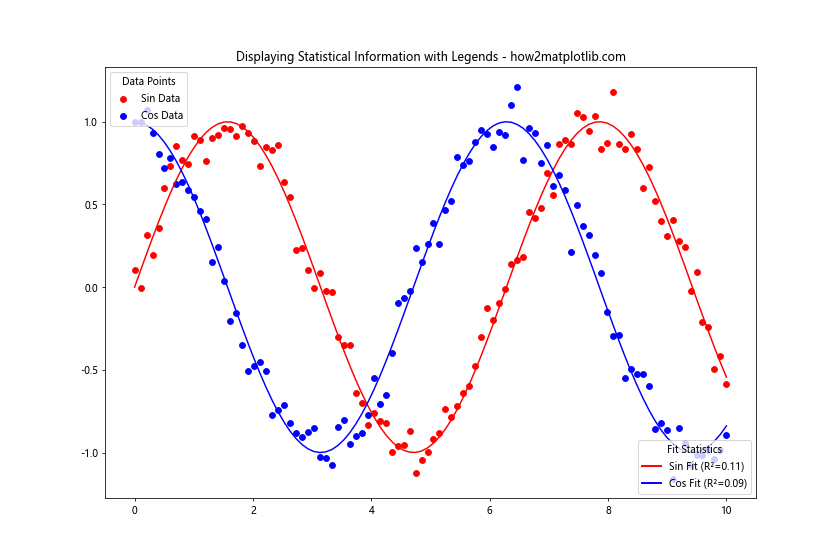
这个示例展示了如何使用图例来显示数据点、拟合曲线以及相关的统计信息(如R²值)。
13. 使用图例处理多维数据
当处理多维数据时,我们可能需要使用多个图例来解释不同维度的信息。以下是一个示例:
import matplotlib.pyplot as plt
import numpy as np

# 生成多维数据
np.random.seed(0)
n_points = 200
x = np.random.rand(n_points)
y = np.random.rand(n_points)
sizes = np.random.rand(n_points) * 100
colors = np.random.rand(n_points)
shapes = np.random.choice(['o', 's', '^', 'D'], n_points)

fig, ax = plt.subplots(figsize=(12, 8))

# 绘制散点图
for shape in set(shapes):
    mask = shapes == shape
    scatter = ax.scatter(x[mask], y[mask], s=sizes[mask], c=colors[mask],
                         marker=shape, label=f'Shape {shape}', cmap='viridis')

# 创建形状图例
legend1 = ax.legend(title='Shapes', loc='upper left')
ax.add_artist(legend1)

# 创建颜色图例
cbar = plt.colorbar(scatter)
cbar.set_label('Color Value')

# 创建大小图例
handles, labels = scatter.legend_elements(prop="sizes", alpha=0.6, num=4)
legend2 = ax.legend(handles, labels, loc="lower right", title="Sizes")

ax.set_title('Handling Multidimensional Data with Multiple Legends - how2matplotlib.com')
plt.tight_layout()
plt.show()
Output:
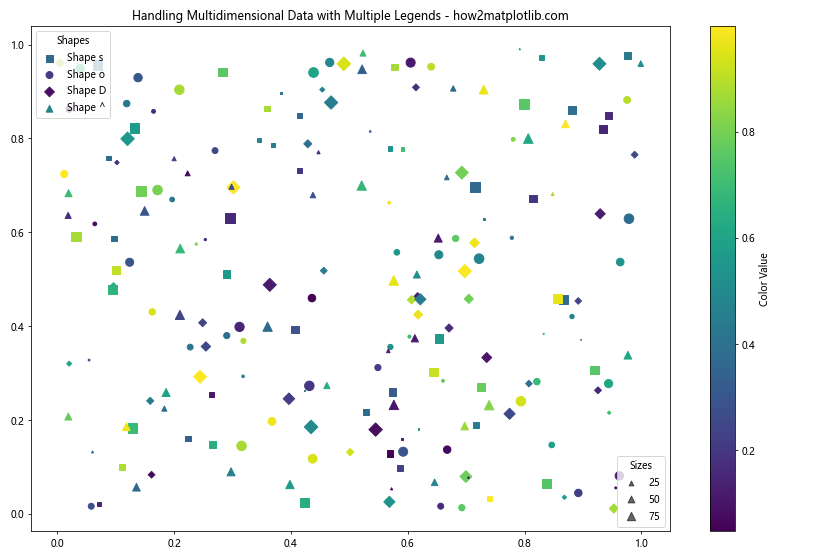
这个示例展示了如何使用多个图例来解释散点图中的形状、颜色和大小等多个维度的信息。
14. 使用图例处理时间序列数据
在处理时间序列数据时,我们可能需要使用图例来标识不同的时间段或事件。以下是一个示例:
import matplotlib.pyplot as plt
import numpy as np
import pandas as pd

# 生成时间序列数据
dates = pd.date_range(start='2023-01-01', end='2023-12-31', freq='D')
values = np.cumsum(np.random.randn(len(dates)))

fig, ax = plt.subplots(figsize=(12, 8))

# 绘制时间序列
line, = ax.plot(dates, values, label='Daily Values')

# 标记特定事件
events = [
    ('2023-03-15', 'Event A'),
    ('2023-07-01', 'Event B'),
    ('2023-11-30', 'Event C')
]

for date, event in events:
    event_date = pd.to_datetime(date)
    event_value = values[dates == event_date][0]
    ax.plot(event_date, event_value, 'ro', markersize=10)
    ax.annotate(event, (event_date, event_value), xytext=(10, 10),
                textcoords='offset points')

# 创建第一个图例(时间序列)
legend1 = ax.legend(loc='upper left')
ax.add_artist(legend1)

# 创建第二个图例(事件)
from matplotlib.lines import Line2D
custom_lines = [Line2D([0], [0], marker='o', color='r', linestyle='', markersize=10)]
legend2 = ax.legend(custom_lines, ['Special Events'], loc='lower right')

ax.set_title('Time Series Data with Event Legends - how2matplotlib.com')
plt.tight_layout()
plt.show()
Output:
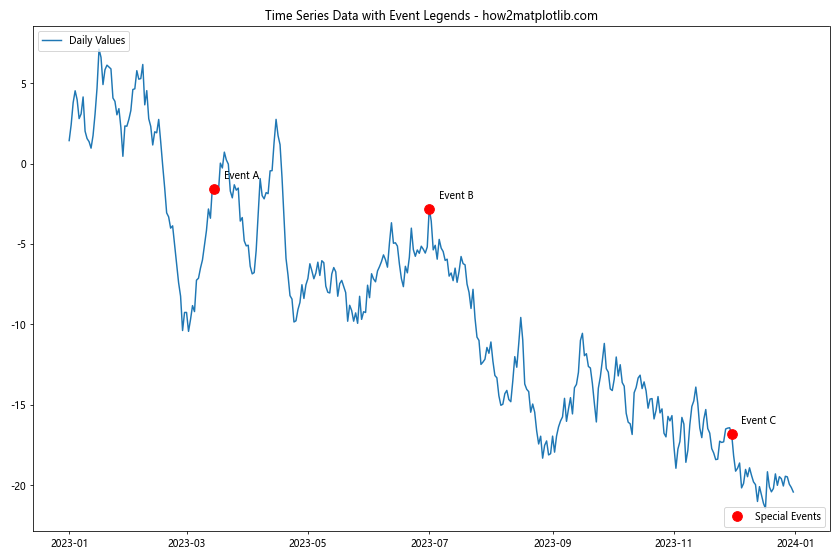
这个示例展示了如何在时间序列图表中使用图例来标识主要数据和特殊事件。
15. 使用图例处理分类数据
当处理分类数据时,我们可能需要使用图例来解释不同的类别和子类别。以下是一个示例:
import matplotlib.pyplot as plt
import numpy as np

# 生成分类数据
categories = ['A', 'B', 'C', 'D']
subcategories = ['X', 'Y', 'Z']
values = np.random.rand(len(categories), len(subcategories))

fig, ax = plt.subplots(figsize=(12, 8))

# 绘制堆叠柱状图
bottom = np.zeros(len(categories))
bars = []
for i, subcategory in enumerate(subcategories):
    bar = ax.bar(categories, values[:, i], bottom=bottom, label=subcategory)
    bottom += values[:, i]
    bars.append(bar)

# 创建子类别图例
legend1 = ax.legend(title='Subcategories', loc='upper left')
ax.add_artist(legend1)

# 创建颜色图例
colors = ['#1f77b4', '#ff7f0e', '#2ca02c', '#d62728']
handles = [plt.Rectangle((0,0),1,1, color=color) for color in colors]
legend2 = ax.legend(handles, categories, title='Categories', loc='upper right')

ax.set_title('Categorical Data with Multiple Legends - how2matplotlib.com')
ax.set_ylabel('Values')
plt.tight_layout()
plt.show()
Output:
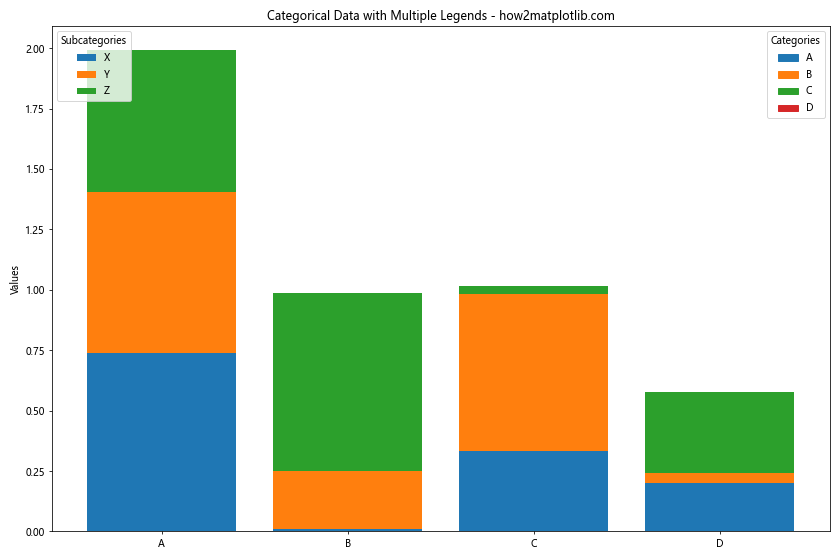
这个示例展示了如何使用多个图例来解释堆叠柱状图中的类别和子类别信息。
结论
在Matplotlib中在同一图表上放置两个不同的图例是一项强大的技术,可以帮助我们更好地展示和解释复杂的数据关系。通过本文介绍的各种方法和技巧,我们可以灵活地处理各种图例需求,包括调整位置和样式、避免重叠、处理不同类型的图表元素、创建自定义图例句柄等。
在实际应用中,选择合适的图例布局和样式对于提高图表的可读性和信息传递效率至关重要。我们应该根据具体的数据特征和展示需求,灵活运用这些技巧,创建清晰、美观、信息丰富的数据可视化图表。
最后,建议读者在实践中多尝试不同的图例组合和布局方式,以找到最适合自己数据和受众的展示方式。同时,也要注意保持图表的简洁性,避免过多的图例信息影响图表的整体美观和可读性。
 极客笔记
极客笔记