Matplotlib.pyplot.plot() 函数:Python 数据可视化的核心工具
参考:Matplotlib.pyplot.plot() function in Python
Matplotlib 是 Python 中最流行的数据可视化库之一,而 pyplot.plot() 函数是其中最常用和最versatile的绘图工具。本文将深入探讨 Matplotlib.pyplot.plot() 函数的各种用法、参数和技巧,帮助你掌握这个强大的数据可视化工具。
1. pyplot.plot() 函数简介
pyplot.plot() 函数是 Matplotlib 库中用于创建二维线图的主要函数。它可以绘制点、线、曲线等多种图形,并提供了丰富的自定义选项。
基本语法如下:
import matplotlib.pyplot as plt

plt.plot(x, y)
plt.show()
这里的 x 和 y 是相同长度的数组或列表,表示要绘制的数据点的 x 坐标和 y 坐标。
让我们从一个简单的例子开始:
import matplotlib.pyplot as plt

x = [1, 2, 3, 4, 5]
y = [2, 4, 6, 8, 10]

plt.plot(x, y)
plt.title("How2matplotlib.com - Simple Line Plot")
plt.xlabel("X-axis")
plt.ylabel("Y-axis")
plt.show()
Output:
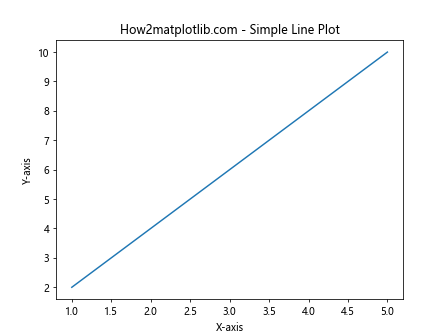
这个例子绘制了一条简单的直线。我们定义了 x 和 y 坐标,使用 plt.plot(x, y) 绘制线图,然后添加了标题和坐标轴标签,最后使用 plt.show() 显示图形。
2. 自定义线条样式
pyplot.plot() 函数允许你自定义线条的样式,包括颜色、线型、标记等。
2.1 颜色设置
你可以使用 color 参数或简写 ‘c’ 来设置线条颜色:
import matplotlib.pyplot as plt

x = [1, 2, 3, 4, 5]
y1 = [2, 4, 6, 8, 10]
y2 = [1, 3, 5, 7, 9]

plt.plot(x, y1, color='red', label='Line 1')
plt.plot(x, y2, c='blue', label='Line 2')
plt.title("How2matplotlib.com - Custom Color Lines")
plt.legend()
plt.show()
Output:
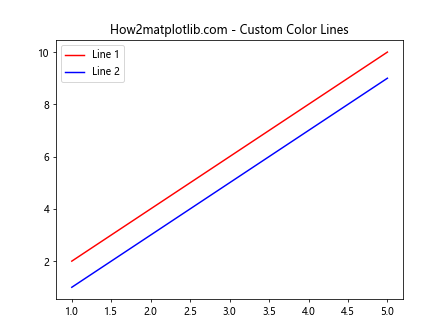
在这个例子中,我们绘制了两条不同颜色的线,并添加了图例。
2.2 线型设置
使用 linestyle 参数或简写 ‘ls’ 来设置线型:
import matplotlib.pyplot as plt

x = range(0, 10)
y = [i**2 for i in x]

plt.plot(x, y, linestyle='--', color='green')
plt.title("How2matplotlib.com - Custom Line Style")
plt.show()
Output:
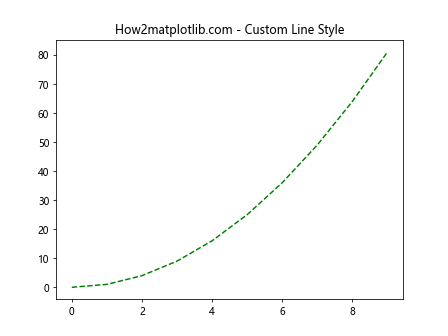
这个例子展示了如何绘制一条绿色的虚线。
2.3 标记设置
使用 marker 参数来添加数据点标记:
import matplotlib.pyplot as plt

x = [1, 2, 3, 4, 5]
y = [2, 4, 6, 8, 10]

plt.plot(x, y, marker='o', linestyle='-', color='purple')
plt.title("How2matplotlib.com - Line with Markers")
plt.show()
Output:
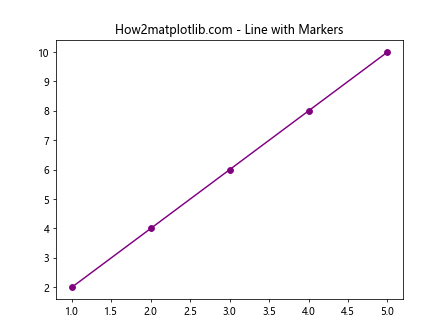
这个例子在线上添加了圆形标记。
3. 多线图绘制
pyplot.plot() 函数可以在一次调用中绘制多条线,或者通过多次调用来绘制多条线。
3.1 单次调用绘制多条线
import matplotlib.pyplot as plt

x = [1, 2, 3, 4, 5]
y1 = [1, 4, 9, 16, 25]
y2 = [1, 8, 27, 64, 125]

plt.plot(x, y1, 'r-', x, y2, 'b--')
plt.title("How2matplotlib.com - Multiple Lines in One Call")
plt.show()
Output:
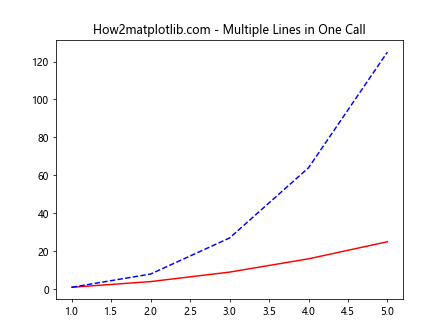
这个例子在一次 plot() 调用中绘制了两条不同样式的线。
3.2 多次调用绘制多条线
import matplotlib.pyplot as plt

x = range(0, 5)
y1 = [i**2 for i in x]
y2 = [i**3 for i in x]

plt.plot(x, y1, label='Square')
plt.plot(x, y2, label='Cube')
plt.title("How2matplotlib.com - Multiple Lines with Multiple Calls")
plt.legend()
plt.show()
Output:
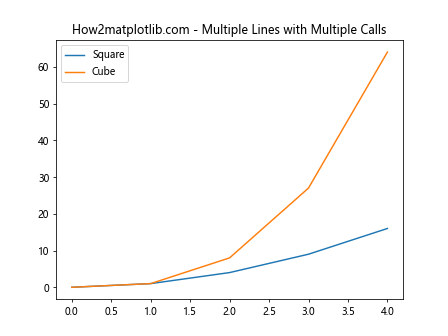
这个例子通过多次调用 plot() 函数绘制了多条线,并添加了图例。
4. 坐标轴设置
pyplot.plot() 函数与其他 Matplotlib 函数配合,可以灵活地设置坐标轴。
4.1 设置坐标轴范围
使用 plt.xlim() 和 plt.ylim() 函数来设置坐标轴的范围:
import matplotlib.pyplot as plt

x = range(-5, 6)
y = [i**2 for i in x]

plt.plot(x, y)
plt.xlim(-6, 6)
plt.ylim(0, 30)
plt.title("How2matplotlib.com - Custom Axis Limits")
plt.grid(True)
plt.show()
Output:
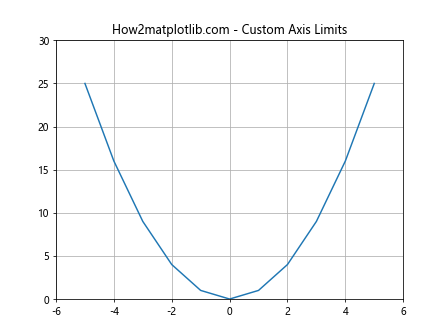
这个例子设置了 x 轴和 y 轴的显示范围,并添加了网格线。
4.2 设置坐标轴刻度
使用 plt.xticks() 和 plt.yticks() 函数来自定义坐标轴刻度:
import matplotlib.pyplot as plt
import numpy as np

x = np.linspace(0, 2*np.pi, 100)
y = np.sin(x)

plt.plot(x, y)
plt.xticks([0, np.pi/2, np.pi, 3*np.pi/2, 2*np.pi],
           ['0', 'π/2', 'π', '3π/2', '2π'])
plt.yticks([-1, 0, 1])
plt.title("How2matplotlib.com - Custom Axis Ticks")
plt.show()
Output:
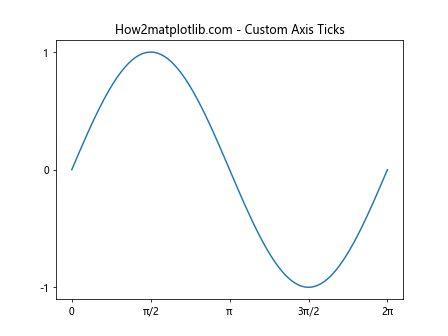
这个例子自定义了 x 轴和 y 轴的刻度标签。
5. 添加标题、标签和图例
为了使图表更加信息丰富,我们通常需要添加标题、轴标签和图例。
5.1 添加标题和轴标签
import matplotlib.pyplot as plt

x = range(0, 10)
y = [i**2 for i in x]

plt.plot(x, y)
plt.title("How2matplotlib.com - Square Function")
plt.xlabel("X-axis")
plt.ylabel("Y-axis (X squared)")
plt.show()
Output:
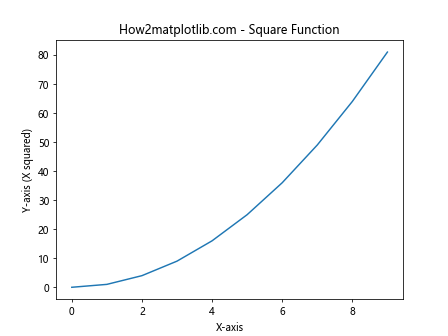
这个例子展示了如何添加标题和轴标签。
5.2 添加图例
import matplotlib.pyplot as plt

x = range(0, 5)
y1 = [i**2 for i in x]
y2 = [i**3 for i in x]

plt.plot(x, y1, label='Square')
plt.plot(x, y2, label='Cube')
plt.title("How2matplotlib.com - Square and Cube Functions")
plt.legend(loc='upper left')
plt.show()
Output:
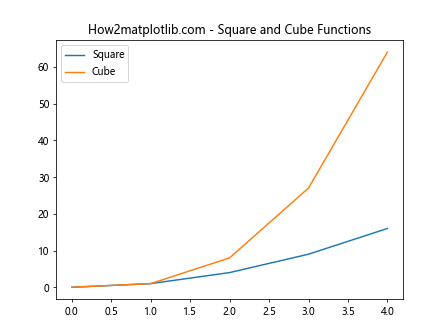
这个例子展示了如何为多条线添加图例,并指定图例的位置。
6. 子图绘制
pyplot.plot() 函数可以与 subplot() 函数配合使用,在一个图形窗口中创建多个子图。
import matplotlib.pyplot as plt

x = range(0, 5)
y1 = [i**2 for i in x]
y2 = [i**3 for i in x]

plt.subplot(2, 1, 1)
plt.plot(x, y1)
plt.title("How2matplotlib.com - Square Function")

plt.subplot(2, 1, 2)
plt.plot(x, y2)
plt.title("How2matplotlib.com - Cube Function")

plt.tight_layout()
plt.show()
Output:
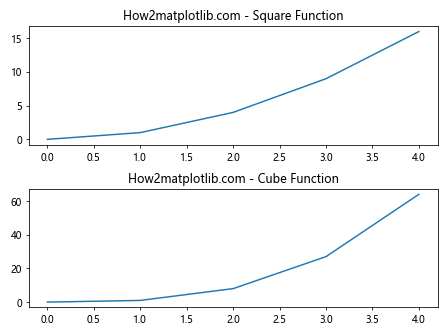
这个例子创建了两个垂直排列的子图,分别显示平方函数和立方函数。
7. 数据点标注
有时我们需要在图上标注特定的数据点。可以使用 plt.annotate() 函数来实现这一功能。
import matplotlib.pyplot as plt

x = [1, 2, 3, 4, 5]
y = [1, 4, 9, 16, 25]

plt.plot(x, y, 'ro-')
plt.annotate('Maximum', xy=(5, 25), xytext=(3, 27),
             arrowprops=dict(facecolor='black', shrink=0.05))
plt.title("How2matplotlib.com - Annotated Plot")
plt.show()
Output:
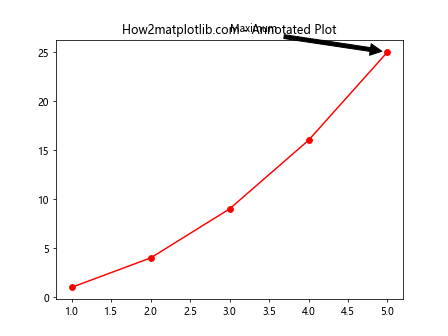
这个例子在最大值点添加了一个带箭头的注释。
8. 自定义线条属性
pyplot.plot() 函数允许你精细地控制线条的各种属性,如线宽、透明度等。
import matplotlib.pyplot as plt
import numpy as np

x = np.linspace(0, 10, 100)
y1 = np.sin(x)
y2 = np.cos(x)

plt.plot(x, y1, linewidth=2, alpha=0.7, label='sin(x)')
plt.plot(x, y2, linewidth=1, linestyle='--', alpha=0.5, label='cos(x)')
plt.title("How2matplotlib.com - Custom Line Properties")
plt.legend()
plt.show()
Output:
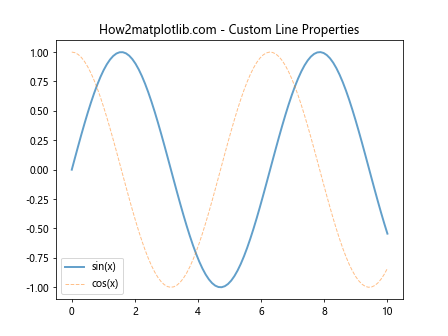
这个例子展示了如何设置线宽、透明度和线型。
9. 填充区域
除了绘制线条,pyplot.plot() 函数还可以与其他函数配合使用来填充曲线下的区域。
import matplotlib.pyplot as plt
import numpy as np

x = np.linspace(0, 10, 100)
y1 = np.sin(x)
y2 = np.cos(x)

plt.plot(x, y1, 'r', label='sin(x)')
plt.plot(x, y2, 'b', label='cos(x)')
plt.fill_between(x, y1, y2, where=(y1 > y2), alpha=0.3, color='green')
plt.title("How2matplotlib.com - Filled Area Plot")
plt.legend()
plt.show()
Output:
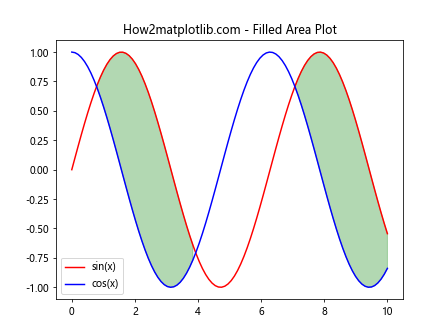
这个例子填充了 sin(x) 大于 cos(x) 的区域。
10. 对数坐标轴
对于某些数据集,使用对数坐标轴可能更合适。pyplot.plot() 函数可以与对数坐标轴函数配合使用。
import matplotlib.pyplot as plt
import numpy as np

x = np.logspace(0, 5, 100)
y = x**2

plt.plot(x, y)
plt.xscale('log')
plt.yscale('log')
plt.title("How2matplotlib.com - Log-Log Plot")
plt.xlabel("X (log scale)")
plt.ylabel("Y (log scale)")
plt.show()
Output:
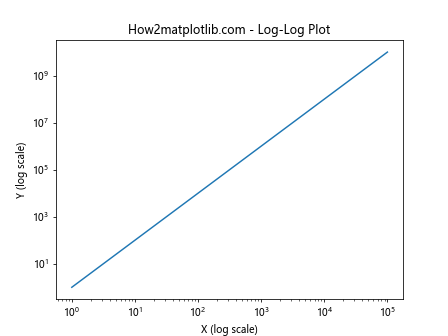
这个例子创建了一个双对数坐标图。
11. 极坐标图
pyplot.plot() 函数也可以用于创建极坐标图。
import matplotlib.pyplot as plt
import numpy as np

r = np.arange(0, 2, 0.01)
theta = 2 * np.pi * r

fig, ax = plt.subplots(subplot_kw={'projection': 'polar'})
ax.plot(theta, r)
ax.set_title("How2matplotlib.com - Polar Plot")
plt.show()
Output:
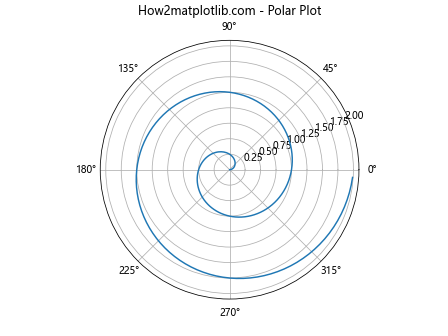
这个例子创建了一个简单的极坐标图。
12. 误差线
在科学绘图中,经常需要显示误差范围。pyplot.plot() 函数可以与 errorbar() 函数配合使用来绘制误差线。
import matplotlib.pyplot as plt
import numpy as np

x = np.linspace(0, 10, 50)
y = np.sin(x)
yerr = 0.1 + 0.2 * np.random.rand(len(x))

plt.errorbar(x, y, yerr=yerr, fmt='o', capsize=5)
plt.title("How2matplotlib.com - Error Bar Plot")
plt.show()
Output:
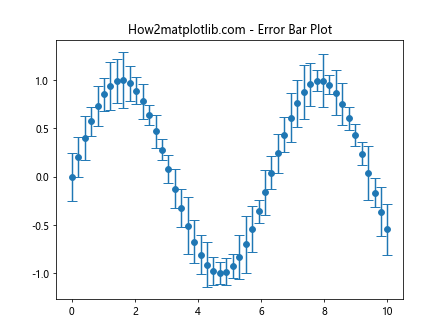
这个例子展示了如何添加误差线到数据点。
13. 自定义标记
pyplot.plot() 函数允许使用各种标准标记,也支持自定义标记。
import matplotlib.pyplot as plt
import numpy as np

x = np.linspace(0, 2*np.pi, 10)
y = np.sin(x)

plt.plot(x, y, 'o-', markersize=10, markerfacecolor='red', markeredgecolor='blue')
plt.title("How2matplotlib.com - Custom Markers")
plt.show()
Output:
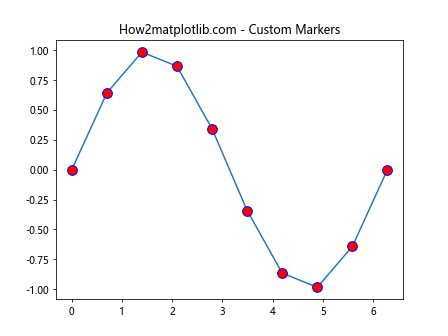
这个例子展示了如何自定义标记的大小和颜色。
14. 多Y轴图
有时我们需要在同一图中显示具有不同数量级的多个数据系列。这时可以使用多个Y轴。
import matplotlib.pyplot as plt
import numpy as np

x = np.linspace(0, 10, 100)
y1 = np.sin(x)
y2 = np.exp(x)

fig, ax1 = plt.subplots()

ax1.plot(x, y1, 'b-')
ax1.set_ylabel('sin(x)', color='b')

ax2 = ax1.twinx()
ax2.plot(x, y2, 'r-')
ax2.set_ylabel('exp(x)', color='r')

plt.title("How2matplotlib.com - Multiple Y-axes")
plt.show()
Output:
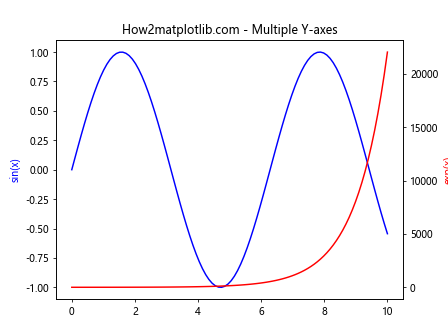
这个例子创建了一个具有两个Y轴的图,分别显示正弦函数和指数函数。
15. 自定义颜色映射
pyplot.plot() 函数可以使用颜色映射来为数据点或线段着色。
好的,我将继续输出剩余内容:
import matplotlib.pyplot as plt
import numpy as np

x = np.linspace(0, 10, 100)
y = np.sin(x)

plt.scatter(x, y, c=y, cmap='viridis')
plt.colorbar(label='sin(x)')
plt.title("How2matplotlib.com - Custom Color Map")
plt.show()
Output:
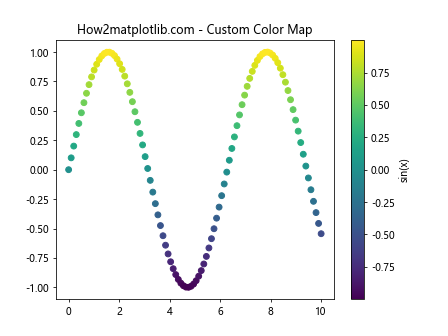
这个例子使用 ‘viridis’ 颜色映射来为散点图着色,颜色基于 y 值变化。
16. 3D线图
虽然 pyplot.plot() 主要用于 2D 绘图,但它也可以在 3D 图形中使用。
import matplotlib.pyplot as plt
import numpy as np

fig = plt.figure()
ax = fig.add_subplot(111, projection='3d')

t = np.linspace(0, 10, 100)
x = np.cos(t)
y = np.sin(t)
z = t

ax.plot(x, y, z)
ax.set_title("How2matplotlib.com - 3D Line Plot")
plt.show()
Output:
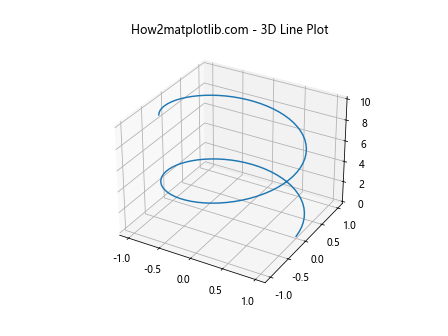
这个例子创建了一个简单的 3D 螺旋线图。
17. 动画图
pyplot.plot() 函数可以与 animation 模块结合使用来创建动画图。
import matplotlib.pyplot as plt
import matplotlib.animation as animation
import numpy as np

fig, ax = plt.subplots()
x = np.arange(0, 2*np.pi, 0.01)
line, = ax.plot(x, np.sin(x))

def animate(i):
    line.set_ydata(np.sin(x + i/10))
    return line,

ani = animation.FuncAnimation(fig, animate, frames=200, interval=20, blit=True)
plt.title("How2matplotlib.com - Animated Plot")
plt.show()
Output:
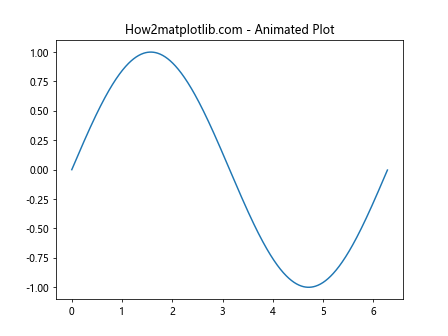
这个例子创建了一个简单的正弦波动画。
18. 自定义样式
Matplotlib 允许你自定义整体绘图样式,这可以影响 pyplot.plot() 函数的默认行为。
import matplotlib.pyplot as plt
import numpy as np

plt.style.use('seaborn')

x = np.linspace(0, 10, 100)
y1 = np.sin(x)
y2 = np.cos(x)

plt.plot(x, y1, label='sin(x)')
plt.plot(x, y2, label='cos(x)')
plt.title("How2matplotlib.com - Custom Style")
plt.legend()
plt.show()
这个例子使用了 ‘seaborn’ 样式来改变图形的整体外观。
19. 数据可视化最佳实践
在使用 pyplot.plot() 函数时,遵循一些数据可视化的最佳实践可以使你的图表更加清晰和有效。
- 选择合适的图表类型:线图适合展示连续数据或趋势。
- 保持简洁:避免过度装饰,专注于数据本身。
- 使用清晰的标签和标题:确保观众能够理解图表内容。
- 选择合适的颜色:使用对比度高的颜色,考虑色盲友好的配色方案。
- 适当使用图例:当有多个数据系列时,使用图例来区分它们。
这里是一个遵循这些原则的例子:
import matplotlib.pyplot as plt
import numpy as np

plt.figure(figsize=(10, 6))
x = np.linspace(0, 10, 100)
y1 = np.sin(x)
y2 = np.cos(x)

plt.plot(x, y1, label='sin(x)', color='#1f77b4')
plt.plot(x, y2, label='cos(x)', color='#ff7f0e')
plt.title("Trigonometric Functions", fontsize=16)
plt.xlabel("X", fontsize=12)
plt.ylabel("Y", fontsize=12)
plt.legend(fontsize=10)
plt.grid(True, linestyle='--', alpha=0.7)
plt.text(5, 0.5, "How2matplotlib.com", fontsize=12, ha='center')
plt.tight_layout()
plt.show()
Output:
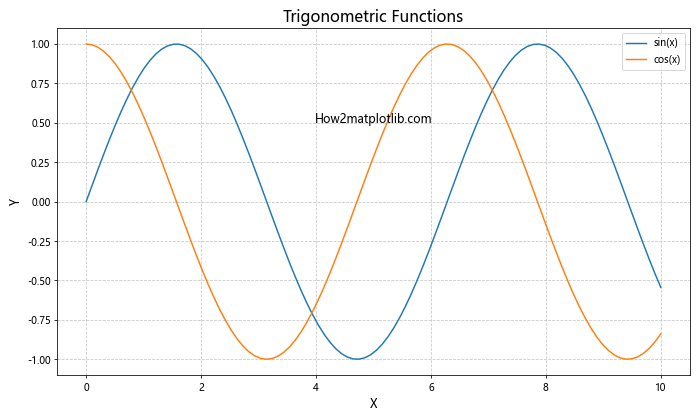
这个例子展示了如何创建一个清晰、信息丰富且美观的图表。
20. 高级技巧和注意事项
在使用 pyplot.plot() 函数时,还有一些高级技巧和注意事项值得关注:
- 性能优化:对于大量数据点,考虑使用
plt.plot(x, y, 'k,')来绘制小点而不是线条,这样可以提高绘图速度。 -
内存管理:处理大型数据集时,可以使用生成器或迭代器来逐步加载数据,而不是一次性将所有数据加载到内存中。
-
交互式绘图:使用
plt.ion()开启交互模式,可以实时更新图表。 -
保存图形:使用
plt.savefig()函数可以将图形保存为各种格式的文件。 -
自定义 tick 格式:使用
plt.gca().xaxis.set_major_formatter()可以自定义坐标轴刻度的格式。
这里是一个结合了几个高级技巧的例子:
import matplotlib.pyplot as plt
import numpy as np
from matplotlib.ticker import FuncFormatter

def millions(x, pos):
    return f'{x/1e6:,.0f}M'

plt.figure(figsize=(10, 6))
x = np.linspace(0, 10, 1000000)
y = np.sin(x) * 1e6

plt.plot(x, y, 'k,', alpha=0.1)
plt.title("How2matplotlib.com - Advanced Techniques", fontsize=16)
plt.xlabel("X", fontsize=12)
plt.ylabel("Y (Millions)", fontsize=12)
plt.gca().yaxis.set_major_formatter(FuncFormatter(millions))
plt.grid(True, linestyle='--', alpha=0.7)
plt.tight_layout()
plt.savefig('advanced_plot.png', dpi=300)
plt.show()
Output:
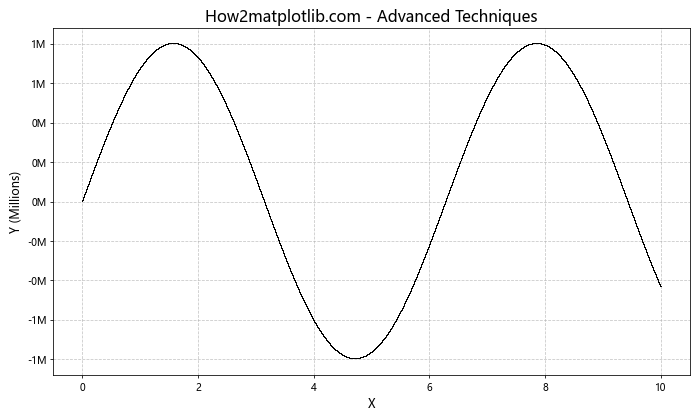
这个例子展示了如何处理大量数据点、自定义 Y 轴刻度格式,以及如何保存高分辨率图像。
结论
Matplotlib.pyplot.plot() 函数是一个强大而灵活的工具,能够满足各种数据可视化需求。从简单的线图到复杂的多轴图表,从静态图像到动态动画,plot() 函数都能胜任。通过本文介绍的各种技巧和示例,你应该能够更好地掌握这个函数,并创建出富有洞察力的数据可视化作品。
记住,数据可视化不仅仅是技术,更是一门艺术。好的图表应该能够清晰、准确、有效地传达信息,同时还要美观吸引人。因此,在使用 pyplot.plot() 函数时,要注意平衡技术实现和视觉设计,以创造出既信息丰富又赏心悦目的图表。
最后,持续学习和实践是提高数据可视化技能的关键。尝试将本文中的示例应用到你自己的数据集上,探索 Matplotlib 的其他功能,并关注数据可视化领域的最新趋势和最佳实践。通过不断尝试和创新,你将能够充分发挥 pyplot.plot() 函数的潜力,创造出令人印象深刻的数据可视化作品。
 极客笔记
极客笔记