Matplotlib.pyplot.figlegend()函数:轻松创建图例的完整指南
参考:Matplotlib.pyplot.figlegend() function in Python
Matplotlib是Python中最流行的数据可视化库之一,而pyplot是Matplotlib中的一个重要模块,提供了类似MATLAB的绘图接口。在数据可视化中,图例(legend)是一个非常重要的元素,它帮助读者理解图表中不同数据系列的含义。本文将详细介绍Matplotlib.pyplot中的figlegend()函数,这是一个用于创建图例的强大工具。
1. figlegend()函数简介
figlegend()函数是Matplotlib.pyplot模块中的一个函数,用于在整个图形(Figure)上创建一个图例,而不是仅仅在单个子图(Axes)上。这个函数特别适用于包含多个子图的复杂图形,可以为整个图形创建一个统一的图例。
基本语法如下:
matplotlib.pyplot.figlegend(*args, **kwargs)
让我们通过一个简单的例子来了解figlegend()的基本用法:
import matplotlib.pyplot as plt
import numpy as np

x = np.linspace(0, 10, 100)
fig, (ax1, ax2) = plt.subplots(2, 1, figsize=(8, 6))

ax1.plot(x, np.sin(x), label='Sin')
ax2.plot(x, np.cos(x), label='Cos')

plt.figlegend(loc='upper right', bbox_to_anchor=(1, 1), bbox_transform=plt.gcf().transFigure)
plt.suptitle('How to use figlegend() - how2matplotlib.com')
plt.tight_layout()
plt.show()
Output:
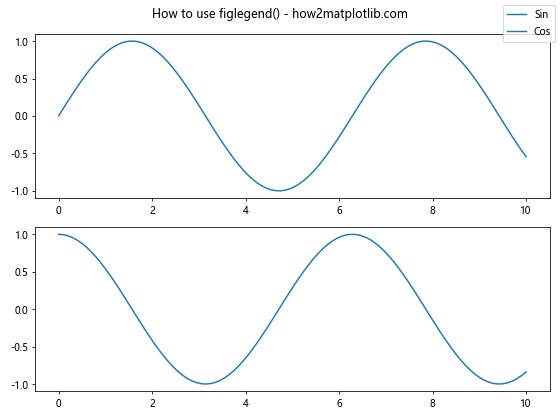
在这个例子中,我们创建了两个子图,分别绘制了正弦和余弦函数。然后使用figlegend()在整个图形的右上角创建了一个图例。
2. figlegend()函数的参数
figlegend()函数有许多参数可以用来自定义图例的外观和位置。以下是一些常用的参数:
- loc:指定图例的位置,可以是字符串(如’upper right’)或数字代码。
- bbox_to_anchor:用于微调图例的位置。
- ncol:指定图例的列数。
- fontsize:设置图例文本的字体大小。
- frameon:控制是否显示图例的边框。
- title:为图例添加标题。
让我们通过一个例子来展示这些参数的使用:
import matplotlib.pyplot as plt
import numpy as np

x = np.linspace(0, 10, 100)
fig, (ax1, ax2) = plt.subplots(2, 1, figsize=(8, 6))

ax1.plot(x, np.sin(x), label='Sin')
ax2.plot(x, np.cos(x), label='Cos')

plt.figlegend(loc='center right', bbox_to_anchor=(1.1, 0.5), ncol=1, fontsize=10,
              frameon=True, title='Functions', title_fontsize=12)
plt.suptitle('Customizing figlegend() - how2matplotlib.com')
plt.tight_layout()
plt.show()
Output:
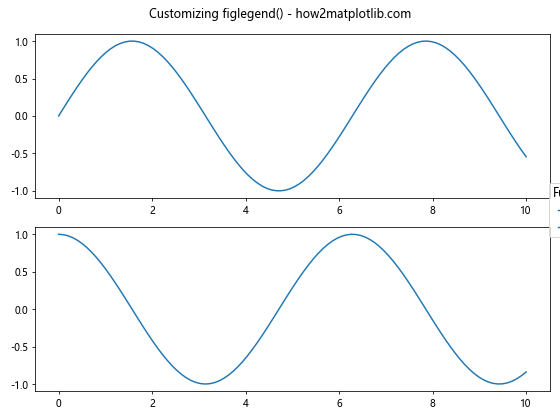
在这个例子中,我们使用了多个参数来自定义图例的外观和位置。图例被放置在图形的右侧中央,有一个标题,并且文本大小和边框都进行了调整。
3. 处理多个数据系列
当你的图形包含多个数据系列时,figlegend()可以非常方便地创建一个统一的图例。让我们看一个更复杂的例子:
import matplotlib.pyplot as plt
import numpy as np

x = np.linspace(0, 10, 100)
fig, (ax1, ax2) = plt.subplots(2, 1, figsize=(8, 6))

ax1.plot(x, np.sin(x), label='Sin')
ax1.plot(x, np.sin(2*x), label='Sin(2x)')
ax2.plot(x, np.cos(x), label='Cos')
ax2.plot(x, np.cos(2*x), label='Cos(2x)')

plt.figlegend(loc='center left', bbox_to_anchor=(1, 0.5), ncol=1)
plt.suptitle('Multiple series with figlegend() - how2matplotlib.com')
plt.tight_layout()
plt.show()
Output:
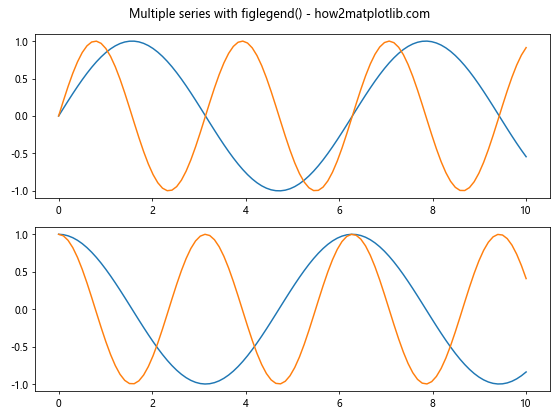
在这个例子中,我们在两个子图中各绘制了两条曲线,然后使用figlegend()创建了一个包含所有四条曲线的统一图例。
4. 自定义图例样式
figlegend()函数允许你高度自定义图例的样式。你可以更改图例的背景颜色、边框颜色、文本颜色等。以下是一个展示如何自定义图例样式的例子:
import matplotlib.pyplot as plt
import numpy as np

x = np.linspace(0, 10, 100)
fig, ax = plt.subplots(figsize=(8, 6))

ax.plot(x, np.sin(x), label='Sin')
ax.plot(x, np.cos(x), label='Cos')

legend = plt.figlegend(loc='upper right', fancybox=True, shadow=True,
                       facecolor='lightblue', edgecolor='darkblue')
plt.setp(legend.get_texts(), color='navy')
plt.suptitle('Styled figlegend() - how2matplotlib.com')
plt.tight_layout()
plt.show()
Output:
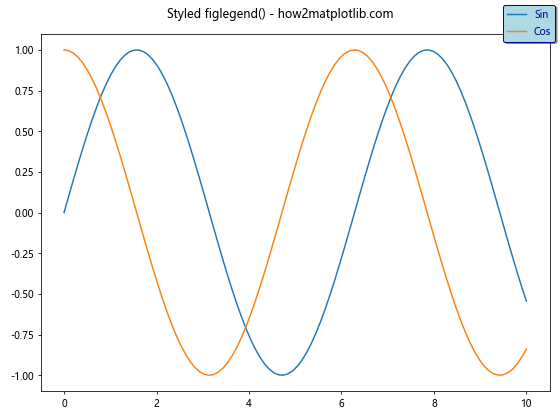
在这个例子中,我们为图例添加了阴影效果,设置了背景颜色和边框颜色,并更改了文本颜色。这些自定义选项可以帮助你创建更具视觉吸引力的图例。
5. 图例中的标记和线条样式
在某些情况下,你可能想要在图例中显示特定的标记或线条样式。figlegend()函数允许你自定义这些元素。下面是一个展示如何在图例中使用不同标记和线条样式的例子:
import matplotlib.pyplot as plt
import numpy as np

x = np.linspace(0, 10, 100)
fig, ax = plt.subplots(figsize=(8, 6))

ax.plot(x, np.sin(x), 'r-', label='Sin')
ax.plot(x, np.cos(x), 'b--', label='Cos')
ax.plot(x, np.tan(x), 'g:', label='Tan')

plt.figlegend(loc='upper right', numpoints=1, markerscale=1.2,
              handlelength=3, handletextpad=0.5)
plt.suptitle('Custom markers in figlegend() - how2matplotlib.com')
plt.tight_layout()
plt.show()
Output:
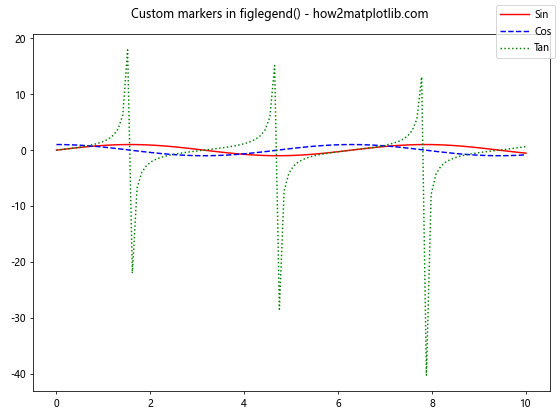
在这个例子中,我们使用了不同的线条样式和颜色来绘制三个三角函数。在figlegend()中,我们使用了numpoints参数来控制每个图例条目显示的点数,markerscale参数来调整标记的大小,handlelength参数来设置线条长度,以及handletextpad参数来调整文本和线条之间的间距。
6. 图例的位置调整
figlegend()函数提供了多种方法来精确控制图例的位置。除了使用loc参数外,你还可以使用bbox_to_anchor参数来更精细地调整位置。以下是一个展示如何使用bbox_to_anchor的例子:
import matplotlib.pyplot as plt
import numpy as np

x = np.linspace(0, 10, 100)
fig, (ax1, ax2) = plt.subplots(2, 1, figsize=(8, 6))

ax1.plot(x, np.sin(x), label='Sin')
ax2.plot(x, np.cos(x), label='Cos')

plt.figlegend(loc='center left', bbox_to_anchor=(1, 0.5),
              bbox_transform=plt.gcf().transFigure)
plt.suptitle('Precise positioning with figlegend() - how2matplotlib.com')
plt.tight_layout()
plt.show()
Output:
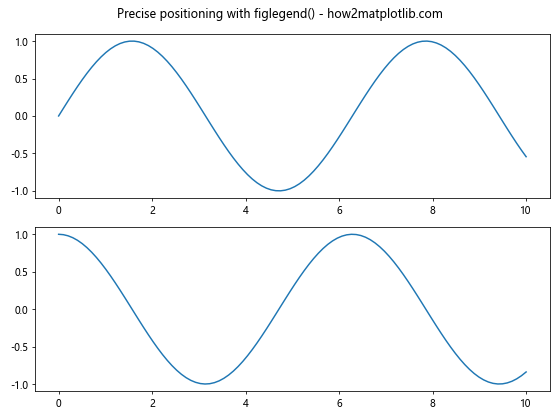
在这个例子中,我们使用bbox_to_anchor参数将图例放置在图形的右侧中央。bbox_transform=plt.gcf().transFigure确保坐标是相对于整个图形的。
7. 处理重叠的图例
当你有多个子图时,可能会遇到图例重叠的问题。figlegend()函数可以帮助你解决这个问题,通过创建一个统一的图例。以下是一个处理重叠图例的例子:
import matplotlib.pyplot as plt
import numpy as np

x = np.linspace(0, 10, 100)
fig, ((ax1, ax2), (ax3, ax4)) = plt.subplots(2, 2, figsize=(10, 8))

ax1.plot(x, np.sin(x), label='Sin')
ax2.plot(x, np.cos(x), label='Cos')
ax3.plot(x, np.tan(x), label='Tan')
ax4.plot(x, np.exp(x), label='Exp')

plt.figlegend(loc='lower center', ncol=4, bbox_to_anchor=(0.5, 0))
plt.suptitle('Handling overlapping legends - how2matplotlib.com')
plt.tight_layout()
plt.subplots_adjust(bottom=0.2)
plt.show()
Output:
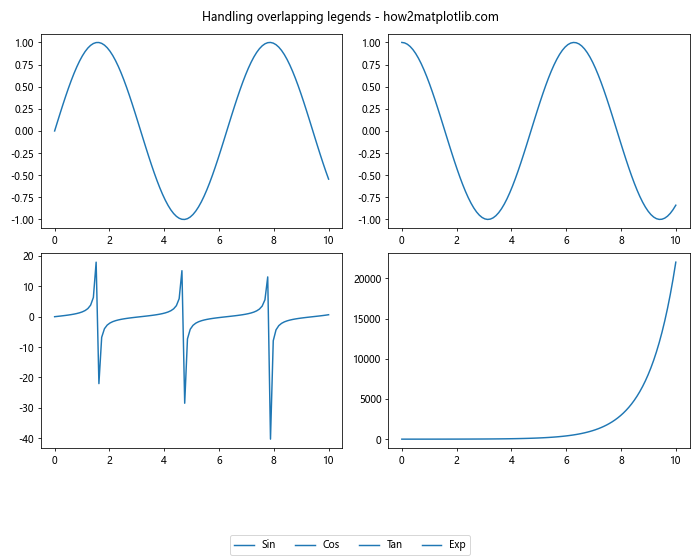
在这个例子中,我们创建了四个子图,每个子图都有自己的数据系列。然后,我们使用figlegend()在图形的底部中央创建了一个统一的图例,使用ncol参数将图例排列成四列。
8. 图例的动态更新
在某些情况下,你可能需要动态更新图例。figlegend()函数允许你这样做。以下是一个展示如何动态更新图例的例子:
import matplotlib.pyplot as plt
import numpy as np

x = np.linspace(0, 10, 100)
fig, ax = plt.subplots(figsize=(8, 6))

line1, = ax.plot(x, np.sin(x), label='Sin')
line2, = ax.plot(x, np.cos(x), label='Cos')

legend = plt.figlegend(loc='upper right')

# 更新图例
line1.set_label('Updated Sin')
line2.set_label('Updated Cos')
legend.remove()
plt.figlegend(loc='upper right')

plt.suptitle('Dynamic legend update - how2matplotlib.com')
plt.tight_layout()
plt.show()
Output:
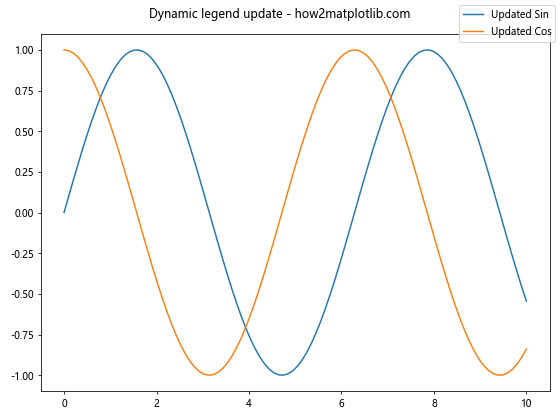
在这个例子中,我们首先创建了一个图例,然后更新了线条的标签,移除了旧的图例,并创建了一个新的图例。这种方法允许你在程序运行时动态更新图例。
9. 图例中的自定义句柄
有时,你可能想在图例中使用自定义的句柄(handles)。figlegend()函数允许你这样做。以下是一个使用自定义句柄的例子:
import matplotlib.pyplot as plt
import matplotlib.patches as mpatches

fig, ax = plt.subplots(figsize=(8, 6))

red_patch = mpatches.Patch(color='red', label='Red Data')
blue_patch = mpatches.Patch(color='blue', label='Blue Data')

plt.figlegend(handles=[red_patch, blue_patch], loc='upper right')
plt.suptitle('Custom handles in figlegend() - how2matplotlib.com')
plt.tight_layout()
plt.show()
Output:
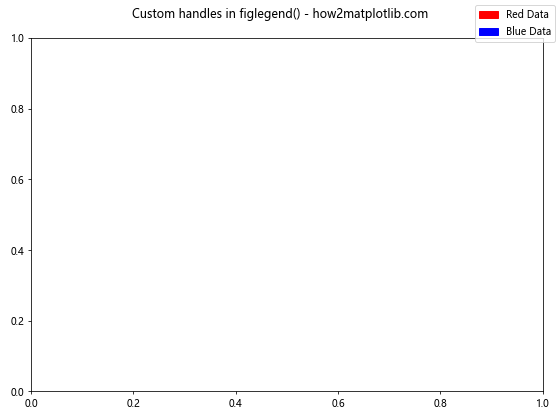
在这个例子中,我们创建了两个自定义的色块作为图例的句柄,而不是使用实际的数据系列。这在你想创建一个不直接对应于绘图数据的图例时非常有用。
10. 图例的字体和文本样式
figlegend()函数还允许你自定义图例中的字体和文本样式。以下是一个展示如何更改字体和文本样式的例子:
import matplotlib.pyplot as plt
import numpy as np

x = np.linspace(0, 10, 100)
fig, ax = plt.subplots(figsize=(8, 6))

ax.plot(x, np.sin(x), label='Sin')
ax.plot(x, np.cos(x), label='Cos')

legend = plt.figlegend(loc='upper right', prop={'family': 'serif', 'size': 12, 'style': 'italic'})
plt.setp(legend.get_texts(), color='navy')

plt.suptitle('Custom font in figlegend() - how2matplotlib.com')
plt.tight_layout()
plt.show()
Output:
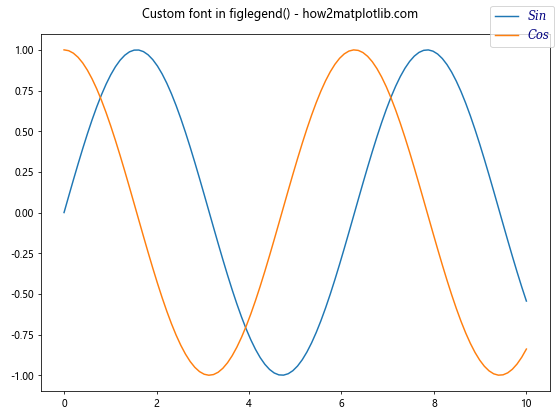
在这个例子中,我们使用prop参数来设置字体系列、大小和样式。我们还使用plt.setp()函数来更改文本颜色。
11. 图例的透明度
在某些情况下,你可能想要调整图例的透明度,以便不遮挡底层的图形元素。figlegend()函数允许你设置图例的透明度。以下是一个例子:
import matplotlib.pyplot as plt
import numpy as np

x = np.linspace(0, 10, 100)
fig, ax = plt.subplots(figsize=(8, 6))

ax.plot(x, np.sin(x), label='Sin')
ax.plot(x, np.cos(x), label='Cos')

plt.figlegend(loc='center', bbox_to_anchor=(0.5, 0.5),
              fancybox=True, shadow=True, ncol=2,
              framealpha=0.5)  # 设置透明度为0.5

plt.suptitle('Transparent legend - how2matplotlib.com')
plt.tight_layout()
plt.show()
Output:
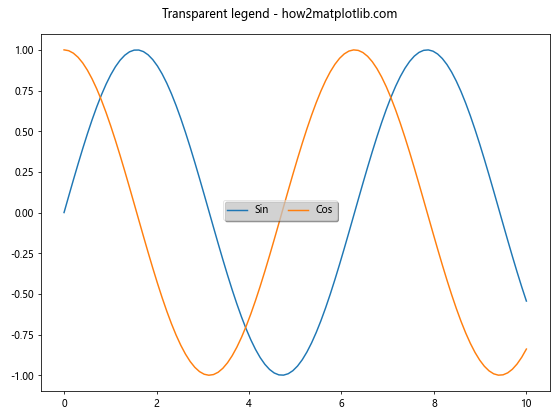
在这个例子中,我们使用framealpha参数将图例的透明度设置为0.5。这使得图例半透明,可以看到背后的图形内容。
12. 图例的边框样式
figlegend()函数还允许你自定义图例的边框样式。你可以更改边框的线型、颜色和宽度。以下是一个展示如何自定义边框样式的例子:
import matplotlib.pyplot as plt
import numpy as np

x = np.linspace(0, 10, 100)
fig, ax = plt.subplots(figsize=(8, 6))

ax.plot(x, np.sin(x), label='Sin')
ax.plot(x, np.cos(x), label='Cos')

legend = plt.figlegend(loc='upper right', frameon=True)
frame = legend.get_frame()
frame.set_edgecolor('red')
frame.set_linewidth(2)
frame.set_linestyle(':')

plt.suptitle('Custom border style in figlegend() - how2matplotlib.com')
plt.tight_layout()
plt.show()
Output:
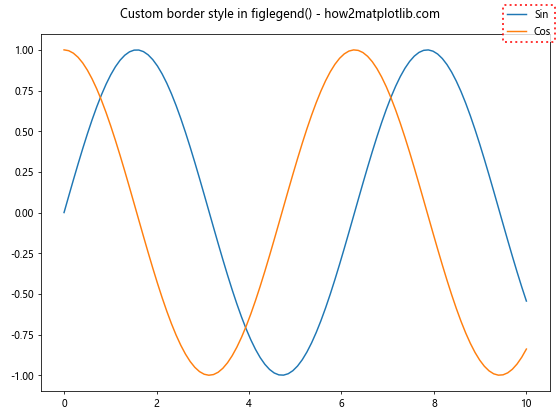
在这个例子中,我们首先获取图例的框架对象,然后使用set_edgecolor()、set_linewidth()和set_linestyle()方法来自定义边框的颜色、宽度和线型。
13. 图例中的数学公式
Matplotlib支持在图例中使用LaTeX格式的数学公式。这在绘制科学或工程图表时特别有用。以下是一个在图例中使用数学公式的例子:
import matplotlib.pyplot as plt
import numpy as np

x = np.linspace(0, 10, 100)
fig, ax = plt.subplots(figsize=(8, 6))

ax.plot(x, np.sin(x), label=r'\sin(x)')
ax.plot(x, np.cos(x), label=r'\cos(x)')
ax.plot(x, np.tan(x), label=r'\tan(x)')

plt.figlegend(loc='upper right')
plt.suptitle('Math formulas in figlegend() - how2matplotlib.com')
plt.tight_layout()
plt.show()
Output:
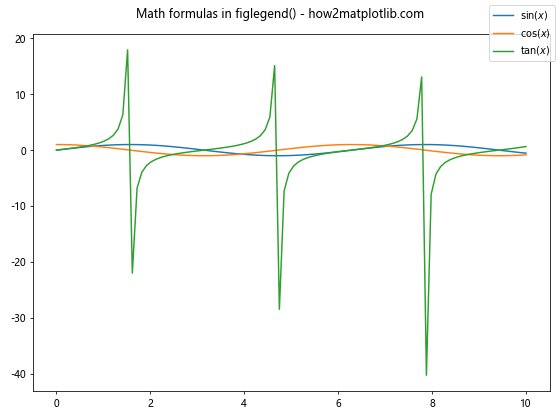
在这个例子中,我们使用r’…‘语法来在图例标签中包含LaTeX格式的数学公式。Matplotlib会自动渲染这些公式。
14. 图例的分组
在某些情况下,你可能想要将图例项分组。虽然figlegend()本身不直接支持分组,但你可以通过创建多个图例来实现这一效果。以下是一个例子:
import matplotlib.pyplot as plt
import numpy as np

x = np.linspace(0, 10, 100)
fig, ax = plt.subplots(figsize=(8, 6))

line1, = ax.plot(x, np.sin(x), 'r-', label='Sin')
line2, = ax.plot(x, np.cos(x), 'b-', label='Cos')
line3, = ax.plot(x, np.exp(x), 'g-', label='Exp')
line4, = ax.plot(x, np.log(x), 'm-', label='Log')

# 创建两个分组的图例
legend1 = plt.figlegend([line1, line2], ['Sin', 'Cos'], loc='upper left', title='Trigonometric')
legend2 = plt.figlegend([line3, line4], ['Exp', 'Log'], loc='upper right', title='Other')

plt.suptitle('Grouped legends - how2matplotlib.com')
plt.tight_layout()
plt.show()
Output:
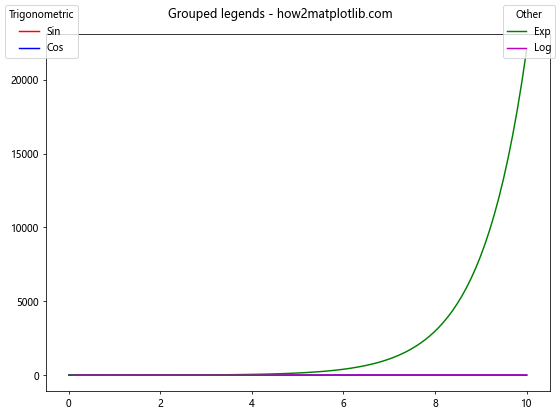
在这个例子中,我们创建了两个单独的图例,每个图例包含两个数据系列。这样我们就实现了图例的分组效果。
15. 图例的交互性
Matplotlib允许你创建交互式的图例,用户可以通过点击图例项来切换相应数据系列的可见性。以下是一个创建交互式图例的例子:
import matplotlib.pyplot as plt
import numpy as np

x = np.linspace(0, 10, 100)
fig, ax = plt.subplots(figsize=(8, 6))

lines = []
lines.append(ax.plot(x, np.sin(x), label='Sin')[0])
lines.append(ax.plot(x, np.cos(x), label='Cos')[0])
lines.append(ax.plot(x, np.tan(x), label='Tan')[0])

legend = plt.figlegend(loc='upper right')

def on_pick(event):
    legline = event.artist
    origline = lined[legline]
    visible = not origline.get_visible()
    origline.set_visible(visible)
    legline.set_alpha(1.0 if visible else 0.2)
    fig.canvas.draw()

lined = dict()
for legline, origline in zip(legend.get_lines(), lines):
    legline.set_picker(True)
    lined[legline] = origline

fig.canvas.mpl_connect('pick_event', on_pick)

plt.suptitle('Interactive legend - how2matplotlib.com')
plt.tight_layout()
plt.show()
Output:
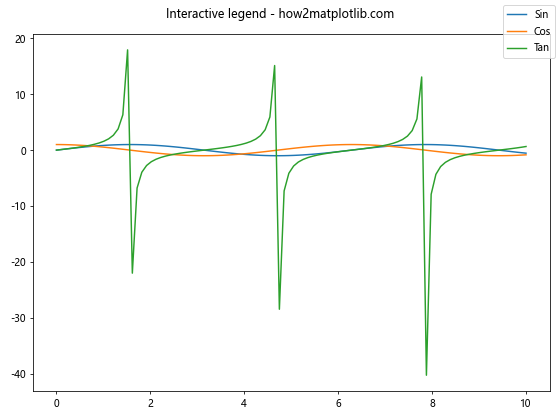
在这个例子中,我们为图例添加了交互功能。用户可以通过点击图例项来切换相应数据系列的可见性。这是通过设置图例线条的picker属性和连接pick_event来实现的。
16. 图例的动画效果
你还可以为图例添加动画效果。虽然figlegend()本身不直接支持动画,但你可以通过更新图例的内容来创建动画效果。以下是一个简单的例子:
import matplotlib.pyplot as plt
import numpy as np
from matplotlib.animation import FuncAnimation

fig, ax = plt.subplots(figsize=(8, 6))
x = np.linspace(0, 2*np.pi, 100)
line, = ax.plot(x, np.sin(x))

legend = plt.figlegend([line], ['Sin(x)'], loc='upper right')

def update(frame):
    line.set_ydata(np.sin(x + frame/10))
    legend.texts[0].set_text(f'Sin(x + {frame/10:.2f})')
    return line, legend.texts[0]

ani = FuncAnimation(fig, update, frames=np.linspace(0, 2*np.pi, 128),
                    blit=True, interval=50)

plt.suptitle('Animated legend - how2matplotlib.com')
plt.tight_layout()
plt.show()
Output:
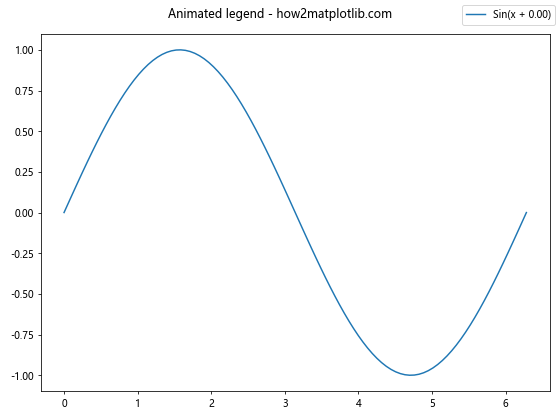
在这个例子中,我们创建了一个简单的正弦波动画,并在每一帧更新图例的文本内容。这创造了一个图例也在”动”的效果。
总结
Matplotlib.pyplot.figlegend()函数是一个强大而灵活的工具,用于在整个图形上创建和自定义图例。通过本文的详细介绍和丰富的示例,我们探索了figlegend()函数的多种用法,包括基本使用、参数调整、样式自定义、位置控制、动态更新、处理多个数据系列、使用自定义句柄、字体样式设置、透明度调整、边框样式修改、数学公式支持、图例分组、交互性添加以及动画效果创建等。
这些技巧和方法可以帮助你创建更加专业、信息丰富且视觉吸引力强的图表。无论是简单的数据可视化还是复杂的科学图表,figlegend()函数都能满足你的需求。通过灵活运用这些技巧,你可以大大提升你的数据展示能力,使你的图表更加清晰、美观且富有信息量。
记住,图例是图表中非常重要的元素,它能帮助读者快速理解图表中各个数据系列的含义。通过合理使用figlegend()函数,你可以确保你的图表不仅美观,而且易于理解和解释。在实际应用中,根据具体需求和数据特性,灵活运用这些技巧,你将能够创建出更加专业和有效的数据可视化作品。
 极客笔记
极客笔记