Matplotlib.pyplot.autoscale():自动调整坐标轴范围的强大工具
参考:Matplotlib.pyplot.autoscale() in Python
Matplotlib是Python中最流行的数据可视化库之一,而pyplot是Matplotlib中的一个模块,提供了类似MATLAB的绘图接口。在pyplot中,autoscale()函数是一个非常有用的工具,它可以自动调整坐标轴的范围,以确保所有数据点都能被正确显示。本文将深入探讨autoscale()函数的使用方法、参数选项以及在不同场景下的应用。
1. autoscale()函数的基本用法
autoscale()函数的基本用法非常简单。默认情况下,它会自动调整x轴和y轴的范围,以适应所有数据点。
import matplotlib.pyplot as plt
import numpy as np

x = np.linspace(0, 10, 100)
y = np.sin(x)

plt.plot(x, y, label='sin(x)')
plt.title('How2matplotlib.com: Basic Autoscale Example')
plt.autoscale()
plt.legend()
plt.show()
Output:
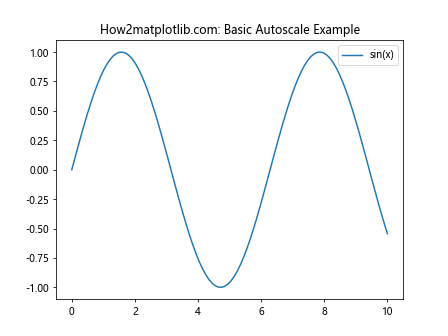
在这个例子中,我们绘制了一个简单的正弦函数图。plt.autoscale()被调用以确保所有数据点都能被正确显示。这个函数会自动计算x轴和y轴的合适范围,使得整个图形看起来更加美观。
2. 控制特定轴的自动缩放
autoscale()函数允许我们指定要自动缩放的轴。我们可以通过axis参数来控制这一点。
import matplotlib.pyplot as plt
import numpy as np

x = np.linspace(0, 10, 100)
y = np.exp(x)

plt.plot(x, y, label='exp(x)')
plt.title('How2matplotlib.com: Autoscale on Y-axis Only')
plt.autoscale(axis='y')
plt.xlim(0, 5)  # 手动设置x轴范围
plt.legend()
plt.show()
Output:
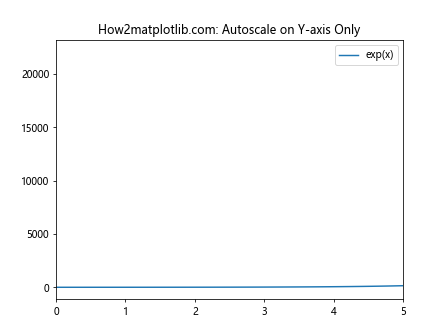
在这个例子中,我们只对y轴应用了自动缩放,而x轴的范围是手动设置的。这种方法在我们想要强调某个特定区域的数据时非常有用。
3. 启用或禁用自动缩放
autoscale()函数还可以用来启用或禁用自动缩放功能。这可以通过enable参数来控制。
import matplotlib.pyplot as plt
import numpy as np

x = np.linspace(0, 10, 100)
y = np.cos(x)

plt.plot(x, y, label='cos(x)')
plt.title('How2matplotlib.com: Disable Autoscale')
plt.autoscale(enable=False)
plt.ylim(-2, 2)  # 手动设置y轴范围
plt.legend()
plt.show()
Output:
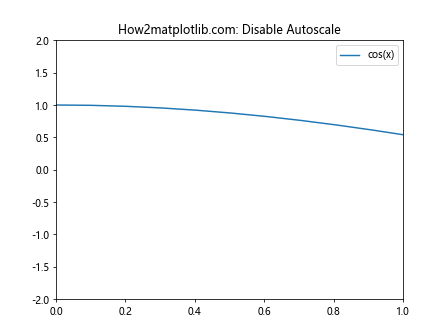
在这个例子中,我们禁用了自动缩放功能,并手动设置了y轴的范围。这在我们想要精确控制图形显示范围时非常有用。
4. 紧密自动缩放
autoscale()函数还有一个tight参数,当设置为True时,它会尝试将坐标轴范围设置得尽可能紧密,以减少图形中的空白区域。
import matplotlib.pyplot as plt
import numpy as np

x = np.linspace(0, 10, 100)
y = np.tan(x)

plt.plot(x, y, label='tan(x)')
plt.title('How2matplotlib.com: Tight Autoscale')
plt.autoscale(tight=True)
plt.legend()
plt.show()
Output:
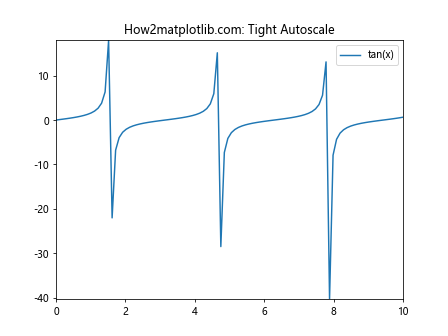
这个例子展示了紧密自动缩放的效果。它会尽量减少图形边缘的空白区域,使得数据点更加紧凑地显示。
5. 自动缩放与数据更新
当我们在绘图过程中动态添加新的数据点时,autoscale()函数可以帮助我们自动调整坐标轴范围。
import matplotlib.pyplot as plt
import numpy as np

plt.figure()
plt.title('How2matplotlib.com: Autoscale with Data Updates')

for i in range(5):
    x = np.linspace(0, 10, 100)
    y = np.sin(x) + i
    plt.plot(x, y, label=f'sin(x) + {i}')
    plt.autoscale()
    plt.legend()
    plt.pause(0.5)

plt.show()
Output:
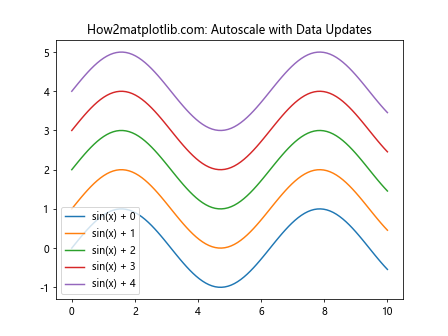
这个例子展示了如何在添加新的数据系列时使用autoscale()。每次添加新的曲线后,坐标轴范围都会自动调整以适应所有数据。
6. 自动缩放与子图
当我们使用子图时,autoscale()函数可以应用于单个子图或所有子图。
import matplotlib.pyplot as plt
import numpy as np

fig, (ax1, ax2) = plt.subplots(2, 1, figsize=(8, 8))
fig.suptitle('How2matplotlib.com: Autoscale with Subplots')

x = np.linspace(0, 10, 100)
y1 = np.sin(x)
y2 = np.cos(x)

ax1.plot(x, y1, label='sin(x)')
ax1.autoscale(tight=True)
ax1.legend()

ax2.plot(x, y2, label='cos(x)')
ax2.autoscale(axis='y')
ax2.set_xlim(0, 5)
ax2.legend()

plt.tight_layout()
plt.show()
Output:
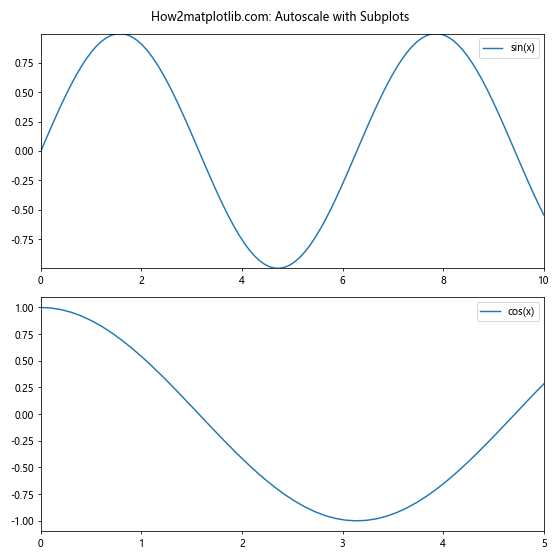
在这个例子中,我们对两个子图分别应用了不同的自动缩放设置。第一个子图使用了紧密自动缩放,而第二个子图只对y轴进行了自动缩放。
7. 自动缩放与对数刻度
autoscale()函数也可以与对数刻度一起使用,以适应具有大范围变化的数据。
import matplotlib.pyplot as plt
import numpy as np

x = np.logspace(0, 5, 100)
y = x**2

plt.figure()
plt.loglog(x, y, label='y = x^2')
plt.title('How2matplotlib.com: Autoscale with Log Scale')
plt.autoscale()
plt.legend()
plt.grid(True)
plt.show()
Output:
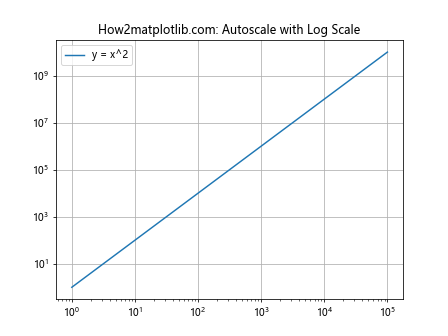
这个例子展示了如何在对数刻度图中使用autoscale()。它会自动调整坐标轴范围以适应对数刻度下的数据分布。
8. 自动缩放与极坐标图
autoscale()函数也可以应用于极坐标图,以确保所有数据点都能被正确显示。
import matplotlib.pyplot as plt
import numpy as np

theta = np.linspace(0, 2*np.pi, 100)
r = np.sin(5*theta)

plt.figure()
ax = plt.subplot(111, projection='polar')
ax.plot(theta, r)
ax.set_title('How2matplotlib.com: Autoscale in Polar Coordinates')
ax.autoscale()
plt.show()
Output:
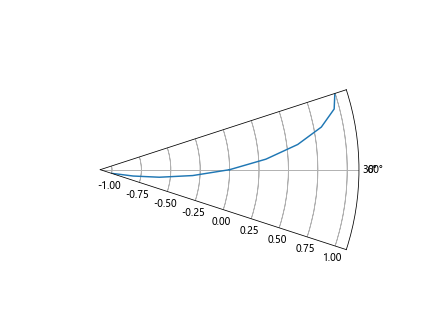
这个例子展示了如何在极坐标图中使用autoscale()。它会自动调整半径和角度的范围以适应所有数据点。
9. 自动缩放与多个数据系列
当我们在同一个图中绘制多个数据系列时,autoscale()函数会考虑所有数据系列来调整坐标轴范围。
import matplotlib.pyplot as plt
import numpy as np

x = np.linspace(0, 10, 100)
y1 = np.sin(x)
y2 = np.cos(x)
y3 = np.tan(x)

plt.figure()
plt.plot(x, y1, label='sin(x)')
plt.plot(x, y2, label='cos(x)')
plt.plot(x, y3, label='tan(x)')
plt.title('How2matplotlib.com: Autoscale with Multiple Series')
plt.autoscale()
plt.legend()
plt.show()
Output:
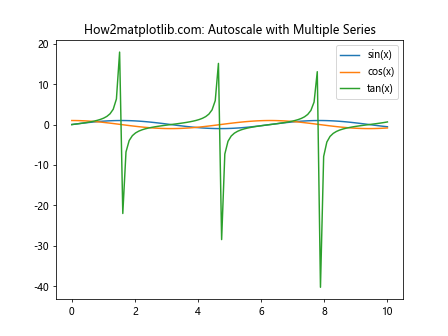
在这个例子中,autoscale()函数会考虑所有三个数据系列(正弦、余弦和正切函数)来确定合适的坐标轴范围。
10. 自动缩放与填充图
autoscale()函数也可以与填充图一起使用,以确保所有填充区域都能被正确显示。
import matplotlib.pyplot as plt
import numpy as np

x = np.linspace(0, 10, 100)
y1 = np.sin(x)
y2 = np.sin(x) + 0.5

plt.figure()
plt.fill_between(x, y1, y2, alpha=0.5, label='Filled region')
plt.plot(x, y1, label='sin(x)')
plt.plot(x, y2, label='sin(x) + 0.5')
plt.title('How2matplotlib.com: Autoscale with Filled Plot')
plt.autoscale()
plt.legend()
plt.show()
Output:
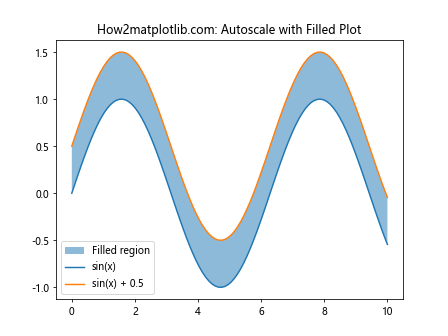
这个例子展示了如何在填充图中使用autoscale()。它会自动调整坐标轴范围以确保所有填充区域都能被完整显示。
11. 自动缩放与误差线
当我们绘制带有误差线的图形时,autoscale()函数会考虑误差线的范围来调整坐标轴。
import matplotlib.pyplot as plt
import numpy as np

x = np.linspace(0, 10, 10)
y = np.sin(x)
yerr = 0.2 * np.ones_like(x)

plt.figure()
plt.errorbar(x, y, yerr=yerr, fmt='o', label='Data with error bars')
plt.title('How2matplotlib.com: Autoscale with Error Bars')
plt.autoscale()
plt.legend()
plt.show()
Output:
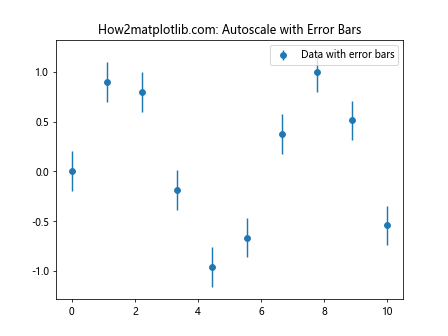
在这个例子中,autoscale()函数会考虑误差线的范围来确定y轴的合适范围,确保所有误差线都能被完整显示。
12. 自动缩放与散点图
autoscale()函数在处理散点图时也非常有用,特别是当数据点分布不均匀时。
import matplotlib.pyplot as plt
import numpy as np

np.random.seed(42)
x = np.random.rand(100) * 10
y = np.random.rand(100) * 10

plt.figure()
plt.scatter(x, y, alpha=0.5)
plt.title('How2matplotlib.com: Autoscale with Scatter Plot')
plt.autoscale(tight=True)
plt.show()
Output:
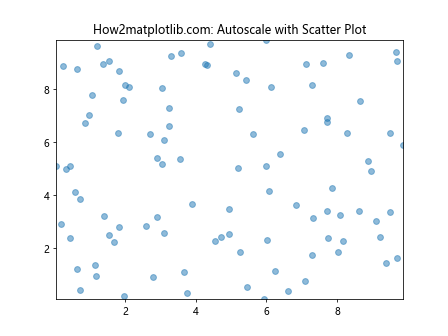
这个例子展示了如何在散点图中使用autoscale()。它会自动调整坐标轴范围以适应所有散点,同时尽量减少图形边缘的空白区域。
13. 自动缩放与柱状图
对于柱状图,autoscale()函数会考虑柱子的高度来调整y轴范围。
import matplotlib.pyplot as plt
import numpy as np

categories = ['A', 'B', 'C', 'D', 'E']
values = np.random.randint(1, 100, size=5)

plt.figure()
plt.bar(categories, values)
plt.title('How2matplotlib.com: Autoscale with Bar Plot')
plt.autoscale()
plt.show()
Output:
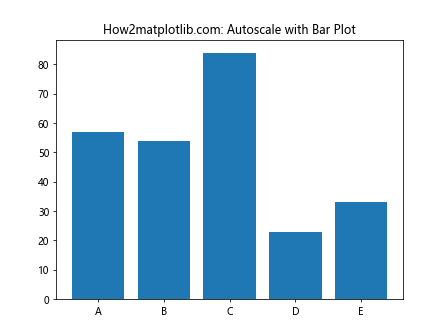
在这个例子中,autoscale()函数会自动调整y轴范围以适应所有柱子的高度。
14. 自动缩放与3D图
autoscale()函数也可以应用于3D图,以确保所有数据点都能被正确显示。
import matplotlib.pyplot as plt
import numpy as np
from mpl_toolkits.mplot3d import Axes3D

fig = plt.figure()
ax = fig.add_subplot(111, projection='3d')

x = np.linspace(-5, 5, 100)
y = np.linspace(-5, 5, 100)
X, Y = np.meshgrid(x, y)
Z = np.sin(np.sqrt(X**2 + Y**2))

ax.plot_surface(X, Y, Z)
ax.set_title('How2matplotlib.com: Autoscale with 3D Plot')
ax.autoscale()
plt.show()
Output:
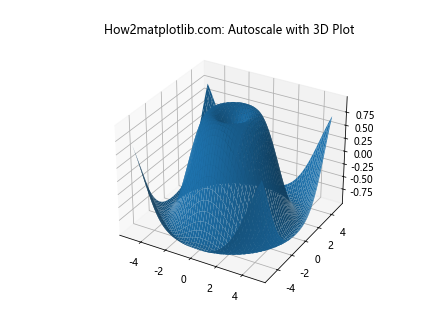
这个例子展示了如何在3D图中使用autoscale()。它会自动调整x、y和z轴的范围以适应所有数据点。
15. 自动缩放与动画
在创建动画时,autoscale()函数可以帮助我们在每一帧更新后调整坐标轴范围。
import matplotlib.pyplot as plt
import numpy as np
from matplotlib.animation import FuncAnimation

fig, ax = plt.subplots()
x = np.linspace(0, 2*np.pi, 100)
line, = ax.plot(x, np.sin(x))

def update(frame):
    y = np.sin(x + frame/10)
    line.set_ydata(y)
    ax.autoscale()
    ax.set_title(f'How2matplotlib.com: Frame {frame}')
    return line,

ani = FuncAnimation(fig, update, frames=range(100), blit=True)
plt.show()
Output:
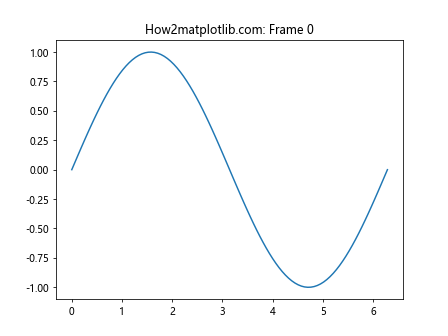
这个例子展示了如何在动画中使用autoscale()。在每一帧更新后,autoscale()函数会重新调整y轴范围以适应新的数据。
结论
Matplotlib.pyplot.autoscale()是一个强大而灵活的工具,可以帮助我们自动调整坐标轴范围,以确保所有数据点都能被正确显示。无论是在简单的2D图形还是复杂的3D图形中,无论是静态图还是动画,autoscale()都能发挥重要作用。通过合理使用autoscale()函数,我们可以创建更加美观、信息丰富的可视化图表。
以下是一些使用autoscale()函数时的注意事项和高级技巧:
16. 自动缩放与坐标轴限制
有时,我们可能希望在使用autoscale()的同时,对坐标轴的范围进行一些限制。这可以通过结合使用autoscale()和set_xlim()或set_ylim()来实现。
import matplotlib.pyplot as plt
import numpy as np

x = np.linspace(0, 10, 100)
y = np.sin(x)

plt.figure()
plt.plot(x, y)
plt.title('How2matplotlib.com: Autoscale with Axis Limits')
plt.autoscale()
plt.ylim(-0.5, 0.5)  # 限制y轴范围
plt.show()
Output:
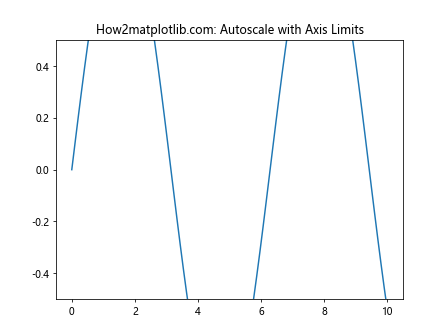
在这个例子中,我们首先使用autoscale()自动调整坐标轴范围,然后使用ylim()限制y轴的范围。这种方法可以让我们在保持自动缩放灵活性的同时,对图形的显示范围进行精确控制。
17. 自动缩放与不同的坐标系
autoscale()函数不仅可以用于笛卡尔坐标系,还可以应用于其他坐标系,如半对数坐标系或双对数坐标系。
import matplotlib.pyplot as plt
import numpy as np

x = np.logspace(0, 5, 100)
y = x**2

fig, (ax1, ax2) = plt.subplots(1, 2, figsize=(12, 5))
fig.suptitle('How2matplotlib.com: Autoscale in Different Coordinate Systems')

ax1.semilogx(x, y)
ax1.set_title('Semi-log Plot')
ax1.autoscale()

ax2.loglog(x, y)
ax2.set_title('Log-log Plot')
ax2.autoscale()

plt.tight_layout()
plt.show()
Output:
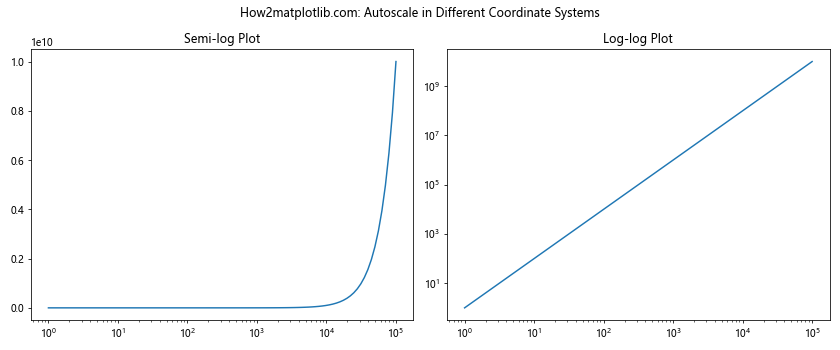
这个例子展示了如何在半对数图和双对数图中使用autoscale()。无论是哪种坐标系,autoscale()都能正确地调整坐标轴范围。
18. 自动缩放与多个Y轴
当我们使用多个Y轴时,autoscale()函数可以分别应用于每个轴。
import matplotlib.pyplot as plt
import numpy as np

x = np.linspace(0, 10, 100)
y1 = np.sin(x)
y2 = np.exp(x/10)

fig, ax1 = plt.subplots()
ax1.set_title('How2matplotlib.com: Autoscale with Multiple Y-axes')

color = 'tab:red'
ax1.set_xlabel('x')
ax1.set_ylabel('sin(x)', color=color)
ax1.plot(x, y1, color=color)
ax1.tick_params(axis='y', labelcolor=color)
ax1.autoscale()

ax2 = ax1.twinx()  # 创建共享x轴的第二个y轴
color = 'tab:blue'
ax2.set_ylabel('exp(x/10)', color=color)
ax2.plot(x, y2, color=color)
ax2.tick_params(axis='y', labelcolor=color)
ax2.autoscale()

fig.tight_layout()
plt.show()
Output:
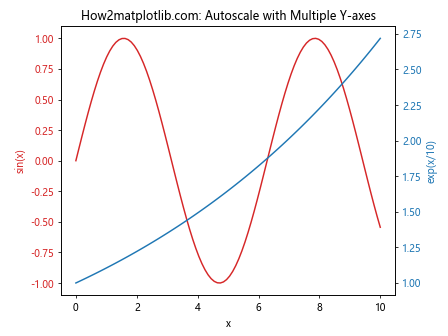
在这个例子中,我们创建了两个Y轴,并分别对它们应用autoscale()。这样可以确保两组数据都能在各自的Y轴上得到合适的显示。
19. 自动缩放与图例位置
autoscale()函数在调整坐标轴范围时,也会考虑图例的位置,以确保图例不会遮挡重要的数据点。
import matplotlib.pyplot as plt
import numpy as np

x = np.linspace(0, 10, 100)
y1 = np.sin(x)
y2 = np.cos(x)

plt.figure()
plt.plot(x, y1, label='sin(x)')
plt.plot(x, y2, label='cos(x)')
plt.title('How2matplotlib.com: Autoscale with Legend')
plt.legend(loc='best')
plt.autoscale()
plt.show()
Output:
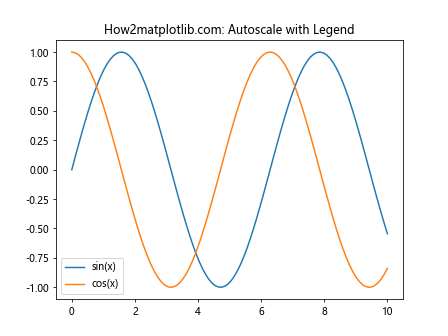
在这个例子中,我们使用legend(loc='best')让Matplotlib自动选择最佳的图例位置,然后使用autoscale()调整坐标轴范围。autoscale()会考虑图例的位置,确保它不会遮挡重要的数据点。
20. 自动缩放与自定义函数
我们还可以创建自定义函数来实现更复杂的自动缩放行为。
import matplotlib.pyplot as plt
import numpy as np

def custom_autoscale(ax, margin=0.1):
    """自定义自动缩放函数,在数据范围的基础上添加一定的边距"""
    x_min, x_max = ax.get_xlim()
    y_min, y_max = ax.get_ylim()

    x_range = x_max - x_min
    y_range = y_max - y_min

    ax.set_xlim(x_min - margin * x_range, x_max + margin * x_range)
    ax.set_ylim(y_min - margin * y_range, y_max + margin * y_range)

x = np.linspace(0, 10, 100)
y = np.sin(x)

fig, ax = plt.subplots()
ax.plot(x, y)
ax.set_title('How2matplotlib.com: Custom Autoscale Function')
ax.autoscale()
custom_autoscale(ax, margin=0.2)
plt.show()
Output:
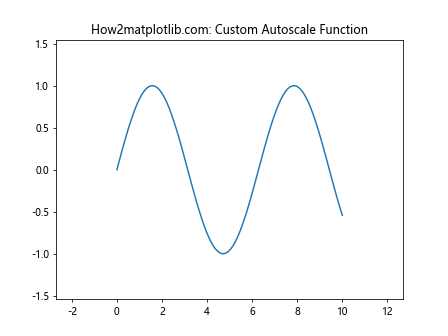
这个例子展示了如何创建一个自定义的自动缩放函数。这个函数在原有的数据范围基础上添加了一定的边距,使得图形看起来更加美观。
结论
Matplotlib.pyplot.autoscale()是一个强大而灵活的工具,可以帮助我们自动调整坐标轴范围,以确保所有数据点都能被正确显示。通过本文的详细介绍和丰富的示例,我们可以看到autoscale()函数在各种不同类型的图表中的应用,以及如何根据具体需求来调整其行为。
无论是简单的2D图形还是复杂的3D图形,无论是静态图还是动画,autoscale()都能发挥重要作用。它不仅可以让我们的图表更加美观,还能确保我们不会遗漏任何重要的数据点。
在实际应用中,我们可能需要根据具体情况来决定是否使用autoscale(),或者如何与其他函数结合使用。例如,在某些情况下,我们可能希望手动设置坐标轴范围以强调特定的数据区域;而在其他情况下,我们可能希望让autoscale()自动处理,以便快速探索数据的整体分布。
最后,值得注意的是,虽然autoscale()非常有用,但它并不是万能的。在某些复杂的可视化场景中,我们可能需要结合其他技术或创建自定义函数来实现更精细的控制。因此,深入理解autoscale()的工作原理和限制,将有助于我们在数据可视化过程中做出更明智的决策。
通过合理使用autoscale()函数,我们可以创建更加美观、信息丰富的可视化图表,从而更好地理解和展示我们的数据。
 极客笔记
极客笔记