Matplotlib中XAxis.get_url()函数的全面指南与应用
参考:Matplotlib.axis.XAxis.get_url() in function Python
Matplotlib是Python中最流行的数据可视化库之一,它提供了丰富的绘图功能和自定义选项。在Matplotlib中,轴(Axis)是图表的重要组成部分,而XAxis.get_url()函数则是与X轴相关的一个特殊方法。本文将深入探讨XAxis.get_url()函数的用法、特点及其在Python数据可视化中的应用。
1. XAxis.get_url()函数简介
XAxis.get_url()是Matplotlib库中axis模块下XAxis类的一个方法。这个函数的主要作用是获取与X轴相关联的URL。在Matplotlib中,我们可以为轴设置URL,这通常用于创建交互式图表,使得用户可以通过点击轴的某些部分来访问相关的网页或资源。
让我们从一个简单的示例开始:
import matplotlib.pyplot as plt

fig, ax = plt.subplots()
ax.plot([1, 2, 3, 4], [1, 4, 2, 3])
ax.xaxis.set_url("https://how2matplotlib.com")
url = ax.xaxis.get_url()
print(f"X轴的URL是: {url}")
plt.show()
Output:
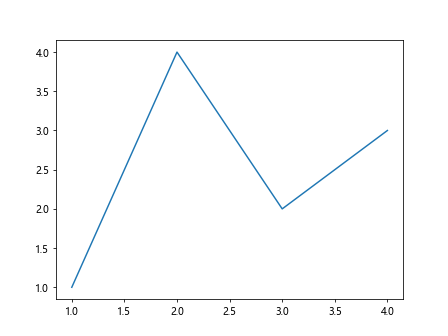
在这个例子中,我们首先创建了一个简单的线图,然后使用set_url()方法为X轴设置了一个URL。随后,我们使用get_url()方法获取并打印出这个URL。
2. XAxis.get_url()的工作原理
XAxis.get_url()函数本质上是一个getter方法,它返回之前通过set_url()方法设置的URL字符串。如果没有设置过URL,get_url()将返回None。
这个函数的工作流程如下:
- 检查XAxis对象是否有关联的URL。
- 如果有,返回该URL字符串。
- 如果没有,返回None。
让我们通过一个更详细的例子来说明这个过程:
import matplotlib.pyplot as plt

fig, (ax1, ax2) = plt.subplots(2, 1, figsize=(8, 6))

# 为第一个子图的X轴设置URL
ax1.plot([1, 2, 3, 4], [1, 4, 2, 3])
ax1.xaxis.set_url("https://how2matplotlib.com/xaxis")
url1 = ax1.xaxis.get_url()
print(f"第一个子图X轴的URL是: {url1}")

# 第二个子图的X轴不设置URL
ax2.plot([1, 2, 3, 4], [3, 1, 4, 2])
url2 = ax2.xaxis.get_url()
print(f"第二个子图X轴的URL是: {url2}")

plt.tight_layout()
plt.show()
Output:
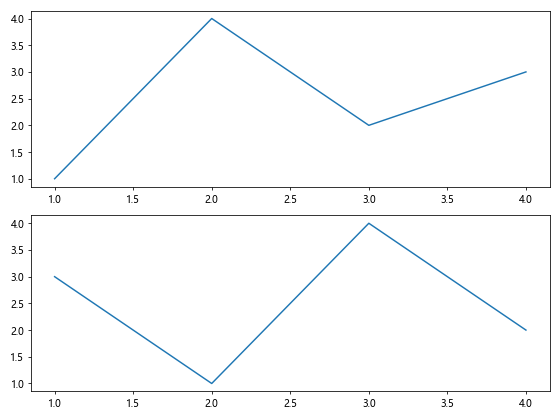
在这个例子中,我们创建了两个子图。第一个子图的X轴设置了URL,而第二个没有。通过get_url()方法,我们可以看到第一个子图返回了设置的URL,而第二个子图返回了None。
3. XAxis.get_url()的应用场景
XAxis.get_url()函数在创建交互式图表和数据可视化报告时特别有用。以下是一些常见的应用场景:
3.1 创建可点击的轴标签
我们可以为X轴设置URL,然后在保存图表为HTML或其他交互式格式时,使这些轴标签变成可点击的链接。
import matplotlib.pyplot as plt

fig, ax = plt.subplots()
ax.plot([1, 2, 3, 4], [1, 4, 2, 3])
ax.xaxis.set_url("https://how2matplotlib.com/clickable-axis")
ax.set_xlabel("点击这里查看更多信息")
plt.show()

# 在实际应用中,你需要将图表保存为支持交互的格式,如HTML
# plt.savefig("interactive_plot.html")
Output:
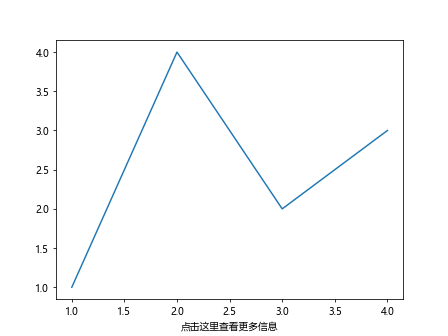
在这个例子中,我们为X轴设置了一个URL,并添加了一个提示用户点击的标签。当保存为适当的格式时,用户就可以通过点击X轴标签来访问指定的URL。
3.2 动态更新URL
在某些情况下,我们可能需要根据数据或用户交互来动态更新轴的URL。get_url()方法可以帮助我们检查当前的URL,然后决定是否需要更新。
import matplotlib.pyplot as plt

def update_url(event):
    current_url = ax.xaxis.get_url()
    if current_url != "https://how2matplotlib.com/updated":
        ax.xaxis.set_url("https://how2matplotlib.com/updated")
        print("URL已更新")
    else:
        print("URL已经是最新的")

fig, ax = plt.subplots()
ax.plot([1, 2, 3, 4], [1, 4, 2, 3])
ax.xaxis.set_url("https://how2matplotlib.com/original")

fig.canvas.mpl_connect('button_press_event', update_url)
plt.show()
Output:
这个例子演示了如何在用户点击图表时检查并更新X轴的URL。每次点击时,都会检查当前URL,如果不是更新后的URL,就会进行更新。
3.3 多轴URL管理
在复杂的图表中,我们可能需要为不同的轴设置不同的URL,并在需要时获取这些URL。
import matplotlib.pyplot as plt

fig, ((ax1, ax2), (ax3, ax4)) = plt.subplots(2, 2, figsize=(10, 8))

axes = [ax1, ax2, ax3, ax4]
urls = [
    "https://how2matplotlib.com/subplot1",
    "https://how2matplotlib.com/subplot2",
    "https://how2matplotlib.com/subplot3",
    "https://how2matplotlib.com/subplot4"
]

for ax, url in zip(axes, urls):
    ax.plot([1, 2, 3, 4], [1, 4, 2, 3])
    ax.xaxis.set_url(url)

for i, ax in enumerate(axes, 1):
    url = ax.xaxis.get_url()
    print(f"子图 {i} 的X轴URL是: {url}")

plt.tight_layout()
plt.show()
Output:
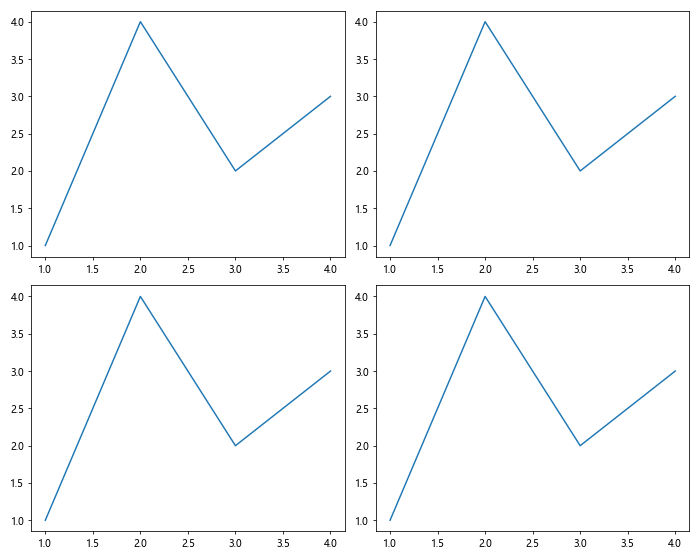
这个例子展示了如何在一个包含多个子图的图表中管理不同的URL。我们为每个子图的X轴设置了不同的URL,然后使用get_url()方法获取并打印这些URL。
4. XAxis.get_url()与其他轴属性的结合使用
XAxis.get_url()函数通常不会单独使用,而是与其他轴属性和方法结合,以创建更丰富的可视化效果。
4.1 结合轴标签使用
我们可以将URL信息与轴标签结合,创建更有信息量的图表。
import matplotlib.pyplot as plt

fig, ax = plt.subplots()
ax.plot([1, 2, 3, 4], [1, 4, 2, 3])
ax.xaxis.set_url("https://how2matplotlib.com/axis-label")
ax.set_xlabel("X轴 (点击查看详情)")

url = ax.xaxis.get_url()
if url:
    ax.set_xlabel(f"{ax.get_xlabel()} - {url}")

plt.show()
Output:
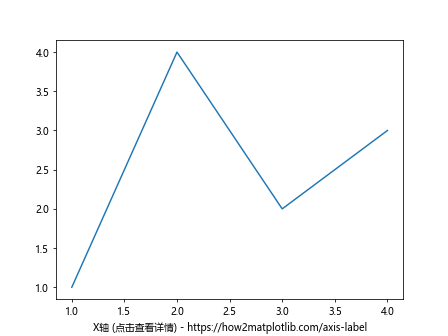
在这个例子中,我们将URL信息添加到了X轴的标签中。这样,即使在不支持交互的环境中,用户也能看到完整的URL信息。
4.2 与刻度标签结合
我们可以为X轴的每个刻度设置不同的URL,并使用get_url()来验证设置。
import matplotlib.pyplot as plt

fig, ax = plt.subplots()
ax.plot([1, 2, 3, 4], [1, 4, 2, 3])

ticks = ax.get_xticks()
for i, tick in enumerate(ticks):
    ax.xaxis.set_url(f"https://how2matplotlib.com/tick{i}")
    url = ax.xaxis.get_url()
    print(f"刻度 {tick} 的URL是: {url}")

plt.show()
Output:
这个例子演示了如何为X轴的每个刻度设置不同的URL,并使用get_url()方法来确认设置是否成功。
4.3 与图例结合
我们可以将URL信息添加到图例中,为用户提供额外的上下文信息。
import matplotlib.pyplot as plt

fig, ax = plt.subplots()
line, = ax.plot([1, 2, 3, 4], [1, 4, 2, 3], label="数据")
ax.xaxis.set_url("https://how2matplotlib.com/legend")

url = ax.xaxis.get_url()
if url:
    line.set_label(f"{line.get_label()} (更多信息: {url})")

ax.legend()
plt.show()
Output:
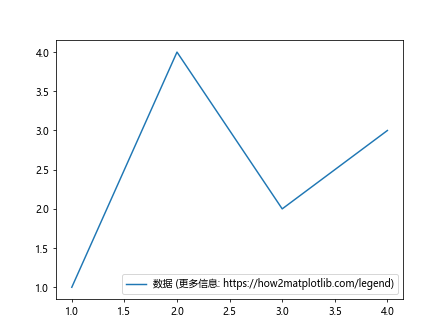
在这个例子中,我们将X轴的URL信息添加到了图例中,为用户提供了额外的参考信息。
5. XAxis.get_url()在动态图表中的应用
XAxis.get_url()函数在创建动态和交互式图表时特别有用。以下是一些在动态环境中使用get_url()的例子:
5.1 动态更新URL和图表
我们可以创建一个动态图表,其中X轴的URL会随着数据的变化而更新。
import matplotlib.pyplot as plt
import numpy as np
from matplotlib.animation import FuncAnimation

fig, ax = plt.subplots()
line, = ax.plot([], [])
ax.set_xlim(0, 10)
ax.set_ylim(-1, 1)

def update(frame):
    x = np.linspace(0, 10, 100)
    y = np.sin(x + frame / 10)
    line.set_data(x, y)

    new_url = f"https://how2matplotlib.com/frame{frame}"
    ax.xaxis.set_url(new_url)
    current_url = ax.xaxis.get_url()
    ax.set_title(f"当前URL: {current_url}")

    return line, ax

ani = FuncAnimation(fig, update, frames=100, interval=100, blit=True)
plt.show()
Output:

这个例子创建了一个动画,其中正弦波的相位随时间变化。同时,X轴的URL也会随每一帧而更新,并显示在图表的标题中。
5.2 基于用户交互更新URL
我们可以创建一个交互式图表,允许用户通过点击来更新X轴的URL。
import matplotlib.pyplot as plt

fig, ax = plt.subplots()
ax.plot([1, 2, 3, 4], [1, 4, 2, 3])
ax.xaxis.set_url("https://how2matplotlib.com/initial")

def on_click(event):
    if event.inaxes == ax:
        new_url = f"https://how2matplotlib.com/x{event.xdata:.2f}"
        ax.xaxis.set_url(new_url)
        current_url = ax.xaxis.get_url()
        ax.set_title(f"当前URL: {current_url}")
        fig.canvas.draw()

fig.canvas.mpl_connect('button_press_event', on_click)
plt.show()
Output:
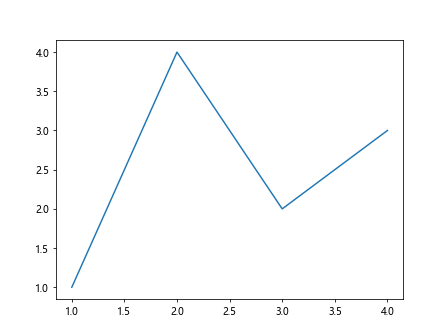
在这个例子中,每次用户点击图表时,X轴的URL都会更新为包含点击位置x坐标的新URL。使用get_url()方法,我们可以获取并显示更新后的URL。
5.3 在子图之间切换URL
在包含多个子图的图表中,我们可以根据用户的焦点来动态切换和显示不同子图的URL。
import matplotlib.pyplot as plt

fig, (ax1, ax2) = plt.subplots(1, 2, figsize=(10, 4))

ax1.plot([1, 2, 3, 4], [1, 4, 2, 3])
ax2.plot([1, 2, 3, 4], [3, 1, 4, 2])

ax1.xaxis.set_url("https://how2matplotlib.com/subplot1")
ax2.xaxis.set_url("https://how2matplotlib.com/subplot2")

def on_enter(event):
    if event.inaxes:
        url = event.inaxes.xaxis.get_url()
        fig.suptitle(f"当前子图URL: {url}")
        fig.canvas.draw()

fig.canvas.mpl_connect('axes_enter_event', on_enter)
plt.show()
Output:
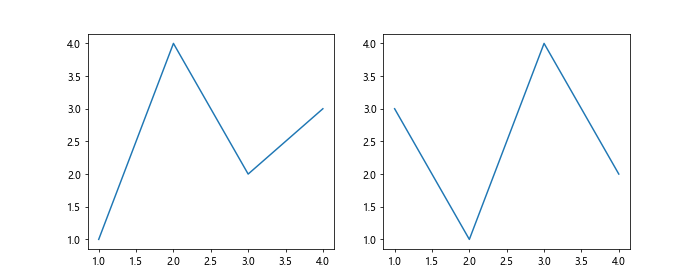
这个例子创建了两个子图,每个子图的X轴都有不同的URL。当鼠标进入某个子图时,会显示该子图X轴的URL。
6. XAxis.get_url()在数据分析中的应用
XAxis.get_url()函数不仅可以用于创建交互式图表,还可以在数据分析过程中提供额外的上下文信息。以下是一些在数据分析中使用get_url()的例子:
6.1 为时间序列数据添加参考链接
在分析时间序列数据时,我们可以为特定的时间点添加参考URL,以便查看更多相关信息。
import matplotlib.pyplot as plt
import pandas as pd

# 创建示例数据
dates = pd.date_range(start='2023-01-01', end='2023-12-31', freq='M')
values = [10, 12, 8, 15, 20, 18, 22, 25, 23, 19, 16, 14]
df = pd.DataFrame({'Date': dates, 'Value': values})

fig, ax = plt.subplots(figsize=(12, 6))
ax.plot(df['Date'], df['Value'])

# 为特定月份设置URL
important_dates = {
    '2023-03-31': "https://how2matplotlib.com/march-report",
    '2023-06-30': "https://how2matplotlib.com/half-year-summary",
    '2023-12-31': "https://how2matplotlib.com/year-end-analysis"
}

for date, url in important_dates.items():
    ax.axvline(pd.to_datetime(date), color='r', linestyle='--', alpha=0.5)
    ax.text(pd.to_datetime(date), ax.get_ylim()[1], date, rotation=90, va='top')
    ax.xaxis.set_url(url)

ax.set_xlabel("日期 (鼠标悬停查看更多信息)")
ax.set_ylabel("值")
ax.set_title("2023年月度数据")

def on_hover(event):
    if event.inaxes == ax:
        url = ax.xaxis.get_url()
        if url:
            ax.set_title(f"当前URL: {url}")
            fig.canvas.draw()

fig.canvas.mpl_connect('motion_notify_event', on_hover)
plt.show()
Output:
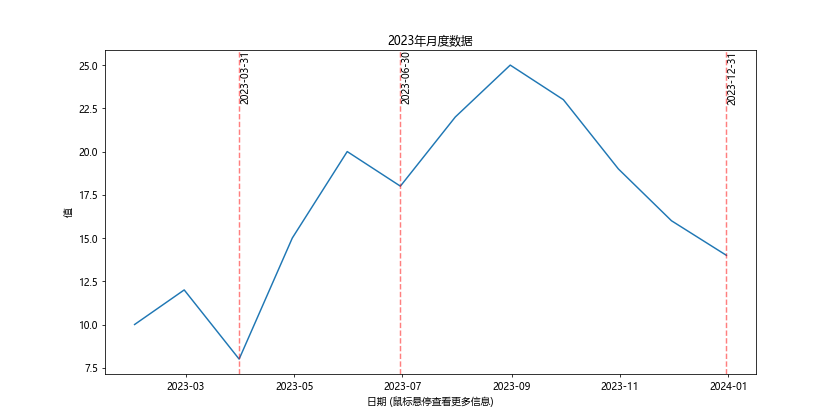
在这个例子中,我们为时间序列数据中的特定日期设置了URL。当用户将鼠标悬停在这些日期附近时,相应的URL会显示在图表标题中。
6.2 分类数据的详细信息链接
对于分类数据,我们可以为每个类别设置一个URL,提供该类别的详细信息。
import matplotlib.pyplot as plt
import numpy as np

categories = ['A', 'B', 'C', 'D', 'E']
values = [23, 45, 56, 78, 32]

fig, ax = plt.subplots(figsize=(10, 6))
bars = ax.bar(categories, values)

category_urls = {
    'A': "https://how2matplotlib.com/category-A",
    'B': "https://how2matplotlib.com/category-B",
    'C': "https://how2matplotlib.com/category-C",
    'D': "https://how2matplotlib.com/category-D",
    'E': "https://how2matplotlib.com/category-E"
}

def on_click(event):
    for bar in bars:
        if bar.contains(event)[0]:
            category = bar.get_x() + bar.get_width() / 2
            category_index = int(category)
            category_name = categories[category_index]
            ax.xaxis.set_url(category_urls[category_name])
            url = ax.xaxis.get_url()
            ax.set_title(f"类别 {category_name} 的URL: {url}")
            fig.canvas.draw()
            break

fig.canvas.mpl_connect('button_press_event', on_click)
ax.set_xlabel("类别 (点击查看详情)")
ax.set_ylabel("值")
ax.set_title("各类别数据")

plt.show()
Output:
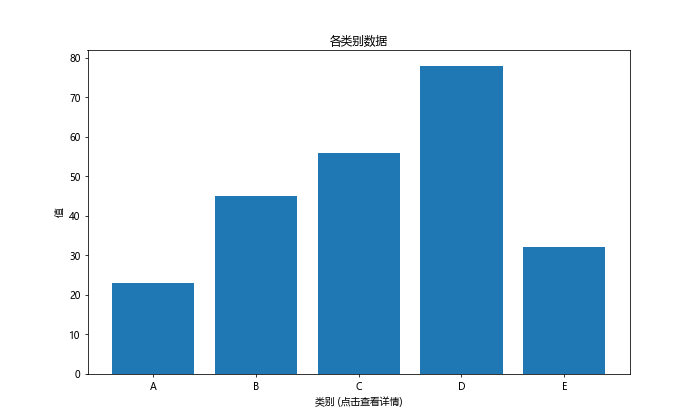
这个例子创建了一个条形图,每个条形代表一个类别。当用户点击某个条形时,会显示该类别的URL信息。
6.3 多维数据的层级URL
对于多维数据,我们可以使用层级URL结构来提供不同层次的信息。
import matplotlib.pyplot as plt
import numpy as np

fig, ax = plt.subplots(figsize=(10, 8))

# 创建示例数据
np.random.seed(0)
x = np.random.rand(50)
y = np.random.rand(50)
sizes = np.random.rand(50) * 500
colors = np.random.rand(50)

scatter = ax.scatter(x, y, s=sizes, c=colors, alpha=0.6)

ax.set_xlabel("X轴")
ax.set_ylabel("Y轴")
ax.set_title("多维数据散点图")

base_url = "https://how2matplotlib.com/data"
ax.xaxis.set_url(base_url)

def on_click(event):
    if event.inaxes == ax:
        cont, ind = scatter.contains(event)
        if cont:
            i = ind["ind"][0]
            point_url = f"{base_url}/point{i}"
            ax.xaxis.set_url(point_url)
            current_url = ax.xaxis.get_url()
            ax.set_title(f"点 {i} 的URL: {current_url}")
            fig.canvas.draw()

fig.canvas.mpl_connect('button_press_event', on_click)
plt.show()
Output:
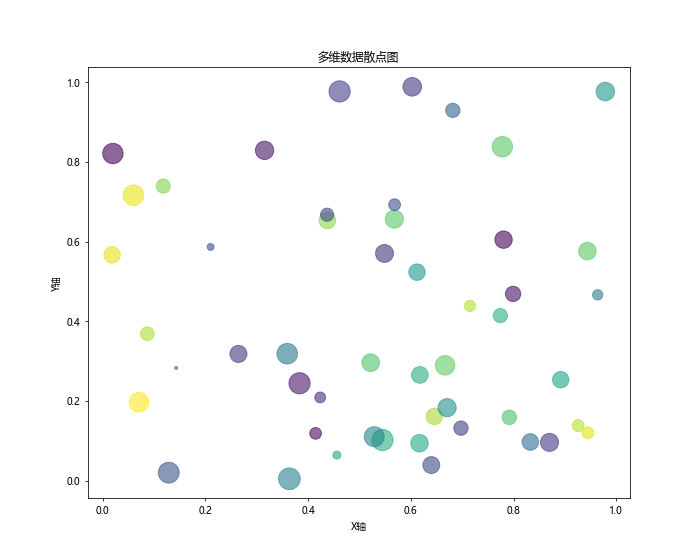
在这个例子中,我们创建了一个多维散点图。基础URL代表整个数据集,而当用户点击某个特定的点时,URL会更新为该点的特定URL。
7. XAxis.get_url()的高级应用
XAxis.get_url()函数还可以在更复杂的场景中发挥作用。以下是一些高级应用的例子:
7.1 与外部数据源集成
我们可以使用get_url()来获取和更新与外部数据源相关的URL。
import matplotlib.pyplot as plt
import numpy as np
import json

# 模拟外部数据源
external_data = {
    "dataset1": {"url": "https://how2matplotlib.com/api/dataset1", "data": [1, 4, 2, 3]},
    "dataset2": {"url": "https://how2matplotlib.com/api/dataset2", "data": [3, 1, 4, 2]}
}

fig, ax = plt.subplots()

def update_plot(dataset_name):
    data = external_data[dataset_name]["data"]
    ax.clear()
    ax.plot(data)
    ax.xaxis.set_url(external_data[dataset_name]["url"])
    ax.set_title(f"数据集: {dataset_name}")
    current_url = ax.xaxis.get_url()
    ax.text(0.5, -0.1, f"数据源: {current_url}", transform=ax.transAxes, ha='center')
    fig.canvas.draw()

update_plot("dataset1")

def on_key(event):
    if event.key == '1':
        update_plot("dataset1")
    elif event.key == '2':
        update_plot("dataset2")

fig.canvas.mpl_connect('key_press_event', on_key)
plt.show()
Output:
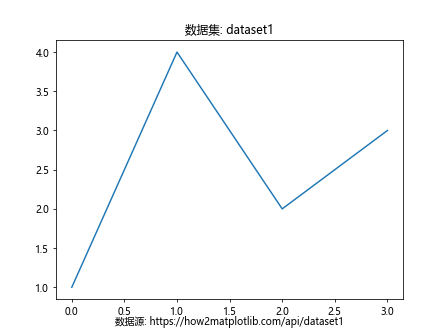
这个例子模拟了与外部数据源的交互。用户可以通过按键来切换不同的数据集,同时更新图表和相关的URL。
7.2 创建多层次的URL结构
对于复杂的数据可视化,我们可以创建多层次的URL结构,以提供更详细的信息。
import matplotlib.pyplot as plt
import numpy as np

fig, ((ax1, ax2), (ax3, ax4)) = plt.subplots(2, 2, figsize=(12, 10))
axes = [ax1, ax2, ax3, ax4]

base_url = "https://how2matplotlib.com/dashboard"

for i, ax in enumerate(axes, 1):
    data = np.random.rand(10)
    ax.plot(data)
    ax.set_title(f"图表 {i}")
    ax.xaxis.set_url(f"{base_url}/chart{i}")

def on_click(event):
    if event.inaxes in axes:
        ax = event.inaxes
        chart_url = ax.xaxis.get_url()
        point_url = f"{chart_url}/x{event.xdata:.2f}/y{event.ydata:.2f}"
        ax.xaxis.set_url(point_url)
        current_url = ax.xaxis.get_url()
        ax.set_title(f"当前URL: {current_url}")
        fig.canvas.draw()

fig.canvas.mpl_connect('button_press_event', on_click)
plt.tight_layout()
plt.show()
Output:
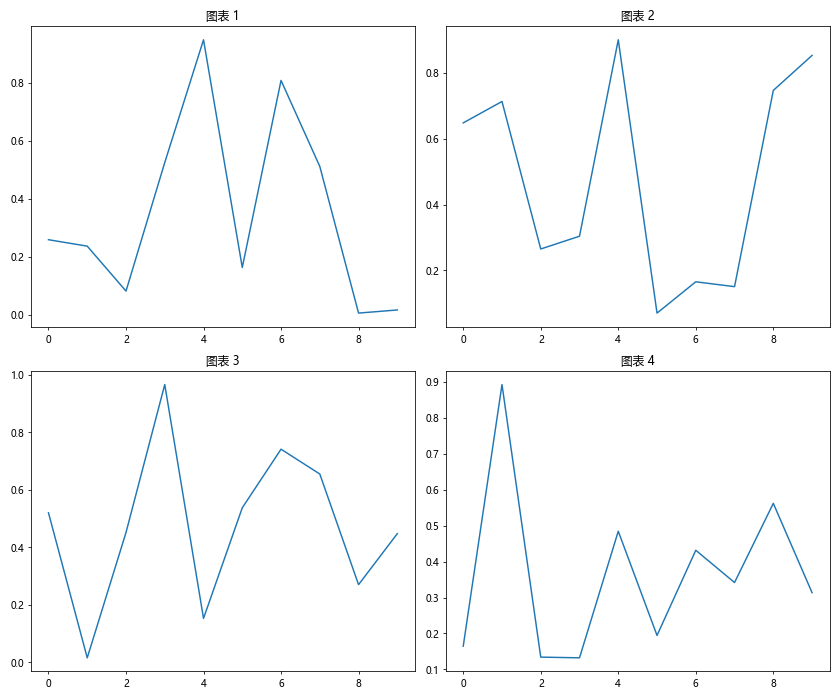
在这个例子中,我们创建了一个包含多个子图的仪表板。每个子图都有自己的基础URL,当用户点击某个点时,URL会更新为包含该点具体坐标的更详细的URL。
7.3 与交互式控件结合
我们可以将get_url()与Matplotlib的交互式控件结合使用,创建更丰富的用户交互体验。
import matplotlib.pyplot as plt
from matplotlib.widgets import RadioButtons

fig, ax = plt.subplots(figsize=(10, 6))
plt.subplots_adjust(left=0.3)

x = range(10)
y1 = [i**2 for i in x]
y2 = [i**3 for i in x]
y3 = [2**i for i in x]

line, = ax.plot(x, y1)
ax.set_ylim(0, 1000)

ax.xaxis.set_url("https://how2matplotlib.com/linear")

radio_ax = plt.axes([0.05, 0.7, 0.15, 0.15])
radio = RadioButtons(radio_ax, ('线性', '平方', '立方', '指数'))

def func(label):
    if label == '线性':
        line.set_ydata(x)
        ax.xaxis.set_url("https://how2matplotlib.com/linear")
    elif label == '平方':
        line.set_ydata(y1)
        ax.xaxis.set_url("https://how2matplotlib.com/square")
    elif label == '立方':
        line.set_ydata(y2)
        ax.xaxis.set_url("https://how2matplotlib.com/cube")
    elif label == '指数':
        line.set_ydata(y3)
        ax.xaxis.set_url("https://how2matplotlib.com/exponential")

    current_url = ax.xaxis.get_url()
    ax.set_title(f"当前函数: {label}, URL: {current_url}")
    fig.canvas.draw()

radio.on_clicked(func)
plt.show()
Output:
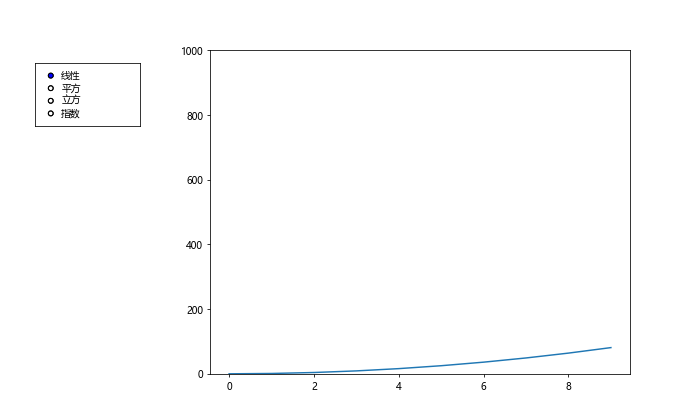
这个例子创建了一个带有单选按钮的交互式图表。用户可以选择不同的函数,图表会相应更新,同时X轴的URL也会改变以反映当前选择的函数。
8. XAxis.get_url()的注意事项和最佳实践
在使用XAxis.get_url()函数时,有一些注意事项和最佳实践需要考虑:
- URL的有效性:确保设置的URL是有效的,并且指向实际存在的资源。
-
安全性:避免在URL中包含敏感信息,特别是当图表可能被公开分享时。
-
可访问性:考虑为不支持交互的环境(如打印版本)提供替代信息。
-
性能:频繁调用get_url()和set_url()可能会影响性能,特别是在大型或复杂的图表中。
-
一致性:保持URL结构的一致性,使用户易于理解和导航。
-
文档化:为使用URL功能的图表提供清晰的文档,说明URL的用途和如何与之交互。
-
错误处理:实现适当的错误处理机制,以应对URL不可用或内容缺失的情况。
9. 结论
XAxis.get_url()函数是Matplotlib库中一个强大而灵活的工具,它为创建交互式和信息丰富的数据可视化提供了新的可能性。通过将URL与图表的各个元素关联,我们可以创建更具上下文和深度的可视化,使用户能够轻松获取额外的信息和资源。
从简单的URL标记到复杂的多层次数据探索,XAxis.get_url()函数可以应用于各种场景。它不仅增强了静态图表的信息量,还为动态和交互式可视化开辟了新的途径。
然而,使用这个功能时也需要谨慎。确保URL的相关性和安全性,考虑不同环境下的可访问性,并注意性能影响,这些都是创建高质量数据可视化的关键。
随着数据可视化领域的不断发展,像XAxis.get_url()这样的功能将继续发挥重要作用,帮助我们创建更加丰富、交互和信息化的图表,从而更好地理解和传达复杂的数据故事。
 极客笔记
极客笔记