Matplotlib中XAxis.get_figure()函数的全面指南与应用
参考:Matplotlib.axis.XAxis.get_figure() function in Python
Matplotlib是Python中最流行的数据可视化库之一,它提供了丰富的绘图功能和灵活的API。在Matplotlib的众多组件中,轴(Axis)是非常重要的一部分,它负责管理图表的刻度、标签和范围等属性。本文将深入探讨Matplotlib中axis.XAxis.get_figure()函数的用法、特性和应用场景,帮助读者更好地理解和使用这个强大的工具。
1. XAxis.get_figure()函数简介
XAxis.get_figure()是Matplotlib库中axis.XAxis类的一个方法。这个函数的主要作用是获取与当前X轴对象相关联的Figure对象。通过这个函数,我们可以方便地访问和操作整个图表,而不仅仅局限于X轴本身。
让我们来看一个简单的示例,了解如何使用get_figure()函数:
import matplotlib.pyplot as plt

# 创建一个简单的图表
fig, ax = plt.subplots()
ax.plot([1, 2, 3, 4], [1, 4, 2, 3], label='Data from how2matplotlib.com')

# 获取X轴对象
x_axis = ax.xaxis

# 使用get_figure()获取Figure对象
figure = x_axis.get_figure()

# 设置Figure的标题
figure.suptitle('Figure obtained from XAxis.get_figure()')

plt.show()
Output:
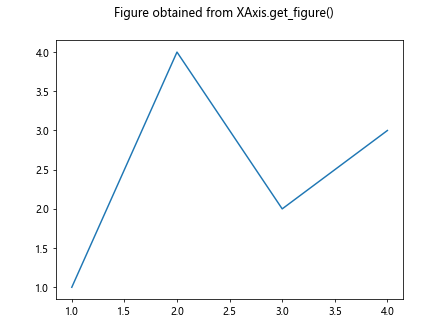
在这个例子中,我们首先创建了一个简单的图表,然后通过ax.xaxis获取X轴对象。接着,我们使用get_figure()方法获取与X轴关联的Figure对象,并设置了图表的标题。
2. XAxis.get_figure()的工作原理
要理解XAxis.get_figure()的工作原理,我们需要先了解Matplotlib中的对象层次结构。在Matplotlib中,Figure是最顶层的容器,它可以包含一个或多个Axes(子图)。每个Axes又包含XAxis和YAxis对象,用于管理X轴和Y轴的属性。
当我们调用XAxis.get_figure()时,Matplotlib会沿着对象层次结构向上查找,直到找到包含当前XAxis对象的Figure。这个过程是自动完成的,我们不需要手动指定任何参数。
下面是一个更详细的示例,展示了如何利用get_figure()来操作整个图表:
import matplotlib.pyplot as plt

# 创建一个包含两个子图的Figure
fig, (ax1, ax2) = plt.subplots(2, 1, figsize=(8, 6))

# 在两个子图中绘制数据
ax1.plot([1, 2, 3, 4], [1, 4, 2, 3], label='Data 1 from how2matplotlib.com')
ax2.plot([1, 2, 3, 4], [3, 1, 4, 2], label='Data 2 from how2matplotlib.com')

# 获取第一个子图的X轴对象
x_axis = ax1.xaxis

# 使用get_figure()获取Figure对象
figure = x_axis.get_figure()

# 设置Figure的整体标题
figure.suptitle('Figure with multiple subplots')

# 调整子图之间的间距
figure.tight_layout(pad=3.0)

# 为Figure添加一个文本说明
figure.text(0.5, 0.02, 'Created using how2matplotlib.com', ha='center')

plt.show()
Output:
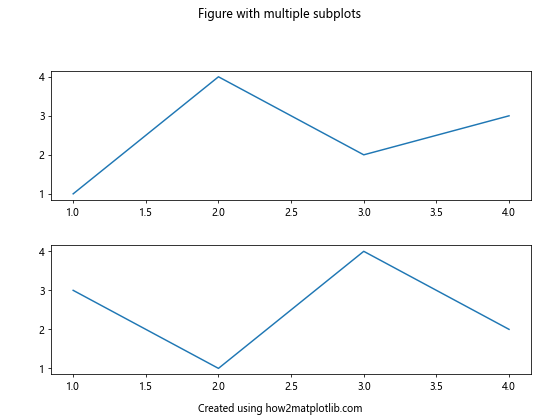
在这个例子中,我们创建了一个包含两个子图的Figure。通过get_figure()方法,我们获取了Figure对象,并对其进行了一系列操作,包括设置标题、调整布局和添加文本说明。
3. XAxis.get_figure()的应用场景
XAxis.get_figure()函数在许多场景下都非常有用。以下是一些常见的应用场景:
3.1 动态调整图表布局
当我们需要根据数据或用户输入动态调整图表布局时,get_figure()可以帮助我们轻松访问和修改Figure的属性。
import matplotlib.pyplot as plt
import numpy as np

# 创建一个简单的图表
fig, ax = plt.subplots()

# 生成一些随机数据
data = np.random.randn(100)
ax.hist(data, bins=20, label='Random data from how2matplotlib.com')

# 获取X轴对象和Figure对象
x_axis = ax.xaxis
figure = x_axis.get_figure()

# 根据数据的范围动态调整Figure的大小
data_range = data.max() - data.min()
figure.set_size_inches(data_range * 2, data_range * 1.5)

# 添加标题和图例
ax.set_title('Histogram of Random Data')
ax.legend()

plt.show()
Output:
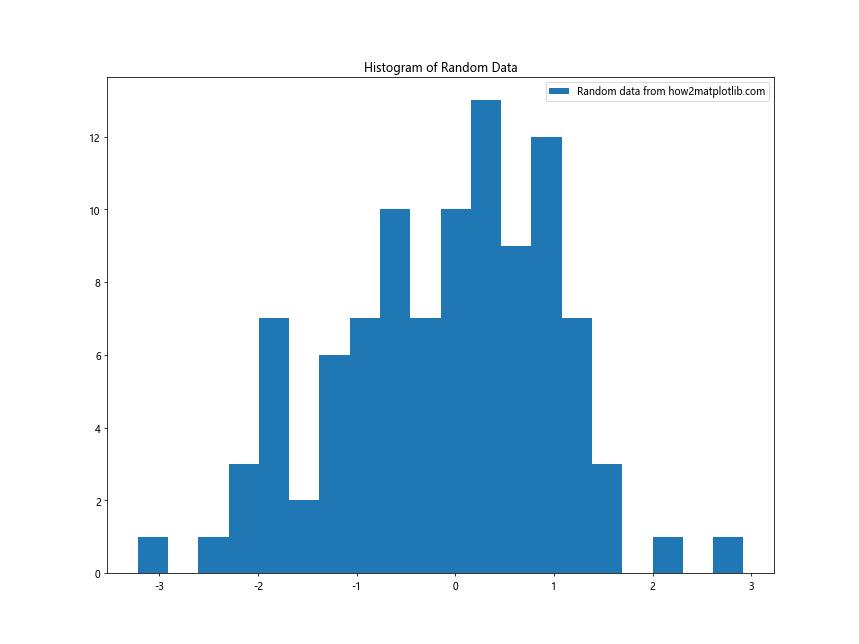
在这个例子中,我们根据数据的范围动态调整了Figure的大小。这种方法可以确保图表始终有合适的尺寸,无论数据的分布如何。
3.2 添加全局注释和说明
使用get_figure()可以方便地在整个图表上添加注释和说明,而不仅仅局限于单个子图。
import matplotlib.pyplot as plt

# 创建一个包含多个子图的Figure
fig, axs = plt.subplots(2, 2, figsize=(10, 8))

# 在每个子图中绘制一些数据
for i, ax in enumerate(axs.flat):
    ax.plot([1, 2, 3, 4], [i+1, i+2, i+3, i+4], label=f'Data {i+1} from how2matplotlib.com')
    ax.legend()

# 获取任意一个子图的X轴对象
x_axis = axs[0, 0].xaxis

# 使用get_figure()获取Figure对象
figure = x_axis.get_figure()

# 添加全局标题
figure.suptitle('Multiple Subplots with Global Annotations', fontsize=16)

# 添加全局注释
figure.text(0.5, 0.02, 'This is a global annotation for all subplots', ha='center', fontsize=12)

# 添加水印
figure.text(0.95, 0.05, 'how2matplotlib.com', ha='right', va='bottom', alpha=0.5, fontsize=14)

plt.tight_layout()
plt.show()
Output:
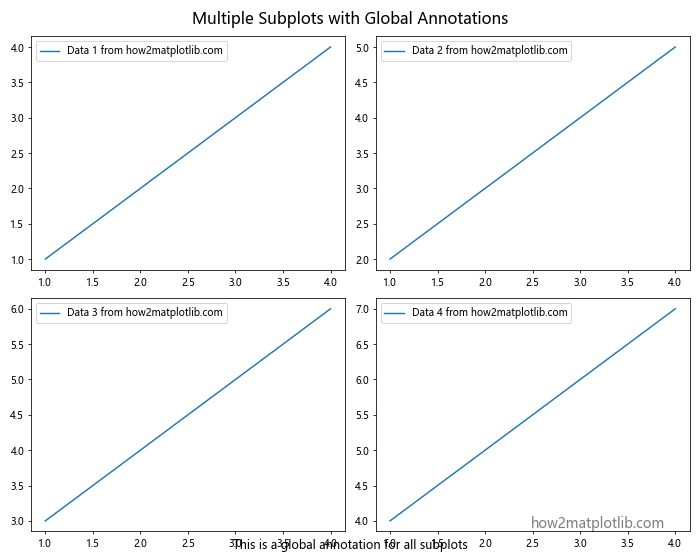
这个例子展示了如何在包含多个子图的Figure上添加全局标题、注释和水印。通过get_figure(),我们可以轻松地访问整个Figure对象,而不需要单独处理每个子图。
3.3 自定义颜色映射
get_figure()还可以用于创建和应用自定义的颜色映射,以增强图表的视觉效果。
import matplotlib.pyplot as plt
import numpy as np
from matplotlib.colors import LinearSegmentedColormap

# 创建一个简单的热图
fig, ax = plt.subplots()
data = np.random.rand(10, 10)
im = ax.imshow(data, cmap='viridis')

# 获取X轴对象和Figure对象
x_axis = ax.xaxis
figure = x_axis.get_figure()

# 创建自定义颜色映射
colors = ['#FFA07A', '#98FB98', '#87CEFA']
n_bins = 100
cmap = LinearSegmentedColormap.from_list('custom_cmap', colors, N=n_bins)

# 应用自定义颜色映射
im.set_cmap(cmap)

# 添加颜色条
cbar = figure.colorbar(im, ax=ax)
cbar.set_label('Values from how2matplotlib.com')

# 设置标题
ax.set_title('Heatmap with Custom Colormap')

plt.show()
Output:
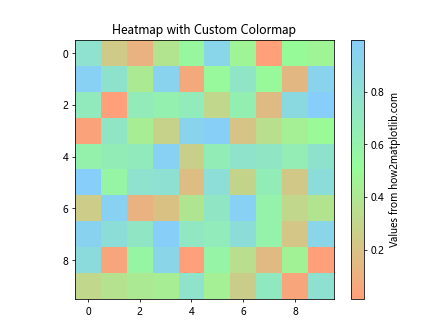
在这个例子中,我们创建了一个自定义的颜色映射,并将其应用到热图上。通过get_figure(),我们可以轻松地添加颜色条并对其进行自定义。
4. XAxis.get_figure()与其他Matplotlib函数的配合使用
XAxis.get_figure()函数可以与Matplotlib的其他函数和方法配合使用,以实现更复杂的图表定制和交互功能。
4.1 与事件处理结合
我们可以将get_figure()与Matplotlib的事件处理系统结合,创建交互式图表。
import matplotlib.pyplot as plt

fig, ax = plt.subplots()
ax.plot([1, 2, 3, 4], [1, 4, 2, 3], label='Data from how2matplotlib.com')

x_axis = ax.xaxis
figure = x_axis.get_figure()

def on_click(event):
    if event.inaxes == ax:
        figure.suptitle(f'Clicked at x={event.xdata:.2f}, y={event.ydata:.2f}')
        figure.canvas.draw()

figure.canvas.mpl_connect('button_press_event', on_click)

plt.show()
Output:
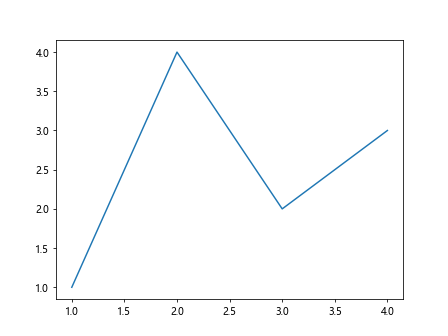
这个例子展示了如何使用get_figure()获取Figure对象,并将其与鼠标点击事件关联。当用户点击图表时,标题会更新为点击的坐标。
4.2 创建动画效果
结合get_figure()和Matplotlib的动画模块,我们可以创建动态的图表效果。
import matplotlib.pyplot as plt
import matplotlib.animation as animation
import numpy as np

fig, ax = plt.subplots()
x = np.linspace(0, 2*np.pi, 100)
line, = ax.plot(x, np.sin(x))

x_axis = ax.xaxis
figure = x_axis.get_figure()

def animate(frame):
    line.set_ydata(np.sin(x + frame/10))
    figure.suptitle(f'Frame {frame} - how2matplotlib.com')
    return line,

ani = animation.FuncAnimation(figure, animate, frames=100, interval=50, blit=True)

plt.show()
Output:
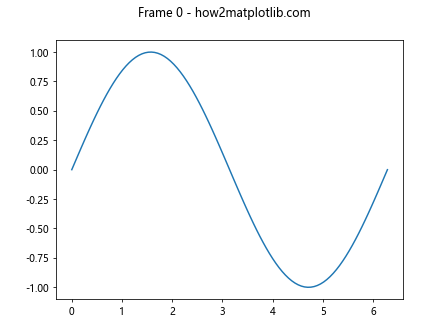
这个例子使用get_figure()获取Figure对象,并创建了一个简单的正弦波动画。动画的每一帧都会更新Figure的标题。
4.3 自定义图例位置
get_figure()可以帮助我们更灵活地控制图例的位置,特别是当我们需要将图例放置在Figure的特定位置时。
import matplotlib.pyplot as plt

fig, (ax1, ax2) = plt.subplots(1, 2, figsize=(12, 5))

# 绘制数据
ax1.plot([1, 2, 3, 4], [1, 4, 2, 3], label='Data 1 from how2matplotlib.com')
ax2.plot([1, 2, 3, 4], [3, 1, 4, 2], label='Data 2 from how2matplotlib.com')

# 获取Figure对象
figure = ax1.xaxis.get_figure()

# 创建一个共享的图例
lines1, labels1 = ax1.get_legend_handles_labels()
lines2, labels2 = ax2.get_legend_handles_labels()
figure.legend(lines1 + lines2, labels1 + labels2, loc='upper center', bbox_to_anchor=(0.5, 0.05),
              fancybox=True, shadow=True, ncol=2)

# 调整子图布局
plt.tight_layout()

# 为Figure添加标题
figure.suptitle('Subplots with Shared Legend', fontsize=16)

plt.show()
Output:
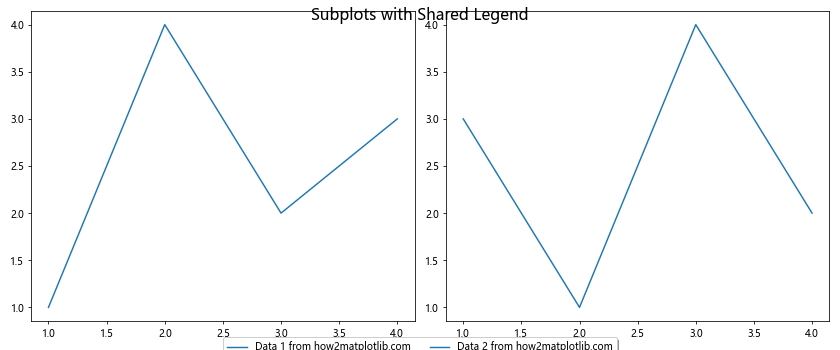
在这个例子中,我们使用get_figure()获取Figure对象,并创建了一个共享的图例,将其放置在两个子图的下方。这种方法可以有效地节省空间,并使图表看起来更加整洁。
5. XAxis.get_figure()的高级应用
除了基本的应用外,XAxis.get_figure()还可以用于一些更高级的图表定制和数据可视化任务。
5.1 创建复合图表
使用get_figure(),我们可以轻松地创建包含不同类型图表的复合可视化。
import matplotlib.pyplot as plt
import numpy as np

# 创建Figure和子图
fig = plt.figure(figsize=(12, 8))
gs = fig.add_gridspec(2, 2)
ax1 = fig.add_subplot(gs[0, 0])
ax2 = fig.add_subplot(gs[0, 1])
ax3 = fig.add_subplot(gs[1, :])

# 绘制散点图
x = np.random.rand(50)
y = np.random.rand(50)
ax1.scatter(x, y, c='r', alpha=0.5)
ax1.set_title('Scatter Plot')

# 绘制柱状图
categories = ['A', 'B', 'C', 'D']
values = [3, 7, 2, 5]
ax2.bar(categories, values)
ax2.set_title('Bar Chart')

# 绘制折线图
x = np.linspace(0, 10, 100)
y = np.sin(x)
ax3.plot(x, y)
ax3.set_title('Line Plot')

# 获取Figure对象
figure = ax1.xaxis.get_figure()

# 添加全局标题和注释
figure.suptitle('Composite Visualization using how2matplotlib.com', fontsize=16)
figure.text(0.5, 0.02, 'This is a composite visualization example', ha='center')

plt.tight_layout()
plt.show()
Output:
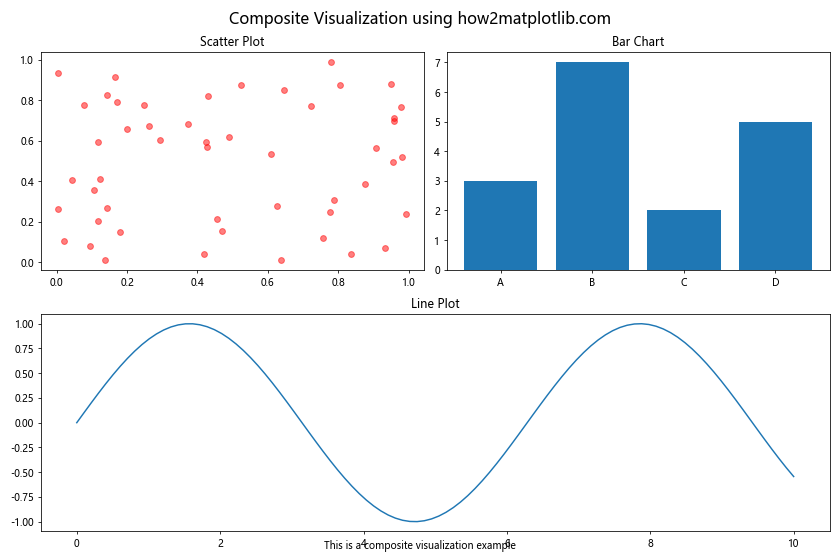
这个例子展示了如何创建一个包含散点图、柱状图和折线图的复合可视化。通过get_figure(),我们可以轻松地为整个Figure添加全局标题和注释,使得不同类型的图表形成一个统一的整体。
5.2 实现图表样式的全局控制
使用get_figure(),我们可以实现对整个Figure中所有子图的样式进行统一控制。
import matplotlib.pyplot as plt
import numpy as np

# 创建Figure和多个子图
fig, axs = plt.subplots(2, 2, figsize=(12, 10))

# 在每个子图中绘制不同类型的图表
x = np.linspace(0, 10, 100)
axs[0, 0].plot(x, np.sin(x), label='Sin')
axs[0, 1].plot(x, np.cos(x), label='Cos')
axs[1, 0].scatter(np.random.rand(50), np.random.rand(50), label='Scatter')
axs[1, 1].bar(['A', 'B', 'C', 'D'], [3, 7, 2, 5], label='Bar')

# 获取Figure对象
figure = axs[0, 0].xaxis.get_figure()

# 定义全局样式函数
def apply_global_style(fig):
    for ax in fig.get_axes():
        ax.set_facecolor('#f0f0f0')
        ax.grid(True, linestyle='--', alpha=0.7)
        ax.legend()
        for spine in ax.spines.values():
            spine.set_color('#555555')
        ax.tick_params(colors='#555555')
        ax.title.set_color('#333333')

# 应用全局样式
apply_global_style(figure)

# 设置全局标题
figure.suptitle('Global Style Control with how2matplotlib.com', fontsize=16, color='#333333')

plt.tight_layout()
plt.show()
Output:
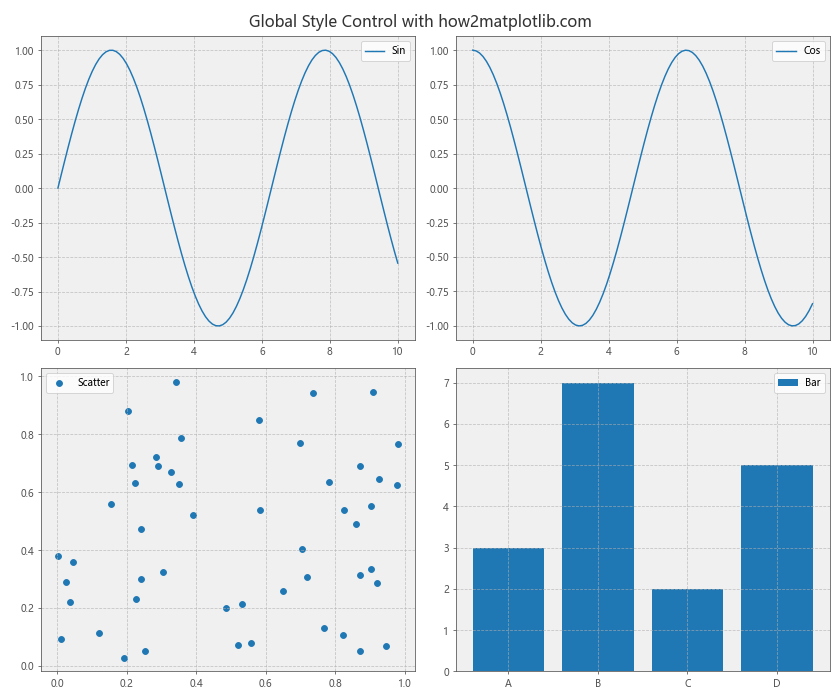
这个例子展示了如何使用get_figure()获取Figure对象,并定义一个全局样式函数来统一控制所有子图的外观。这种方法可以确保整个图表具有一致的视觉风格。
5.3 创建交互式图表导航
结合get_figure()和Matplotlib的widget模块,我们可以创建交互式的图表导航功能。
import matplotlib.pyplot as plt
from matplotlib.widgets import Button
import numpy as np

# 创建Figure和子图
fig, ax = plt.subplots(figsize=(10, 6))

# 初始数据
x = np.linspace(0, 10, 100)
y = np.sin(x)
line, = ax.plot(x, y)

# 获取Figure对象
figure = ax.xaxis.get_figure()

# 定义更新函数
def update(func):
    y = func(x)
    line.set_ydata(y)
    ax.relim()
    ax.autoscale_view()
    figure.canvas.draw_idle()

# 创建按钮
ax_sin = figure.add_axes([0.7, 0.02, 0.1, 0.075])
ax_cos = figure.add_axes([0.81, 0.02, 0.1, 0.075])
bsin = Button(ax_sin, 'Sin')
bcos = Button(ax_cos, 'Cos')

# 定义按钮回调函数
bsin.on_clicked(lambda event: update(np.sin))
bcos.on_clicked(lambda event: update(np.cos))

# 设置标题
ax.set_title('Interactive Function Plotter - how2matplotlib.com')

plt.show()
Output:
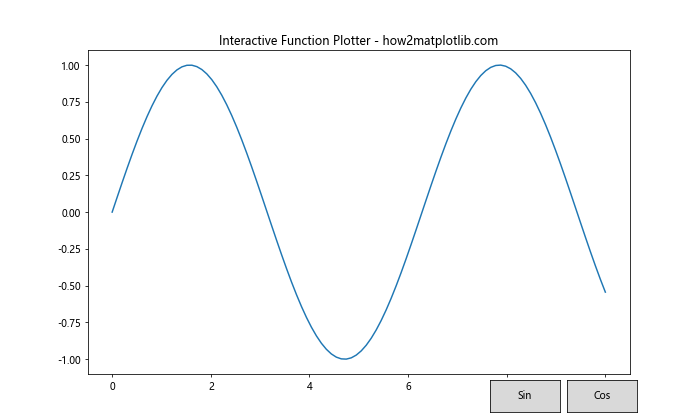
这个例子创建了一个交互式的函数绘图器,用户可以通过点击按钮在正弦和余弦函数之间切换。通过get_figure(),我们可以方便地在Figure上添加控件并管理交互逻辑。
6. XAxis.get_figure()的注意事项和最佳实践
在使用XAxis.get_figure()函数时,有一些注意事项和最佳实践需要考虑:
- 性能考虑:虽然
get_figure()是一个轻量级操作,但在处理大量图表或频繁调用时,应该注意其对性能的影响。 -
对象生命周期:确保在使用
get_figure()获取的Figure对象时,相关的Axes和XAxis对象仍然有效。 -
避免循环引用:在某些复杂的图表结构中,过度使用
get_figure()可能导致循环引用。要注意适时释放不再需要的对象。 -
结合使用其他方法:
get_figure()通常与其他Matplotlib方法结合使用效果最佳,如Figure.add_subplot()、Figure.text()等。 -
保持代码清晰:虽然
get_figure()提供了方便的访问,但过度使用可能使代码结构变得混乱。保持清晰的层次结构和命名约定很重要。
下面是一个遵循这些最佳实践的示例:
import matplotlib.pyplot as plt
import numpy as np

def create_complex_chart():
    fig, (ax1, ax2) = plt.subplots(2, 1, figsize=(10, 8))

    # 绘制数据
    x = np.linspace(0, 10, 100)
    ax1.plot(x, np.sin(x), label='Sin')
    ax2.plot(x, np.cos(x), label='Cos')

    # 使用get_figure()进行全局设置
    figure = ax1.xaxis.get_figure()
    figure.suptitle('Complex Chart Example - how2matplotlib.com', fontsize=16)

    # 为每个子图添加标题和图例
    for ax, title in zip([ax1, ax2], ['Sine Function', 'Cosine Function']):
        ax.set_title(title)
        ax.legend()
        ax.grid(True, linestyle='--', alpha=0.7)

    # 添加全局注释
    figure.text(0.5, 0.02, 'Created with Matplotlib', ha='center')

    return figure

# 创建并显示图表
chart = create_complex_chart()
plt.tight_layout()
plt.show()
Output:
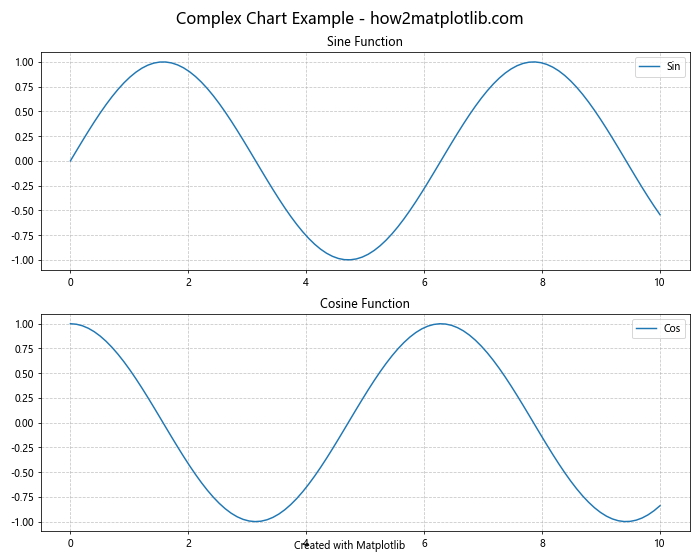
这个例子展示了如何在一个函数中创建复杂的图表,同时使用get_figure()进行全局设置。通过将图表创建逻辑封装在一个函数中,我们可以更好地管理对象的生命周期和避免全局变量的滥用。
7. 总结
XAxis.get_figure()函数是Matplotlib库中一个强大而灵活的工具,它允许我们从X轴对象轻松访问整个Figure对象。通过本文的详细介绍和丰富的示例,我们探讨了这个函数的工作原理、应用场景和高级用法。
从基本的图表定制到复杂的交互式可视化,get_figure()在各种数据可视化任务中都发挥着重要作用。它不仅简化了对Figure对象的访问,还为创建一致性的、富有表现力的可视化提供了便利。
在实际应用中,合理使用get_figure()可以帮助我们更有效地组织代码、管理图表结构,并实现更高级的可视化效果。同时,遵循本文提到的最佳实践,可以确保我们的代码既高效又易于维护。
随着数据可视化在科学研究、商业分析和日常工作中的重要性不断提升,掌握像XAxis.get_figure()这样的工具变得越来越重要。通过深入理解和灵活运用这个函数,我们可以创造出更加丰富、直观和有说服力的数据可视化作品。
无论你是数据科学家、研究人员,还是对数据可视化感兴趣的编程爱好者,希望本文能够帮助你更好地利用Matplotlib库,创造出令人印象深刻的可视化效果。记住,在数据可视化的世界里,创意和技术同样重要,而XAxis.get_figure()正是连接两者的桥梁之一。
 极客笔记
极客笔记