Matplotlib中的Axis.is_transform_set()函数:轴变换设置检查与应用
参考:Matplotlib.axis.Axis.is_transform_set() function in Python
Matplotlib是Python中最流行的数据可视化库之一,它提供了丰富的绘图功能和自定义选项。在Matplotlib中,轴(Axis)是图表中的重要组成部分,负责管理数据的刻度、标签和范围等属性。Axis.is_transform_set()函数是Matplotlib中axis.Axis类的一个方法,用于检查轴的变换是否已经设置。本文将深入探讨这个函数的用途、使用方法以及在实际绘图中的应用。
1. Axis.is_transform_set()函数简介
Axis.is_transform_set()是一个布尔函数,它返回一个表示轴变换是否已设置的布尔值。当轴的变换已经被设置时,函数返回True;否则返回False。这个函数通常用于检查轴的变换状态,以便在进行后续操作时做出相应的决策。
让我们看一个简单的例子来了解这个函数的基本用法:
import matplotlib.pyplot as plt

fig, ax = plt.subplots()
plt.title("how2matplotlib.com - is_transform_set() Example")

# 检查x轴的变换是否已设置
is_set = ax.xaxis.is_transform_set()
print(f"X-axis transform is set: {is_set}")

plt.show()
Output:
在这个例子中,我们创建了一个简单的图表,然后使用is_transform_set()函数检查x轴的变换是否已设置。通常情况下,在创建新的图表时,轴的变换会自动设置,所以这个函数会返回True。
2. 轴变换的概念
在深入探讨is_transform_set()函数之前,我们需要理解轴变换的概念。在Matplotlib中,变换(Transform)是用来将数据坐标转换为显示坐标的数学操作。轴变换决定了数据如何映射到图表的物理空间。
常见的轴变换包括:
- 线性变换:最常见的变换类型,数据值与显示位置成线性关系。
- 对数变换:用于处理跨越多个数量级的数据。
- 符号对数变换:类似于对数变换,但可以处理零和负值。
- 时间变换:用于处理日期和时间数据。
下面是一个使用对数变换的例子:
import matplotlib.pyplot as plt
import numpy as np

fig, ax = plt.subplots()
plt.title("how2matplotlib.com - Logarithmic Transform Example")

# 创建数据
x = np.logspace(0, 5, 100)
y = x**2

# 设置y轴为对数刻度
ax.set_yscale('log')

# 绘制数据
ax.plot(x, y, label='y = x^2')

# 添加图例和标签
ax.legend()
ax.set_xlabel('X-axis')
ax.set_ylabel('Y-axis (log scale)')

# 检查y轴的变换是否已设置
is_set = ax.yaxis.is_transform_set()
print(f"Y-axis transform is set: {is_set}")

plt.show()
Output:
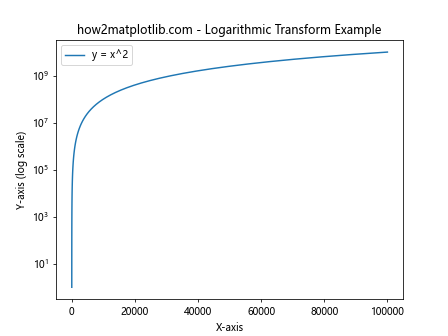
在这个例子中,我们使用set_yscale('log')设置了y轴的对数变换。然后,我们使用is_transform_set()函数检查y轴的变换是否已设置。由于我们显式地设置了对数变换,函数应该返回True。
3. is_transform_set()函数的工作原理
is_transform_set()函数的工作原理相对简单。它检查轴对象内部是否已经定义了变换。在Matplotlib中,轴变换通常在创建图表时自动设置,或者在调用某些方法(如set_scale())时显式设置。
这个函数的主要用途是在进行自定义绘图操作时,确保轴的变换已经正确设置。如果变换未设置,可能会导致数据显示不正确或者引发错误。
让我们看一个更复杂的例子,展示如何使用is_transform_set()函数来检查不同轴的变换状态:
import matplotlib.pyplot as plt
import numpy as np

fig, (ax1, ax2) = plt.subplots(1, 2, figsize=(12, 5))
fig.suptitle("how2matplotlib.com - Checking Transform Status")

# 第一个子图:默认线性刻度
x1 = np.linspace(0, 10, 100)
y1 = np.sin(x1)
ax1.plot(x1, y1)
ax1.set_title("Linear Scale")

# 第二个子图:对数刻度
x2 = np.logspace(0, 2, 100)
y2 = np.log(x2)
ax2.plot(x2, y2)
ax2.set_xscale('log')
ax2.set_title("Logarithmic Scale")

# 检查两个子图的轴变换状态
for i, ax in enumerate([ax1, ax2], 1):
    print(f"Subplot {i}:")
    print(f"  X-axis transform set: {ax.xaxis.is_transform_set()}")
    print(f"  Y-axis transform set: {ax.yaxis.is_transform_set()}")

plt.tight_layout()
plt.show()
Output:
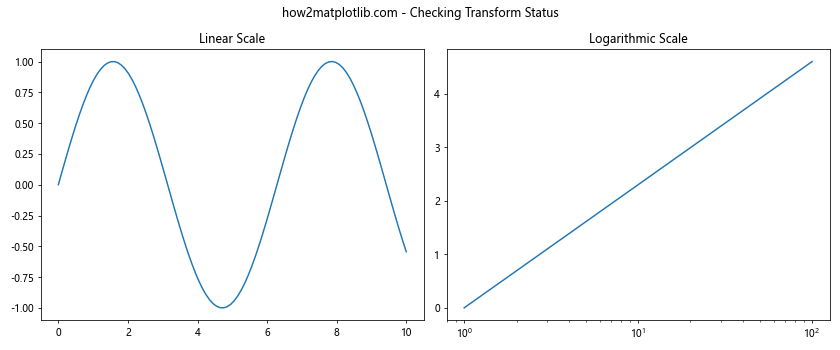
在这个例子中,我们创建了两个子图:一个使用默认的线性刻度,另一个在x轴上使用对数刻度。然后,我们使用is_transform_set()函数检查每个子图的x轴和y轴的变换状态。你会发现,即使是默认的线性刻度,is_transform_set()也会返回True,因为Matplotlib会自动设置一个默认的线性变换。
4. 在自定义绘图中使用is_transform_set()
is_transform_set()函数在创建自定义绘图或开发Matplotlib扩展时特别有用。它可以帮助你确保在进行某些操作之前,轴的变换已经正确设置。
以下是一个示例,展示如何在自定义绘图函数中使用is_transform_set():
import matplotlib.pyplot as plt
import numpy as np

def custom_plot(ax, x, y, transform_type='linear'):
    if not ax.xaxis.is_transform_set():
        print("Warning: X-axis transform not set. Setting to default linear scale.")
        ax.set_xscale('linear')

    if not ax.yaxis.is_transform_set():
        print("Warning: Y-axis transform not set. Setting to specified scale.")
        ax.set_yscale(transform_type)

    ax.plot(x, y)
    ax.set_title(f"how2matplotlib.com - {transform_type.capitalize()} Scale")

# 创建图表
fig, (ax1, ax2) = plt.subplots(1, 2, figsize=(12, 5))

# 生成数据
x = np.logspace(0, 2, 100)
y1 = x
y2 = x**2

# 使用自定义函数绘图
custom_plot(ax1, x, y1, 'linear')
custom_plot(ax2, x, y2, 'log')

plt.tight_layout()
plt.show()
Output:
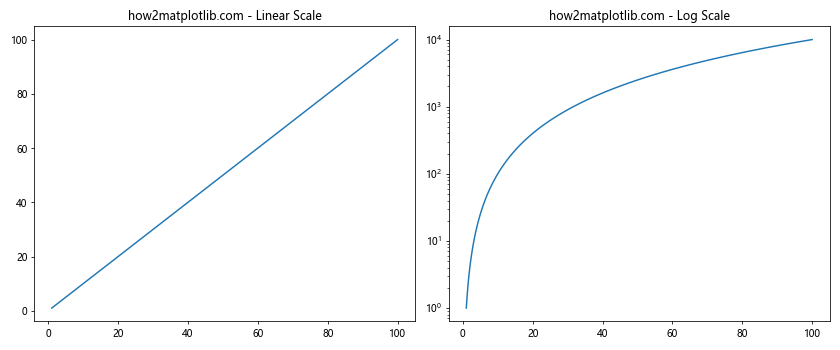
在这个例子中,我们定义了一个custom_plot函数,它在绘图之前检查轴的变换是否已设置。如果没有设置,函数会发出警告并设置指定的变换类型。这种方法可以确保图表始终具有正确的轴变换,即使在处理多个子图或复杂的绘图场景时也是如此。
5. is_transform_set()与其他轴方法的配合使用
is_transform_set()函数通常与其他轴方法结合使用,以实现更复杂的绘图效果或进行条件操作。以下是一些常见的配合使用场景:
5.1 与set_scale()配合使用
set_scale()方法用于设置轴的刻度类型。我们可以使用is_transform_set()来检查是否需要设置新的刻度:
import matplotlib.pyplot as plt
import numpy as np

fig, ax = plt.subplots()
plt.title("how2matplotlib.com - is_transform_set() with set_scale()")

x = np.logspace(0, 2, 100)
y = x**2

if not ax.xaxis.is_transform_set():
    print("Setting x-axis to log scale")
    ax.set_xscale('log')
else:
    print("X-axis transform already set")

ax.plot(x, y)
ax.set_xlabel('X-axis (log scale)')
ax.set_ylabel('Y-axis')

plt.show()
Output:
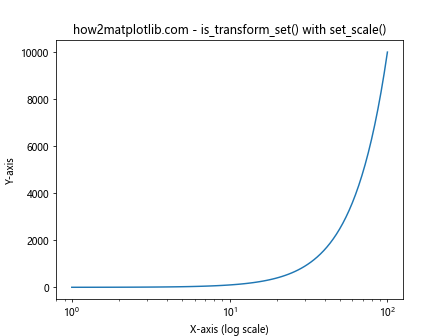
在这个例子中,我们首先检查x轴的变换是否已设置。如果没有设置,我们就将其设置为对数刻度。这种方法可以避免重复设置刻度,同时确保图表具有正确的轴变换。
5.2 与get_scale()配合使用
get_scale()方法返回当前轴的刻度类型。我们可以结合is_transform_set()使用它来获取更详细的轴信息:
import matplotlib.pyplot as plt
import numpy as np

fig, ax = plt.subplots()
plt.title("how2matplotlib.com - is_transform_set() with get_scale()")

x = np.linspace(0, 10, 100)
y = np.exp(x)

ax.plot(x, y)
ax.set_yscale('log')

for axis in [ax.xaxis, ax.yaxis]:
    if axis.is_transform_set():
        print(f"{axis.axis_name}-axis transform is set. Scale: {axis.get_scale()}")
    else:
        print(f"{axis.axis_name}-axis transform is not set")

plt.show()
Output:
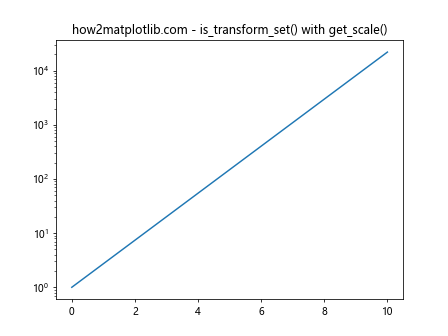
这个例子展示了如何使用is_transform_set()和get_scale()来获取和打印每个轴的变换信息。这对于调试或创建自适应的绘图函数非常有用。
5.3 与set_transform()配合使用
有时,你可能需要设置自定义的轴变换。set_transform()方法允许你这样做,而is_transform_set()可以用来检查是否需要应用新的变换:
import matplotlib.pyplot as plt
import numpy as np
from matplotlib.transforms import Affine2D

fig, ax = plt.subplots()
plt.title("how2matplotlib.com - Custom Transform Example")

x = np.linspace(0, 10, 100)
y = np.sin(x)

# 创建自定义变换
custom_transform = Affine2D().scale(2, 0.5) + ax.transData

if not ax.xaxis.is_transform_set():
    print("Applying custom transform")
    ax.set_transform(custom_transform)
else:
    print("Transform already set, using existing transform")

ax.plot(x, y)
ax.set_xlabel('X-axis')
ax.set_ylabel('Y-axis')

plt.show()
Output:
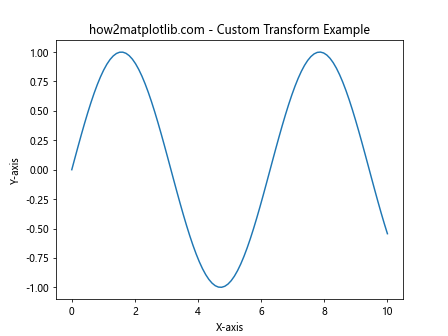
在这个例子中,我们创建了一个自定义的仿射变换,它将x轴缩放2倍,y轴缩放0.5倍。我们使用is_transform_set()来检查是否需要应用这个新的变换。这种方法可以帮助你在不覆盖现有变换的情况下应用自定义变换。
6. is_transform_set()在动态图表中的应用
is_transform_set()函数在创建动态或交互式图表时也非常有用。它可以帮助你在更新图表时确保轴的变换状态正确。以下是一个使用动画来演示这一点的例子:
import matplotlib.pyplot as plt
import numpy as np
from matplotlib.animation import FuncAnimation

fig, ax = plt.subplots()
plt.title("how2matplotlib.com - Dynamic Transform Example")

x = np.linspace(0, 10, 100)
line, = ax.plot(x, np.sin(x))

def update(frame):
    y = np.sin(x + frame / 10)
    line.set_ydata(y)

    if frame % 50 == 0:
        if ax.yaxis.is_transform_set():
            current_scale = ax.yaxis.get_scale()
            new_scale = 'log' if current_scale == 'linear' else 'linear'
            ax.set_yscale(new_scale)
            print(f"Frame {frame}: Changed y-axis scale to {new_scale}")

    return line,

ani = FuncAnimation(fig, update, frames=200, interval=50, blit=True)
plt.show()
Output:
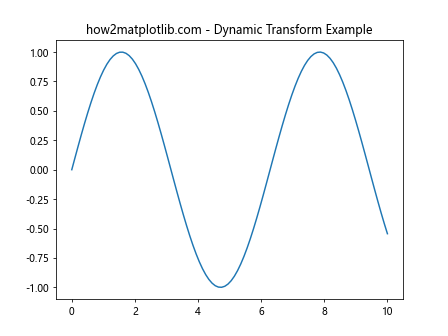
在这个动画例子中,我们创建了一个正弦波,它随时间变化。每50帧,我们检查y轴的变换是否已设置,然后在线性和对数刻度之间切换。这展示了如何在动态环境中使用is_transform_set()来管理轴的变换。
7. is_transform_set()在子图和复杂布局中的应用
当处理包含多个子图或复杂布局的图表时,is_transform_set()函数可以帮助你确保每个子图都有正确的轴变换设置。以下是一个展示这种用法的例子:
import matplotlib.pyplot as plt
import numpy as np

def setup_subplot(ax, scale_type, x, y):
    if not ax.xaxis.is_transform_set():
        ax.set_xscale(scale_type)
    if not ax.yaxis.is_transform_set():
        ax.set_yscale(scale_type)
    ax.plot(x, y)
    ax.set_title(f"how2matplotlib.com - {scale_type.capitalize()} Scale")

fig = plt.figure(figsize=(12, 8))
fig.suptitle("Complex Layout with Different Scales")

# 创建复杂的子图布局
gs = fig.add_gridspec(3, 3)
ax1 = fig.add_subplot(gs[0, :])
ax2 = fig.add_subplot(gs[1, :-1])
ax3 = fig.add_subplot(gs[1:, -1])
ax4 = fig.add_subplot(gs[-1, 0])
ax5 = fig.add_subplot(gs[-1, -2])

# 生成不同的数据集
x_linear = np.linspace(0, 10, 100)
y_linear = x_linear**2

x_log = np.logspace(0, 2, 100)
y_log = np.log(x_log)

x_symlog = np.linspace(-100, 100, 200)
y_symlog = np.sinh(x_symlog / 20)

# 设置每个子图
setup_subplot(ax1, 'linear', x_linear, y_linear)
setup_subplot(ax2, 'log', x_log, y_log)
setup_subplot(ax3, 'symlog', x_symlog, y_symlog)
setup_subplot(ax4, 'linear', x_linear, np.sin(x_linear))
setup_subplot(ax5, 'log', x_log, np.exp(x_log/10))

plt.tight_layout()
plt.show()
Output:
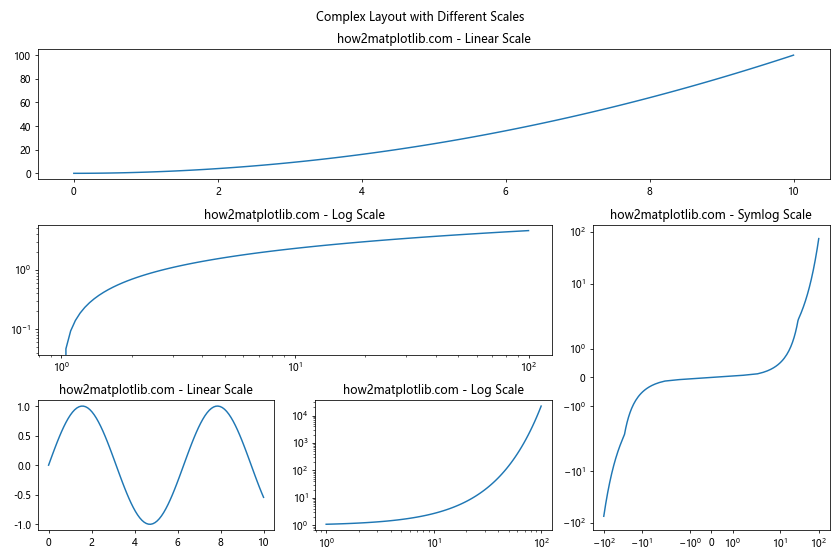
在这个例子中,我们创建了一个包含5个子图的复杂布局,每个子图使用不同的刻度类型。setup_subplot函数使用is_transform_set()来检查每个轴的变换是否已设置,如果没有设置,就应用指定的刻度类型。这种方法确保了即使在复杂的布局中,每个子图也能正确地设置其轴变换。
8. is_transform_set()在自定义Matplotlib扩展中的应用
当你开发自定义的Matplotlib扩展或插件时,is_transform_set()函数可以帮助你确保你的扩展与现有的图表设置兼容。以下是一个简单的自定义轴类的例子,它使用is_transform_set()来管理轴的变换:
import matplotlib.pyplot as plt
from matplotlib.axes import Axes
import numpy as np

class SmartAxis(Axes):
    def __init__(self, *args, **kwargs):
        super().__init__(*args, **kwargs)
        self.smart_scale = 'auto'

    def plot(self, *args, **kwargs):
        x = args[0]
        y = args[1]

        if self.smart_scale == 'auto':
            if np.all(x > 0) and np.all(y > 0):
                x_range = np.max(x) / np.min(x)
                y_range = np.max(y) / np.min(y)

                if x_range > 1000 and not self.xaxis.is_transform_set():
                    self.set_xscale('log')
                if y_range > 1000 and not self.yaxis.is_transform_set():
                    self.set_yscale('log')

        return super().plot(*args, **kwargs)

# 使用自定义轴类
fig = plt.figure(figsize=(12, 5))
fig.suptitle("how2matplotlib.com - Smart Axis Example")

ax1 = fig.add_subplot(121, projection='SmartAxis')
ax2 = fig.add_subplot(122, projection='SmartAxis')

# 线性数据
x1 = np.linspace(1, 100, 100)
y1 = x1 * 2 + 10
ax1.plot(x1, y1)
ax1.set_title("Linear Scale (Auto-detected)")

# 指数数据
x2 = np.logspace(0, 4, 100)
y2 = x2**2
ax2.plot(x2, y2)
ax2.set_title("Log Scale (Auto-detected)")

plt.tight_layout()
plt.show()
在这个例子中,我们创建了一个名为SmartAxis的自定义轴类。这个类重写了plot方法,在绘图之前自动检测数据的范围。如果数据跨越多个数量级,并且相应的轴变换尚未设置(使用is_transform_set()检查),它会自动将刻度设置为对数刻度。这种智能轴可以自动适应不同类型的数据,而不需要用户手动设置刻度类型。
9. is_transform_set()在处理时间序列数据时的应用
当处理时间序列数据时,is_transform_set()函数可以帮助你确保正确设置了时间轴的变换。以下是一个使用时间数据的例子:
import matplotlib.pyplot as plt
import numpy as np
import pandas as pd
from matplotlib.dates import DateFormatter, AutoDateLocator

def plot_time_series(ax, dates, values, title):
    if not ax.xaxis.is_transform_set():
        print(f"Setting up time transform for {title}")
        ax.xaxis.set_major_locator(AutoDateLocator())
        ax.xaxis.set_major_formatter(DateFormatter('%Y-%m-%d'))

    ax.plot(dates, values)
    ax.set_title(f"how2matplotlib.com - {title}")
    plt.setp(ax.xaxis.get_majorticklabels(), rotation=45, ha='right')

# 创建示例数据
dates = pd.date_range(start='2023-01-01', end='2023-12-31', freq='D')
daily_values = np.cumsum(np.random.randn(len(dates))) + 100
weekly_values = np.cumsum(np.random.randn(len(dates) // 7)) + 100

fig, (ax1, ax2) = plt.subplots(2, 1, figsize=(10, 10))
fig.suptitle("Time Series Data Example")

plot_time_series(ax1, dates, daily_values, "Daily Data")
plot_time_series(ax2, dates[::7], weekly_values, "Weekly Data")

plt.tight_layout()
plt.show()
在这个例子中,我们定义了一个plot_time_series函数,它使用is_transform_set()来检查x轴的变换是否已设置。如果没有设置,函数会配置适当的日期定位器和格式化器。这确保了时间轴正确显示,无论是处理每日数据还是每周数据。
10. is_transform_set()在处理地理数据时的应用
当使用Matplotlib绘制地理数据时,正确设置投影变换非常重要。is_transform_set()函数可以帮助你确保正确应用了地理投影。以下是一个使用Cartopy库的例子:
import matplotlib.pyplot as plt
import cartopy.crs as ccrs
import cartopy.feature as cfeature
import numpy as np

def plot_geo_data(ax, projection, transform_set=False):
    if not transform_set:
        print("Setting up geo transform")
        ax.set_global()
        ax.add_feature(cfeature.COASTLINE)
        ax.add_feature(cfeature.BORDERS)

    # 生成随机数据点
    lons = np.random.uniform(-180, 180, 100)
    lats = np.random.uniform(-90, 90, 100)

    ax.scatter(lons, lats, transform=ccrs.PlateCarree(),
               color='red', alpha=0.5)
    ax.set_title("how2matplotlib.com - Geographic Data Example")

fig, (ax1, ax2) = plt.subplots(1, 2, figsize=(15, 7),
                               subplot_kw={'projection': ccrs.Robinson()})

# 第一个子图:手动设置变换
plot_geo_data(ax1, ccrs.Robinson())

# 第二个子图:使用is_transform_set()检查
transform_set = ax2.xaxis.is_transform_set() and ax2.yaxis.is_transform_set()
plot_geo_data(ax2, ccrs.Robinson(), transform_set)

plt.tight_layout()
plt.show()
Output:

在这个例子中,我们创建了两个使用Robinson投影的世界地图。plot_geo_data函数使用一个transform_set参数,它可以通过is_transform_set()函数来设置。这确保了地理特征(如海岸线和边界)只在需要时才被添加,避免了重复设置投影变换。
11. is_transform_set()在创建自定义colorbar时的应用
当创建自定义colorbar时,确保正确设置轴变换也很重要。以下是一个使用is_transform_set()来管理colorbar轴变换的例子:
import matplotlib.pyplot as plt
import numpy as np
from mpl_toolkits.axes_grid1 import make_axes_locatable

def create_custom_colorbar(ax, im, scale='linear'):
    divider = make_axes_locatable(ax)
    cax = divider.append_axes("right", size="5%", pad=0.1)

    if not cax.yaxis.is_transform_set():
        print(f"Setting colorbar scale to {scale}")
        cax.set_yscale(scale)

    plt.colorbar(im, cax=cax)
    cax.set_title("how2matplotlib.com")

fig, (ax1, ax2) = plt.subplots(1, 2, figsize=(12, 5))

# 线性数据
data1 = np.random.rand(20, 20)
im1 = ax1.imshow(data1, cmap='viridis')
ax1.set_title("Linear Colorbar")
create_custom_colorbar(ax1, im1, 'linear')

# 对数数据
data2 = 10 ** (np.random.rand(20, 20) * 3 - 1)
im2 = ax2.imshow(data2, cmap='plasma', norm=plt.LogNorm())
ax2.set_title("Logarithmic Colorbar")
create_custom_colorbar(ax2, im2, 'log')

plt.tight_layout()
plt.show()
在这个例子中,create_custom_colorbar函数使用is_transform_set()来检查colorbar的y轴变换是否已设置。如果没有设置,函数会根据指定的刻度类型(线性或对数)设置适当的变换。这确保了colorbar正确匹配主图的数据分布。
12. 结论
Axis.is_transform_set()函数是Matplotlib中一个简单但有用的工具,它可以帮助你管理和检查轴的变换状态。通过本文的探讨,我们了解了这个函数的多种应用场景,包括:
- 基本的轴变换检查
- 在自定义绘图函数中确保正确的轴设置
- 与其他轴方法(如
set_scale()和get_scale())的配合使用 - 在动态和交互式图表中管理轴变换
- 处理复杂的子图布局
- 开发自定义Matplotlib扩展
- 处理时间序列和地理数据
- 创建自定义colorbar
通过合理使用is_transform_set()函数,你可以创建更健壮、更灵活的可视化代码,确保你的图表在各种情况下都能正确显示数据。无论你是在创建简单的统计图表,还是在开发复杂的数据可视化应用,掌握这个函数都将帮助你更好地控制和管理Matplotlib中的轴变换。
记住,虽然is_transform_set()是一个有用的工具,但它只是Matplotlib丰富功能集的一小部分。要创建真正出色的数据可视化,你还需要深入了解Matplotlib的其他特性和最佳实践。继续探索和实践,你将能够充分发挥Matplotlib的潜力,创建出富有洞察力和视觉吸引力的数据可视化作品。
 极客笔记
极客笔记