Matplotlib中的Axis.format_cursor_data()函数:自定义光标数据格式化
参考:Matplotlib.axis.Axis.format_cursor_data() function in Python
Matplotlib是Python中最流行的数据可视化库之一,它提供了丰富的绘图功能和自定义选项。在Matplotlib中,Axis.format_cursor_data()函数是一个强大的工具,用于自定义光标悬停时显示的数据格式。本文将深入探讨这个函数的用法、特性和应用场景,帮助你更好地控制和展示图表中的数据信息。
1. Axis.format_cursor_data()函数简介
Axis.format_cursor_data()函数是Matplotlib库中axis.Axis类的一个方法。它的主要作用是自定义当鼠标悬停在图表上时,显示的数据格式。这个函数允许我们根据需要格式化坐标轴上的数值,使其更易读、更有意义。
默认情况下,Matplotlib会以浮点数的形式显示光标位置的坐标值。但在某些情况下,我们可能需要更特殊的格式,比如日期时间、百分比或科学计数法等。这时,format_cursor_data()函数就派上用场了。
让我们看一个简单的示例来了解这个函数的基本用法:
import matplotlib.pyplot as plt
import numpy as np

def format_coord(x, y):
    return f'x={x:.2f}, y={y:.2f} (how2matplotlib.com)'

fig, ax = plt.subplots()
ax.plot(np.random.rand(10), np.random.rand(10), 'o')
ax.format_coord = format_coord
plt.title('Basic usage of format_cursor_data()')
plt.show()
Output:
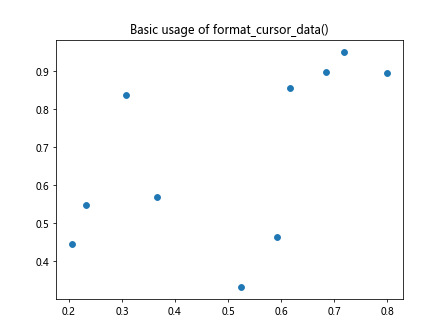
在这个例子中,我们定义了一个format_coord函数,它接收x和y坐标,并返回一个格式化的字符串。然后,我们将这个函数赋值给ax.format_coord,这样当鼠标悬停在图表上时,就会显示我们自定义的格式。
2. 自定义数值格式
format_cursor_data()函数的一个常见用途是自定义数值的显示格式。我们可以控制小数位数、添加单位、使用科学计数法等。下面是几个例子:
2.1 控制小数位数
import matplotlib.pyplot as plt
import numpy as np

def format_coord(x, y):
    return f'x={x:.4f}, y={y:.4f} (how2matplotlib.com)'

fig, ax = plt.subplots()
ax.plot(np.random.rand(10), np.random.rand(10), 'o')
ax.format_coord = format_coord
plt.title('Controlling decimal places')
plt.show()
Output:
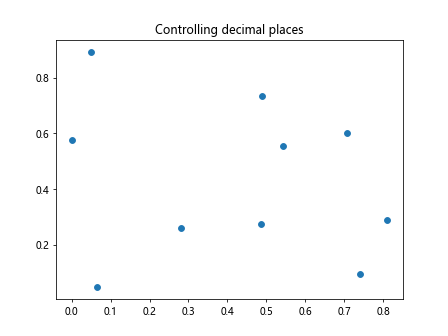
这个例子将坐标值精确到小数点后4位。
2.2 添加单位
import matplotlib.pyplot as plt
import numpy as np

def format_coord(x, y):
    return f'x={x:.2f} m, y={y:.2f} kg (how2matplotlib.com)'

fig, ax = plt.subplots()
ax.plot(np.random.rand(10) * 10, np.random.rand(10) * 100, 'o')
ax.format_coord = format_coord
plt.title('Adding units to coordinates')
plt.show()
Output:
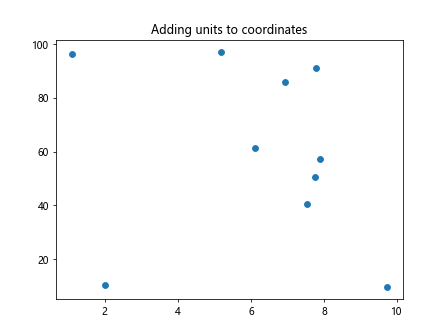
这个例子为x轴添加了米(m)单位,为y轴添加了千克(kg)单位。
2.3 使用科学计数法
import matplotlib.pyplot as plt
import numpy as np

def format_coord(x, y):
    return f'x={x:.2e}, y={y:.2e} (how2matplotlib.com)'

fig, ax = plt.subplots()
ax.plot(np.random.rand(10) * 1e6, np.random.rand(10) * 1e-6, 'o')
ax.format_coord = format_coord
plt.title('Using scientific notation')
plt.show()
Output:
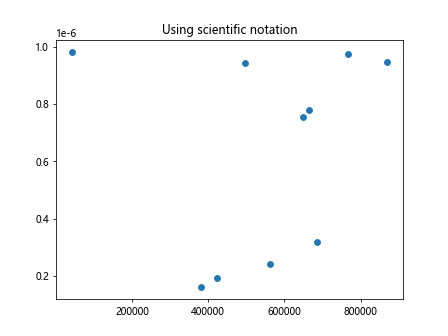
这个例子使用科学计数法来表示非常大或非常小的数值。
3. 日期时间格式化
在处理时间序列数据时,我们经常需要将x轴格式化为日期时间格式。format_cursor_data()函数可以很方便地实现这一点:
import matplotlib.pyplot as plt
import numpy as np
from datetime import datetime, timedelta

def format_coord(x, y):
    date = datetime(2023, 1, 1) + timedelta(days=int(x))
    return f'Date: {date.strftime("%Y-%m-%d")}, Value: {y:.2f} (how2matplotlib.com)'

fig, ax = plt.subplots()
dates = np.arange(0, 30)
values = np.random.rand(30) * 100
ax.plot(dates, values, 'o-')
ax.format_coord = format_coord
plt.title('Formatting dates in cursor data')
plt.show()
Output:
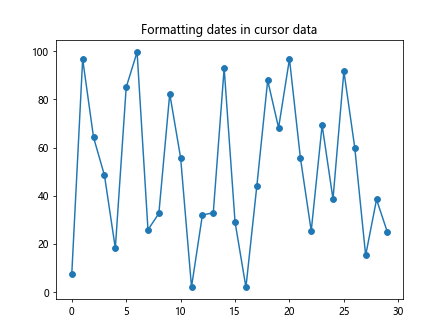
这个例子将x轴的数值转换为日期,并以”YYYY-MM-DD”的格式显示。
4. 条件格式化
有时,我们可能需要根据不同的条件来格式化数据。format_cursor_data()函数允许我们实现这种灵活的格式化:
import matplotlib.pyplot as plt
import numpy as np

def format_coord(x, y):
    if y > 0.5:
        return f'x={x:.2f}, y={y:.2f} (High) (how2matplotlib.com)'
    else:
        return f'x={x:.2f}, y={y:.2f} (Low) (how2matplotlib.com)'

fig, ax = plt.subplots()
ax.plot(np.random.rand(10), np.random.rand(10), 'o')
ax.format_coord = format_coord
plt.title('Conditional formatting')
plt.show()
Output:
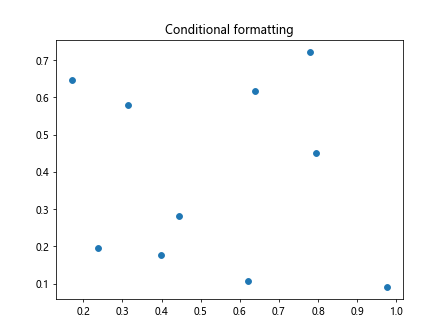
这个例子根据y值的大小添加了”High”或”Low”的标签。
5. 多子图格式化
当我们有多个子图时,可以为每个子图设置不同的格式化函数:
import matplotlib.pyplot as plt
import numpy as np

def format_coord1(x, y):
    return f'Plot 1: x={x:.2f}, y={y:.2f} (how2matplotlib.com)'

def format_coord2(x, y):
    return f'Plot 2: x={x:.2e}, y={y:.2e} (how2matplotlib.com)'

fig, (ax1, ax2) = plt.subplots(1, 2, figsize=(10, 5))

ax1.plot(np.random.rand(10), np.random.rand(10), 'o')
ax1.format_coord = format_coord1
ax1.set_title('Subplot 1')

ax2.plot(np.random.rand(10) * 1e6, np.random.rand(10) * 1e-6, 'o')
ax2.format_coord = format_coord2
ax2.set_title('Subplot 2')

plt.tight_layout()
plt.show()
Output:
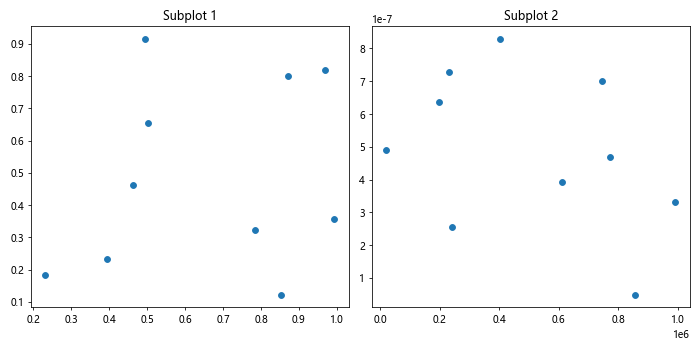
这个例子为两个子图设置了不同的格式化函数。
6. 极坐标图格式化
对于极坐标图,我们可能需要将笛卡尔坐标转换为极坐标:
import matplotlib.pyplot as plt
import numpy as np

def format_coord(theta, r):
    return f'θ={np.degrees(theta):.2f}°, r={r:.2f} (how2matplotlib.com)'

fig, ax = plt.subplots(subplot_kw=dict(projection='polar'))
theta = np.linspace(0, 2*np.pi, 100)
r = np.random.rand(100)
ax.plot(theta, r)
ax.format_coord = format_coord
plt.title('Polar coordinate formatting')
plt.show()
Output:
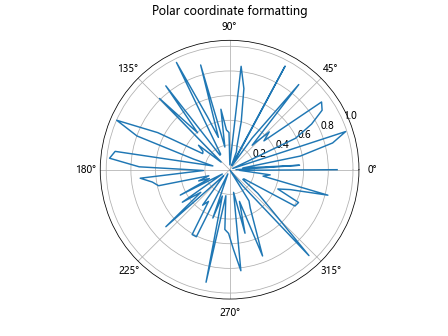
这个例子将极坐标图的角度转换为度数,并格式化显示。
7. 类别数据格式化
对于类别数据,我们可能需要将数值索引转换为实际的类别名称:
import matplotlib.pyplot as plt
import numpy as np

categories = ['Apple', 'Banana', 'Cherry', 'Date', 'Elderberry']

def format_coord(x, y):
    cat_index = int(round(x))
    if 0 <= cat_index < len(categories):
        category = categories[cat_index]
    else:
        category = 'Unknown'
    return f'Category: {category}, Value: {y:.2f} (how2matplotlib.com)'

fig, ax = plt.subplots()
x = np.arange(len(categories))
y = np.random.rand(len(categories)) * 100
ax.bar(x, y)
ax.set_xticks(x)
ax.set_xticklabels(categories)
ax.format_coord = format_coord
plt.title('Category data formatting')
plt.show()
Output:
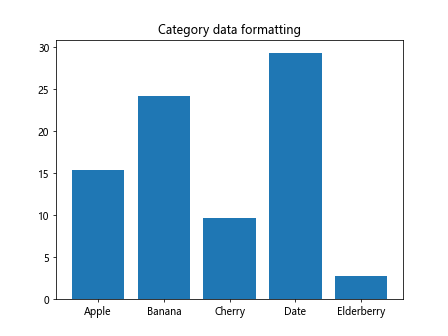
这个例子将x轴的数值索引转换为实际的水果类别名称。
8. 3D图形格式化
对于3D图形,我们需要处理三个坐标值:
import matplotlib.pyplot as plt
import numpy as np

def format_coord(x, y, z):
    return f'x={x:.2f}, y={y:.2f}, z={z:.2f} (how2matplotlib.com)'

fig = plt.figure()
ax = fig.add_subplot(111, projection='3d')
x, y = np.meshgrid(np.arange(-5, 5, 0.25), np.arange(-5, 5, 0.25))
z = np.sin(np.sqrt(x**2 + y**2))
surf = ax.plot_surface(x, y, z)
ax.format_coord = format_coord
plt.title('3D plot formatting')
plt.show()
Output:
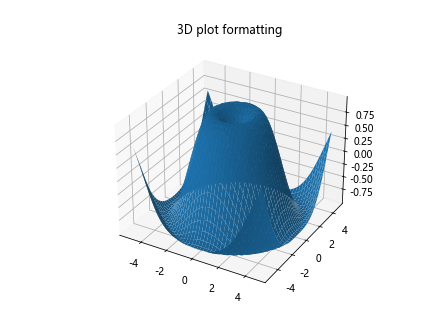
这个例子为3D图形提供了x、y、z三个坐标的格式化显示。
9. 颜色映射格式化
当使用颜色映射(colormap)时,我们可能想要显示颜色对应的数值:
import matplotlib.pyplot as plt
import numpy as np

def format_coord(x, y):
    z = np.sin(np.sqrt(x**2 + y**2))
    return f'x={x:.2f}, y={y:.2f}, z={z:.2f} (how2matplotlib.com)'

fig, ax = plt.subplots()
x, y = np.meshgrid(np.linspace(-5, 5, 100), np.linspace(-5, 5, 100))
z = np.sin(np.sqrt(x**2 + y**2))
im = ax.imshow(z, extent=[-5, 5, -5, 5], origin='lower', cmap='viridis')
plt.colorbar(im)
ax.format_coord = format_coord
plt.title('Colormap formatting')
plt.show()
Output:
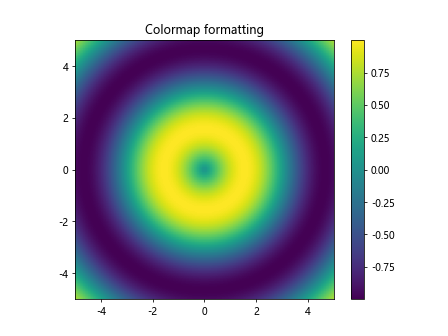
这个例子显示了颜色映射中每个点对应的z值。
10. 自定义工具提示
除了格式化坐标数据,我们还可以使用format_cursor_data()来创建自定义的工具提示:
import matplotlib.pyplot as plt
import numpy as np
from matplotlib.backends.backend_tkagg import FigureCanvasTkAgg
import tkinter as tk

def format_coord(x, y):
    return f'x={x:.2f}, y={y:.2f} (how2matplotlib.com)'

def update_tooltip(event):
    if event.inaxes:
        x, y = event.xdata, event.ydata
        tooltip.set_text(format_coord(x, y))
        tooltip.set_visible(True)
    else:
        tooltip.set_visible(False)
    canvas.draw_idle()

root = tk.Tk()
fig, ax = plt.subplots()
ax.plot(np.random.rand(10), np.random.rand(10), 'o')

canvas = FigureCanvasTkAgg(fig, master=root)
canvas.draw()
canvas.get_tk_widget().pack()

tooltip = ax.annotate("", xy=(0,0), xytext=(20,20), textcoords="offset points",
                      bbox=dict(boxstyle="round", fc="w"),
                      arrowprops=dict(arrowstyle="->"))
tooltip.set_visible(False)

canvas.mpl_connect("motion_notify_event", update_tooltip)

plt.title('Custom tooltip')
root.mainloop()
这个例子创建了一个自定义的工具提示,当鼠标移动时会更新显示的坐标信息。
11. 在动画中使用format_cursor_data()
在动画中使用format_cursor_data()可以为用户提供实时的数据反馈:
import matplotlib.pyplot as plt
import numpy as np
from matplotlib.animation import FuncAnimation

def format_coord(x, y):
    return f'Frame: {frame}, x={x:.2f}, y={y:.2f} (how2matplotlib.com)'

fig, ax = plt.subplots()
line, = ax.plot([], [], 'o-')
ax.set_xlim(0, 2*np.pi)
ax.set_ylim(-1, 1)

frame = 0

def update(num):
    global frame
    frame = num
    x = np.linspace(0, 2*np.pi, 100)
    y = np.sin(x + num/10.0)
    line.set_data(x, y)
    return line,

ani = FuncAnimation(fig, update, frames=100, interval=50, blit=True)
ax.format_coord = format_coord
plt.title('Animation with format_cursor_data()')
plt.show()
Output:
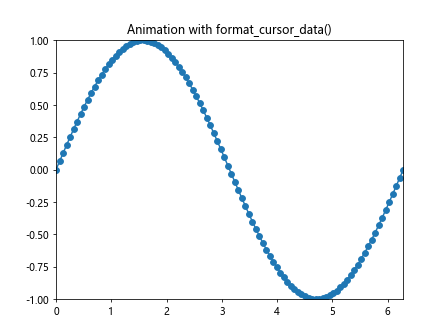
这个例子在动画中使用format_cursor_data(),显示当前帧数和坐标信息。
12. 在交互式图表中使用format_cursor_data()
在交互式图表中,format_cursor_data()可以提供更丰富的信息:
import matplotlib.pyplot as plt
import numpy as np

def format_coord(x, y):
    index = int(x)
    if 0 <= index < len(data):
        return f'Day: {index+1}, Temperature: {data[index]:.1f}°C, Feels like: {y:.1f}°C (how2matplotlib.com)'
    return ''

data = np.random.rand(30) * 10 + 20  # 30 days of temperature data

fig, ax= plt.subplots()
ax.plot(data, 'o-')
ax.set_xlabel('Day')
ax.set_ylabel('Temperature (°C)')
ax.format_coord = format_coord
plt.title('Interactive temperature chart')
plt.show()
Output:
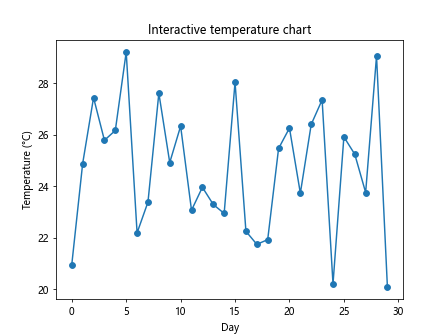
这个例子创建了一个交互式的温度图表,当鼠标悬停时显示具体的日期和温度信息。
13. 在热图中使用format_cursor_data()
热图是另一种可以benefitfrom format_cursor_data()的图表类型:
import matplotlib.pyplot as plt
import numpy as np

def format_coord(x, y):
    col = int(x)
    row = int(y)
    if 0 <= col < data.shape[1] and 0 <= row < data.shape[0]:
        z = data[row, col]
        return f'x={col}, y={row}, value={z:.2f} (how2matplotlib.com)'
    return ''

data = np.random.rand(10, 10)

fig, ax = plt.subplots()
im = ax.imshow(data, cmap='hot')
plt.colorbar(im)
ax.format_coord = format_coord
plt.title('Heatmap with format_cursor_data()')
plt.show()
Output:
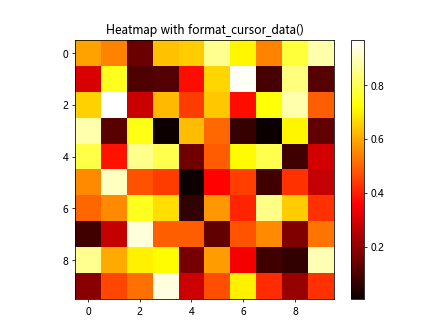
这个例子在热图中使用format_cursor_data(),显示每个单元格的具体数值。
14. 在金融图表中使用format_cursor_data()
对于金融数据,我们可能需要显示更多的相关信息:
import matplotlib.pyplot as plt
import numpy as np
import pandas as pd

def format_coord(x, y):
    index = int(x)
    if 0 <= index < len(data):
        date = data.index[index].strftime('%Y-%m-%d')
        open_price = data['Open'][index]
        high_price = data['High'][index]
        low_price = data['Low'][index]
        close_price = data['Close'][index]
        return f'Date: {date}, Open: {open_price:.2f}, High:{high_price:.2f}, Low: {low_price:.2f}, Close:{close_price:.2f} (how2matplotlib.com)'
    return ''

# Generate sample stock data
dates = pd.date_range(start='2023-01-01', periods=30)
data = pd.DataFrame({
    'Open': np.random.rand(30) * 10 + 100,
    'High': np.random.rand(30) * 10 + 105,
    'Low': np.random.rand(30) * 10 + 95,
    'Close': np.random.rand(30) * 10 + 100
}, index=dates)

fig, ax = plt.subplots(figsize=(10, 6))
ax.plot(data.index, data['Close'], label='Close Price')
ax.set_xlabel('Date')
ax.set_ylabel('Price ($)')
ax.format_coord = format_coord
plt.title('Stock Price Chart')
plt.legend()
plt.show()
Output:
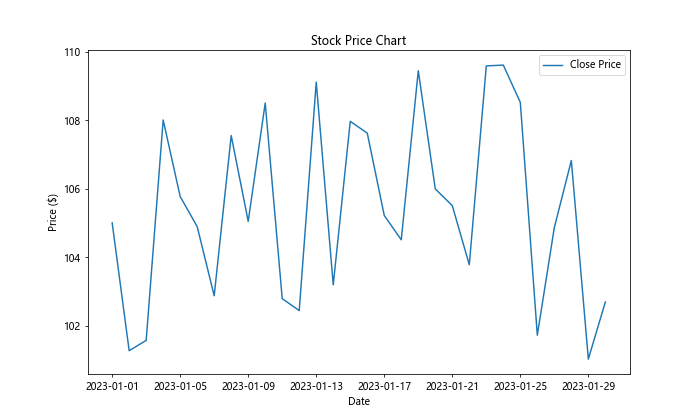
这个例子创建了一个股票价格图表,当鼠标悬停时显示该日期的开盘价、最高价、最低价和收盘价。
15. 在地图可视化中使用format_cursor_data()
当使用Matplotlib绘制地图时,format_cursor_data()可以用来显示地理坐标:
import matplotlib.pyplot as plt
import numpy as np
from mpl_toolkits.basemap import Basemap

def format_coord(x, y):
    lon, lat = m(x, y, inverse=True)
    return f'Longitude: {lon:.2f}, Latitude: {lat:.2f} (how2matplotlib.com)'

fig, ax = plt.subplots(figsize=(10, 8))
m = Basemap(projection='mill', llcrnrlat=-60, urcrnrlat=90, llcrnrlon=-180, urcrnrlon=180, resolution='c')
m.drawcoastlines()
m.drawcountries()
m.drawmapboundary(fill_color='aqua')
m.fillcontinents(color='coral', lake_color='aqua')

ax.format_coord = format_coord
plt.title('World Map with Coordinates')
plt.show()
Output:
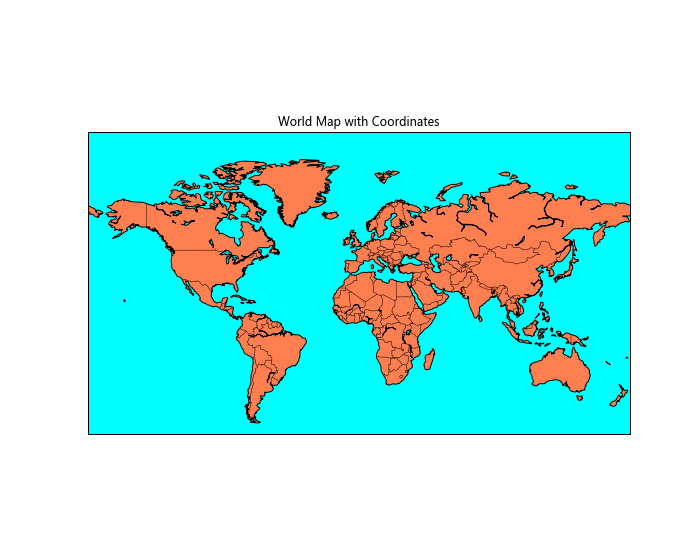
这个例子创建了一个世界地图,当鼠标悬停时显示经纬度坐标。
16. 在极坐标图中使用format_cursor_data()
对于极坐标图,我们可以将笛卡尔坐标转换为极坐标:
import matplotlib.pyplot as plt
import numpy as np

def format_coord(x, y):
    r = np.sqrt(x**2 + y**2)
    theta = np.arctan2(y, x)
    return f'r={r:.2f}, θ={np.degrees(theta):.2f}° (how2matplotlib.com)'

fig, ax = plt.subplots(subplot_kw=dict(projection='polar'))
r = np.linspace(0, 1, 100)
theta = 2 * 2*np.pi * r
ax.plot(theta, r)
ax.format_coord = format_coord
plt.title('Polar Plot with Coordinate Formatting')
plt.show()
Output:
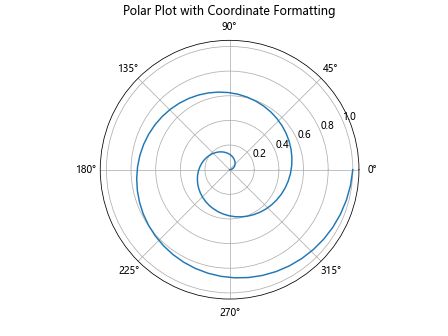
这个例子在极坐标图中使用format_cursor_data(),显示极坐标系下的r和θ值。
17. 在对数坐标图中使用format_cursor_data()
对于对数坐标图,我们可能需要显示真实值而不是对数值:
import matplotlib.pyplot as plt
import numpy as np

def format_coord(x, y):
    real_x = 10**x
    real_y = 10**y
    return f'x={real_x:.2e}, y={real_y:.2e} (how2matplotlib.com)'

fig, ax = plt.subplots()
x = np.logspace(0, 5, 100)
y = x**2
ax.loglog(x, y)
ax.format_coord = format_coord
plt.title('Log-Log Plot with Real Value Formatting')
plt.show()
Output:
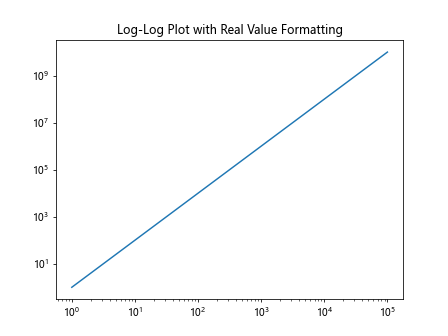
这个例子在对数-对数图中使用format_cursor_data(),显示真实值而不是对数值。
结论
Axis.format_cursor_data()函数是Matplotlib中一个强大而灵活的工具,它允许我们自定义鼠标悬停时显示的数据格式。通过本文的详细介绍和丰富的示例,我们可以看到这个函数在各种图表类型和应用场景中的潜力。
从简单的数值格式化到复杂的坐标转换,从静态图表到动画和交互式图表,format_cursor_data()都能够提供精确和有意义的信息。这不仅增强了图表的可读性,也提高了数据分析和可视化的效率。
在实际应用中,我们可以根据具体需求来定制format_cursor_data()函数。无论是科学计算、金融分析、地理信息系统还是其他领域,这个函数都能够帮助我们更好地理解和展示数据。
最后,值得注意的是,虽然format_cursor_data()函数功能强大,但它的使用也应该遵循数据可视化的基本原则:保持简洁、清晰和有意义。过于复杂的格式可能会影响用户体验,因此在设计时应该权衡信息量和可读性。
通过灵活运用Axis.format_cursor_data()函数,我们可以创建出更加专业、信息丰富的数据可视化作品,为数据分析和决策提供更有力的支持。
 极客笔记
极客笔记