Matplotlib 轴刻度旋转:如何使用 xticks 和 rotation 参数优化图表可读性
Matplotlib 是 Python 中最流行的数据可视化库之一,它提供了丰富的功能来创建各种类型的图表和绘图。在数据可视化过程中,我们经常会遇到 x 轴标签重叠或难以阅读的情况,特别是当标签较长或数据点较多时。为了解决这个问题,Matplotlib 提供了 xticks 函数和 rotation 参数,允许我们旋转 x 轴刻度标签,从而提高图表的可读性和美观性。本文将深入探讨如何使用 Matplotlib 的 xticks 和 rotation 功能来优化你的图表展示。
1. Matplotlib xticks 基础
在 Matplotlib 中,xticks 函数用于控制 x 轴刻度的位置和标签。它允许我们自定义 x 轴上显示的刻度,包括刻度的位置、标签内容以及其他属性。
让我们从一个简单的例子开始:
import matplotlib.pyplot as plt
import numpy as np

x = np.arange(5)
y = [2, 4, 1, 5, 3]

plt.figure(figsize=(8, 6))
plt.plot(x, y, marker='o')
plt.xticks(x, ['A', 'B', 'C', 'D', 'E'])
plt.title('Basic xticks example - how2matplotlib.com')
plt.show()
Output:
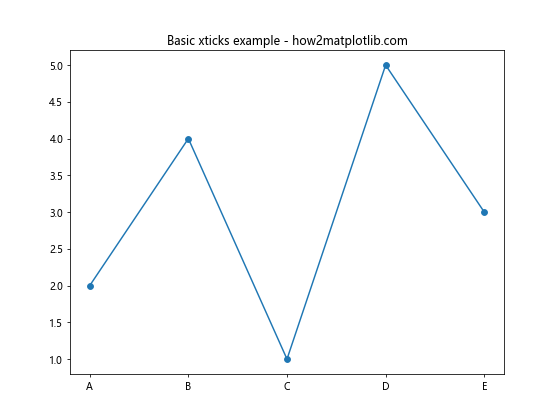
在这个例子中,我们创建了一个简单的线图,并使用 xticks 函数将 x 轴的刻度标签设置为 A、B、C、D 和 E。这个基本用法展示了如何自定义 x 轴刻度标签。
2. 使用 rotation 参数旋转刻度标签
当 x 轴标签较长或数量较多时,它们可能会重叠或难以阅读。这时,我们可以使用 rotation 参数来旋转标签,使其更易读。
import matplotlib.pyplot as plt
import numpy as np

x = np.arange(10)
y = np.random.rand(10)

plt.figure(figsize=(10, 6))
plt.bar(x, y)
plt.xticks(x, ['Long Label ' + str(i) for i in range(10)], rotation=45)
plt.title('Rotated xticks - how2matplotlib.com')
plt.tight_layout()
plt.show()
Output:
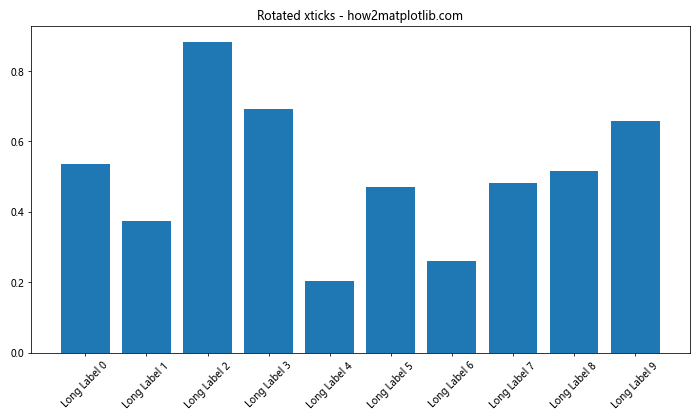
在这个例子中,我们创建了一个柱状图,并为每个柱子设置了较长的标签。通过将 rotation 参数设置为 45,我们使标签旋转了 45 度,有效避免了重叠问题。
3. 调整 rotation 角度
rotation 参数可以接受不同的角度值,让我们尝试不同的角度:
import matplotlib.pyplot as plt
import numpy as np

x = np.arange(8)
y = np.random.rand(8)

fig, (ax1, ax2, ax3) = plt.subplots(3, 1, figsize=(10, 15))

for ax, angle in zip([ax1, ax2, ax3], [30, 60, 90]):
    ax.bar(x, y)
    ax.set_xticks(x)
    ax.set_xticklabels(['Label ' + str(i) for i in range(8)], rotation=angle)
    ax.set_title(f'Rotation: {angle} degrees - how2matplotlib.com')

plt.tight_layout()
plt.show()
Output:
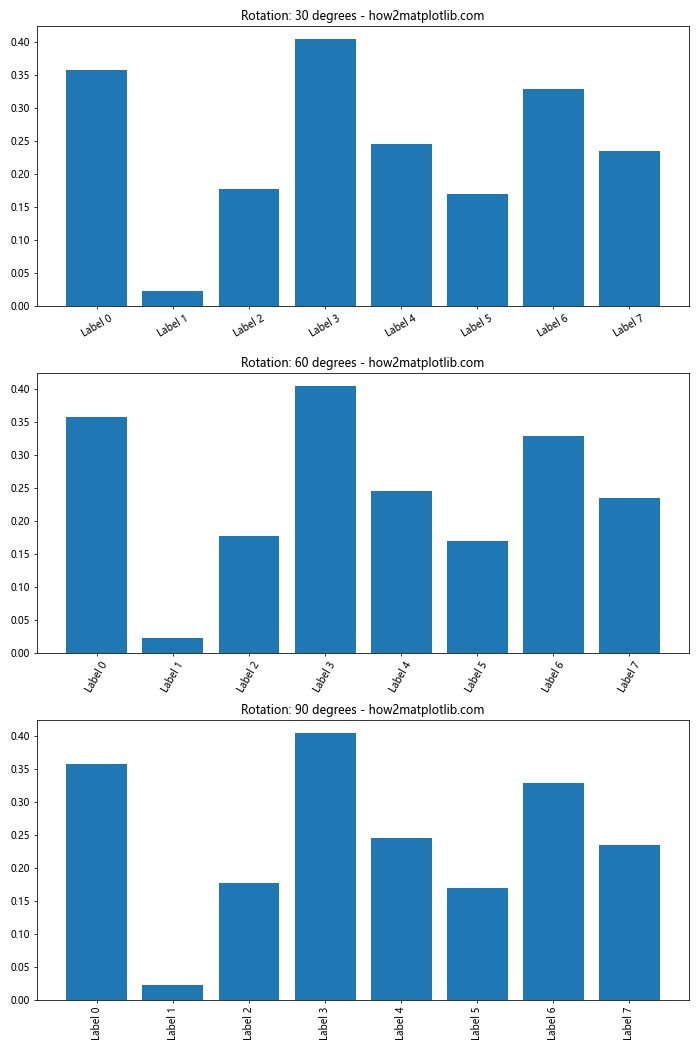
这个例子展示了 30 度、60 度和 90 度旋转的效果。你可以根据你的具体需求选择最适合的角度。
4. 使用 ha 参数调整对齐方式
当旋转标签时,有时标签的对齐方式可能不太理想。我们可以使用 ha(horizontal alignment)参数来调整标签的水平对齐方式:
import matplotlib.pyplot as plt
import numpy as np

x = np.arange(10)
y = np.random.rand(10)

plt.figure(figsize=(12, 6))
plt.bar(x, y)
plt.xticks(x, ['Long Label ' + str(i) for i in range(10)], rotation=45, ha='right')
plt.title('Rotated and aligned xticks - how2matplotlib.com')
plt.tight_layout()
plt.show()
Output:
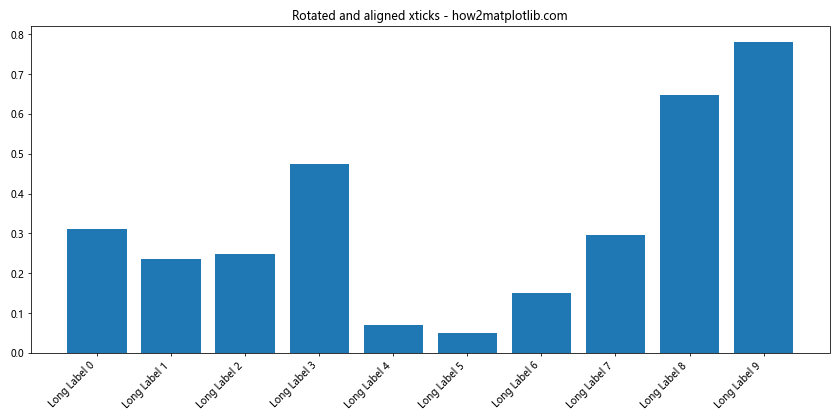
在这个例子中,我们将 ha 参数设置为 ‘right’,使旋转后的标签右对齐,这通常可以改善视觉效果。
5. 处理日期标签
在处理时间序列数据时,我们经常需要在 x 轴上显示日期。Matplotlib 提供了专门的日期处理功能:
import matplotlib.pyplot as plt
import matplotlib.dates as mdates
import pandas as pd

dates = pd.date_range(start='2023-01-01', end='2023-12-31', freq='M')
values = np.random.randn(len(dates))

plt.figure(figsize=(12, 6))
plt.plot(dates, values, marker='o')
plt.gca().xaxis.set_major_formatter(mdates.DateFormatter('%Y-%m-%d'))
plt.gca().xaxis.set_major_locator(mdates.MonthLocator())
plt.xticks(rotation=45)
plt.title('Time series with rotated date labels - how2matplotlib.com')
plt.tight_layout()
plt.show()
这个例子展示了如何处理日期标签并旋转它们。我们使用 pandas 创建日期范围,并使用 Matplotlib 的日期工具来格式化 x 轴。
6. 自定义刻度标签样式
除了旋转,我们还可以自定义刻度标签的其他样式,如字体大小、颜色等:
import matplotlib.pyplot as plt
import numpy as np

x = np.arange(5)
y = np.random.rand(5)

plt.figure(figsize=(10, 6))
plt.bar(x, y)
plt.xticks(x, ['Category ' + str(i) for i in range(5)],
           rotation=45,
           fontsize=12,
           color='blue',
           fontweight='bold')
plt.title('Customized xtick labels - how2matplotlib.com')
plt.tight_layout()
plt.show()
Output:
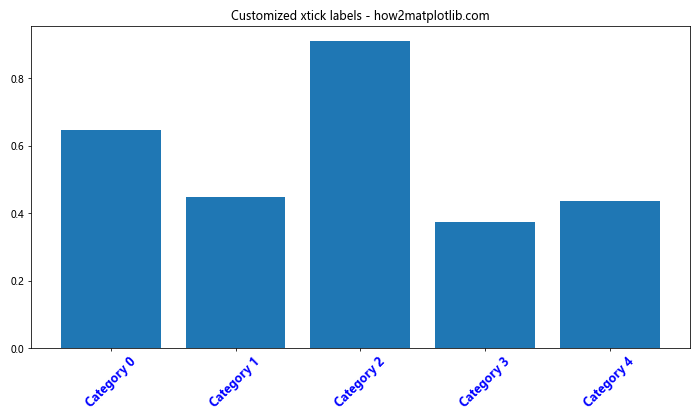
这个例子展示了如何更改刻度标签的字体大小、颜色和粗细,使其更加突出。
7. 处理长标签
当标签非常长时,即使旋转也可能无法完全解决问题。在这种情况下,我们可以考虑使用换行符或缩短标签:
import matplotlib.pyplot as plt
import numpy as np

x = np.arange(5)
y = np.random.rand(5)

long_labels = [
    'Very Long Label 1',
    'Extremely Long Label 2',
    'Incredibly Long Label 3',
    'Unbelievably Long Label 4',
    'Extraordinarily Long Label 5'
]

plt.figure(figsize=(12, 6))
plt.bar(x, y)
plt.xticks(x, ['\n'.join(label.split()) for label in long_labels], rotation=0)
plt.title('Long labels with line breaks - how2matplotlib.com')
plt.tight_layout()
plt.show()
Output:
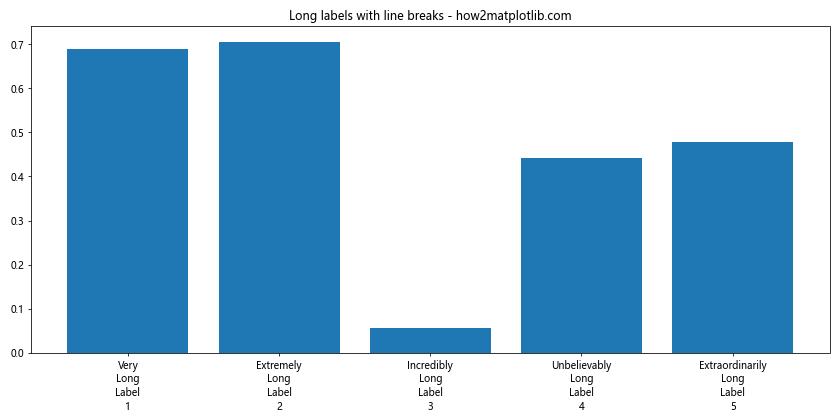
在这个例子中,我们使用换行符将长标签分成多行,避免了旋转的需要。
8. 在子图中应用 xticks 旋转
当我们有多个子图时,可能需要为每个子图单独设置 xticks 旋转:
import matplotlib.pyplot as plt
import numpy as np

x = np.arange(10)
y1 = np.random.rand(10)
y2 = np.random.rand(10)

fig, (ax1, ax2) = plt.subplots(2, 1, figsize=(10, 10))

ax1.bar(x, y1)
ax1.set_xticks(x)
ax1.set_xticklabels(['Label ' + str(i) for i in range(10)], rotation=45)
ax1.set_title('Subplot 1 - how2matplotlib.com')

ax2.bar(x, y2)
ax2.set_xticks(x)
ax2.set_xticklabels(['Label ' + str(i) for i in range(10)], rotation=30)
ax2.set_title('Subplot 2 - how2matplotlib.com')

plt.tight_layout()
plt.show()
Output:
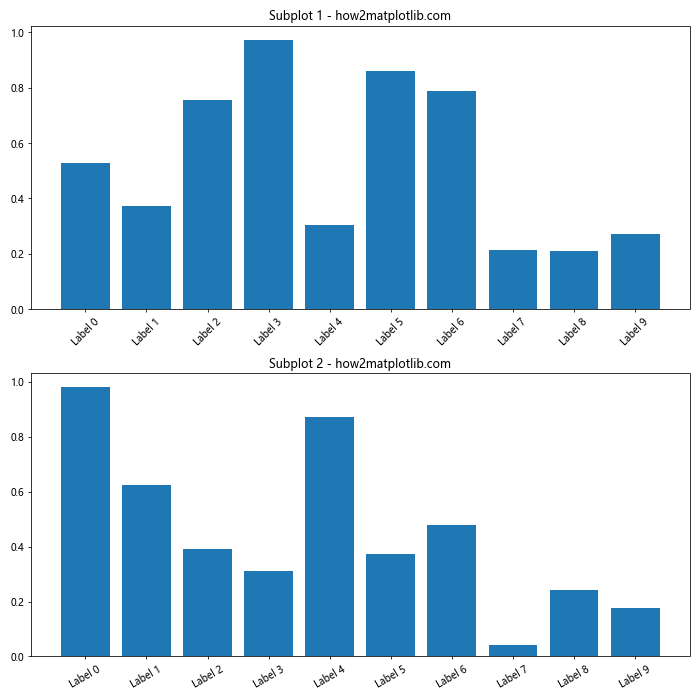
这个例子展示了如何在两个子图中分别设置不同的 xticks 旋转角度。
9. 动态调整 xticks
有时,我们可能需要根据数据动态调整 xticks 的数量和位置:
import matplotlib.pyplot as plt
import numpy as np

x = np.linspace(0, 10, 100)
y = np.sin(x)

plt.figure(figsize=(12, 6))
plt.plot(x, y)

# 动态设置 xticks
num_ticks = 10
plt.xticks(np.linspace(x.min(), x.max(), num_ticks), rotation=45)

plt.title('Dynamic xticks - how2matplotlib.com')
plt.tight_layout()
plt.show()
Output:
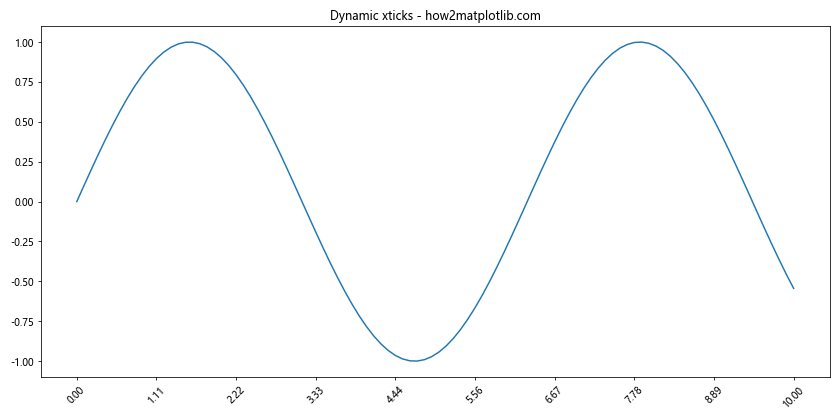
这个例子展示了如何根据数据范围动态设置 xticks 的数量和位置。
10. 使用 FuncFormatter 自定义标签格式
对于更复杂的标签格式化需求,我们可以使用 FuncFormatter:
import matplotlib.pyplot as plt
import matplotlib.ticker as ticker
import numpy as np

def format_func(value, tick_number):
    return f"Val: {value:.2f}\nHow2matplotlib.com"

x = np.arange(0, 5, 0.5)
y = np.sin(x)

fig, ax = plt.subplots(figsize=(12, 6))
ax.plot(x, y)

ax.xaxis.set_major_formatter(ticker.FuncFormatter(format_func))
plt.xticks(rotation=45)

plt.title('Custom formatted xticks - how2matplotlib.com')
plt.tight_layout()
plt.show()
Output:
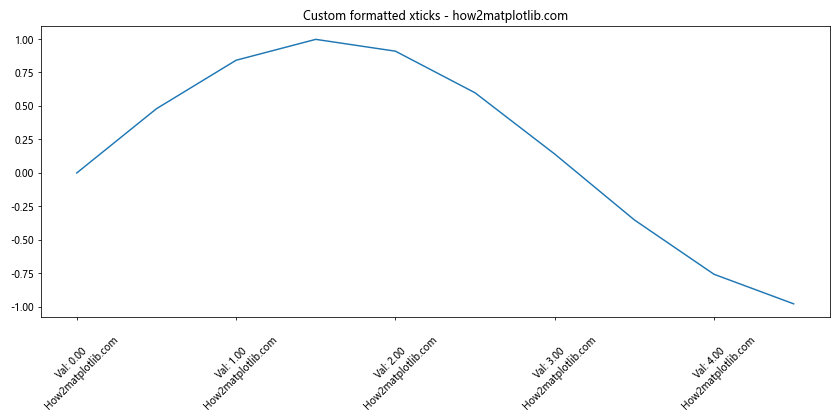
这个例子展示了如何使用自定义函数来格式化 xticks 标签,我们可以在标签中添加额外的信息或进行复杂的格式化。
11. 处理重叠问题
即使旋转标签,有时仍然可能出现重叠。我们可以通过调整图形大小或减少刻度数量来解决这个问题:
import matplotlib.pyplot as plt
import numpy as np

x = np.arange(20)
y = np.random.rand(20)

plt.figure(figsize=(15, 6))
plt.bar(x, y)

# 只显示每隔一个刻度
plt.xticks(x[::2], [f'Label {i}\nhow2matplotlib.com' for i in x[::2]], rotation=45)

plt.title('Handling overlapping labels')
plt.tight_layout()
plt.show()
Output:
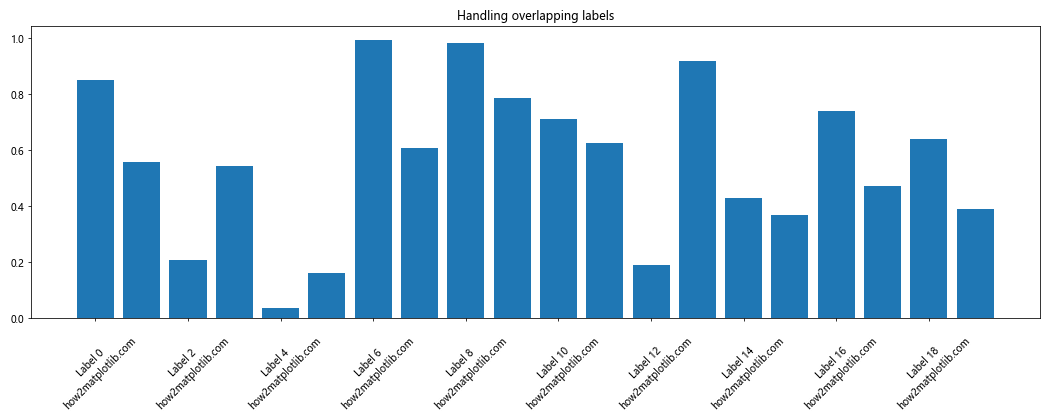
在这个例子中,我们通过只显示每隔一个刻度来减少重叠,同时增加了图形的宽度。
12. 在极坐标图中旋转标签
xticks 旋转不仅适用于笛卡尔坐标系,也可以应用于极坐标图:
import matplotlib.pyplot as plt
import numpy as np

theta = np.linspace(0, 2*np.pi, 8, endpoint=False)
r = np.random.rand(8)

fig, ax = plt.subplots(subplot_kw=dict(projection='polar'), figsize=(8, 8))
ax.bar(theta, r, width=0.3)

ax.set_xticks(theta)
ax.set_xticklabels([f'Direction {i}\nhow2matplotlib.com' for i in range(8)], rotation=0)

plt.title('Polar plot with rotated labels')
plt.tight_layout()
plt.show()
Output:
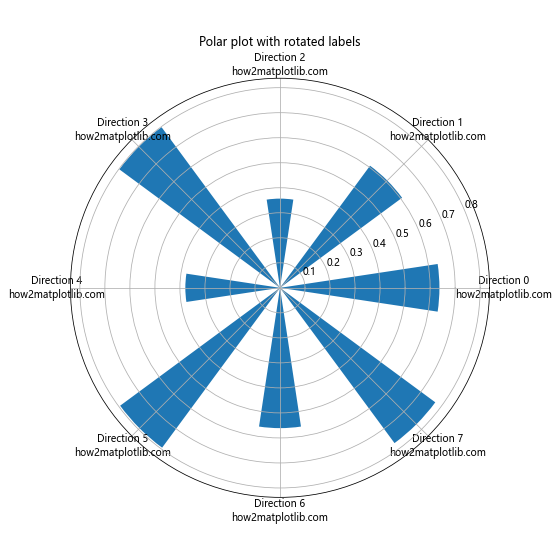
这个例子展示了如何在极坐标图中设置和旋转标签。
13. 使用 seaborn 与 Matplotlib 结合
Seaborn 是建立在 Matplotlib 之上的统计数据可视化库,我们可以结合使用它们来创建更美观的图表:
import matplotlib.pyplot as plt
import seaborn as sns
import numpy as np

sns.set_style("whitegrid")

x = np.arange(10)
y = np.random.rand(10)

plt.figure(figsize=(12, 6))
sns.barplot(x=x, y=y)

plt.xticks(x, [f'Category {i}\nhow2matplotlib.com' for i in x], rotation=45, ha='right')
plt.title('Seaborn and Matplotlib combined')
plt.tight_layout()
plt.show()
Output:
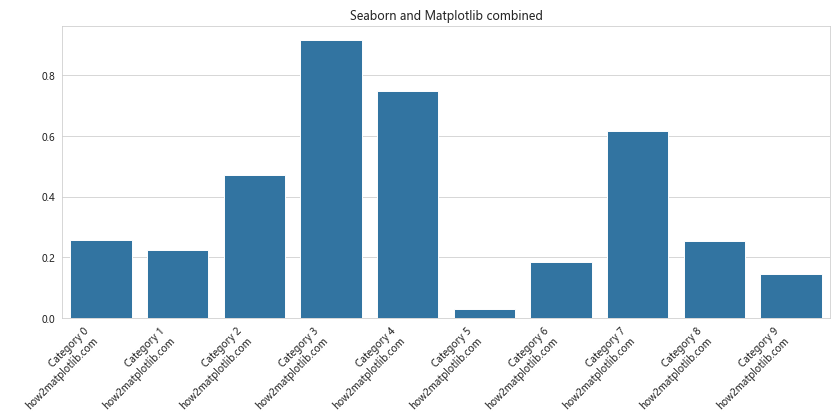
这个例子展示了如何结合 Seaborn 的样式和 Matplotlib 的 xticks 功能来创建美观的图表。
14. 在 3D 图中旋转标签
Matplotlib 也支持 3D 图形,我们同样可以在 3D 图中旋转 xticks:
import matplotlib.pyplot as plt
import numpy as np

fig = plt.figure(figsize=(12, 8))
ax = fig.add_subplot(111, projection='3d')

x = np.arange(5)
y = np.arange(5)
z = np.random.rand(5, 5)

x, y = np.meshgrid(x, y)
ax.plot_surface(x, y, z)

ax.set_xticks(range(5))
ax.set_xticklabels([f'X{i}\nhow2matplotlib.com' for i in range(5)], rotation=45)
ax.set_yticks(range(5))
ax.set_yticklabels([f'Y{i}' for i in range(5)], rotation=45)

plt.title('3D plot with rotated labels')
plt.tight_layout()
plt.show()
Output:
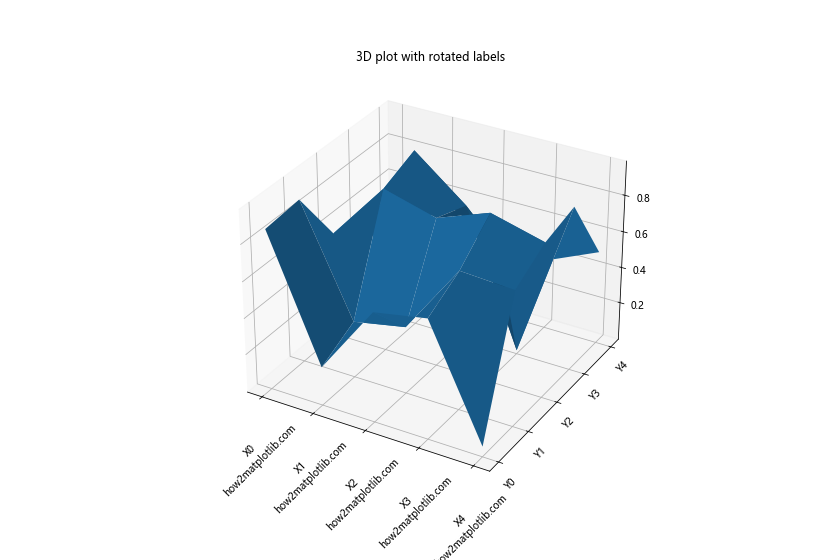
这个例子展示了如何在 3D 图中旋转 x 轴和 y 轴的标签。
15. 处理时间序列数据的高级技巧
当处理大量时间序列数据时,我们可能需要更高级的技巧来处理 xticks:
import matplotlib.pyplot as plt
import pandas as pd
import numpy as np

# 创建一年的每日数据
dates = pd.date_range(start='2023-01-01', end='2023-12-31', freq='D')
values = np.cumsum(np.random.randn(len(dates)))

fig, ax = plt.subplots(figsize=(15, 6))
ax.plot(dates, values)

# 设置主要刻度为每月第一天
ax.xaxis.set_major_locator(plt.MonthLocator())
# 设置次要刻度为每周一
ax.xaxis.set_minor_locator(plt.WeekdayLocator(byweekday=0))

# 格式化主要刻度标签
ax.xaxis.set_major_formatter(plt.DateFormatter('%Y-%m'))

# 旋转并对齐标签
plt.setp(ax.xaxis.get_majorticklabels(), rotation=45, ha='right')

plt.title('Advanced time series handling - how2matplotlib.com')
plt.tight_layout()
plt.show()
这个例子展示了如何处理大量时间序列数据,设置主要和次要刻度,并格式化日期标签。
16. 使用 MultipleLocator 设置固定间隔的刻度
有时我们可能希望以固定的间隔设置刻度,可以使用 MultipleLocator:
import matplotlib.pyplot as plt
import numpy as np
from matplotlib.ticker import MultipleLocator

x = np.linspace(0, 10, 100)
y = np.sin(x)

fig, ax = plt.subplots(figsize=(12, 6))
ax.plot(x, y)

# 设置 x 轴每 0.5 单位一个刻度
ax.xaxis.set_major_locator(MultipleLocator(0.5))

plt.xticks(rotation=45)
plt.title('Fixed interval ticks - how2matplotlib.com')
plt.tight_layout()
plt.show()
Output:
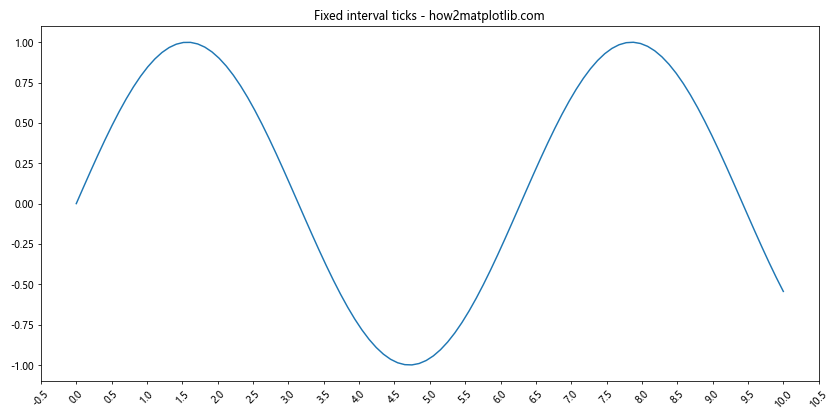
这个例子展示了如何使用 MultipleLocator 来设置固定间隔的刻度。
17. 在箱线图中旋转标签
箱线图是另一种常见的图表类型,我们同样可以旋转其 x 轴标签:
import matplotlib.pyplot as plt
import numpy as np

data = [np.random.normal(0, std, 100) for std in range(1, 6)]
labels = ['Group A', 'Group B', 'Group C', 'Group D', 'Group E']

fig, ax = plt.subplots(figsize=(10, 6))
ax.boxplot(data)

ax.set_xticklabels([f'{label}\nhow2matplotlib.com' for label in labels], rotation=45, ha='right')
plt.title('Box plot with rotated labels')
plt.tight_layout()
plt.show()
Output:
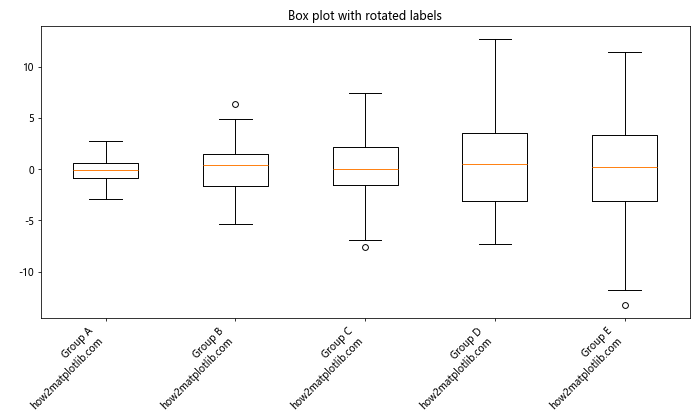
这个例子展示了如何在箱线图中旋转和自定义 x 轴标签。
18. 处理分类数据
对于分类数据,我们可能需要特别注意标签的处理:
import matplotlib.pyplot as plt
import numpy as np

categories = ['Category A', 'Category B', 'Category C', 'Category D', 'Category E']
values = np.random.rand(len(categories))

fig, ax = plt.subplots(figsize=(10, 6))
bars = ax.bar(categories, values)

# 在柱子上方添加数值标签
for bar in bars:
    height = bar.get_height()
    ax.text(bar.get_x() + bar.get_width()/2., height,
            f'{height:.2f}',
            ha='center', va='bottom')

plt.xticks(rotation=45, ha='right')
plt.title('Categorical data with rotated labels - how2matplotlib.com')
plt.tight_layout()
plt.show()
Output:
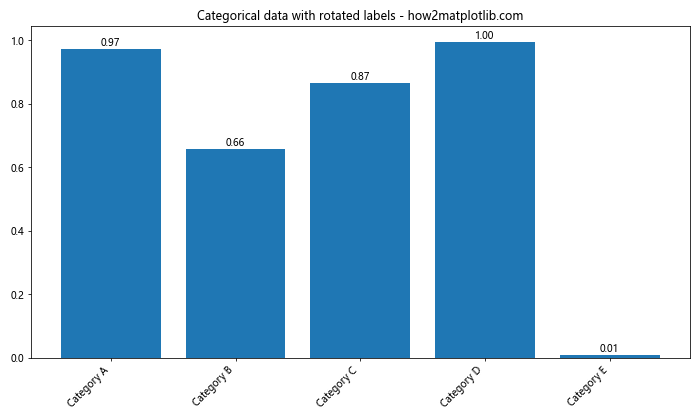
这个例子展示了如何处理分类数据,旋转标签,并在柱子上方添加数值标签。
19. 使用 GridSpec 创建复杂布局
对于更复杂的图表布局,我们可以使用 GridSpec,并为每个子图单独设置 xticks:
import matplotlib.pyplot as plt
import matplotlib.gridspec as gridspec
import numpy as np

fig = plt.figure(figsize=(15, 10))
gs = gridspec.GridSpec(2, 2)

ax1 = fig.add_subplot(gs[0, 0])
ax2 = fig.add_subplot(gs[0, 1])
ax3 = fig.add_subplot(gs[1, :])

x = np.arange(10)
y1, y2, y3 = np.random.rand(3, 10)

ax1.bar(x, y1)
ax1.set_title('Subplot 1 - how2matplotlib.com')
ax1.set_xticks(x)
ax1.set_xticklabels([f'L{i}' for i in x], rotation=45)

ax2.scatter(x, y2)
ax2.set_title('Subplot 2 - how2matplotlib.com')
ax2.set_xticks(x)
ax2.set_xticklabels([f'P{i}' for i in x], rotation=30)

ax3.plot(x, y3, marker='o')
ax3.set_title('Subplot 3 - how2matplotlib.com')
ax3.set_xticks(x)
ax3.set_xticklabels([f'Point {i}' for i in x], rotation=60)

plt.tight_layout()
plt.show()
Output:
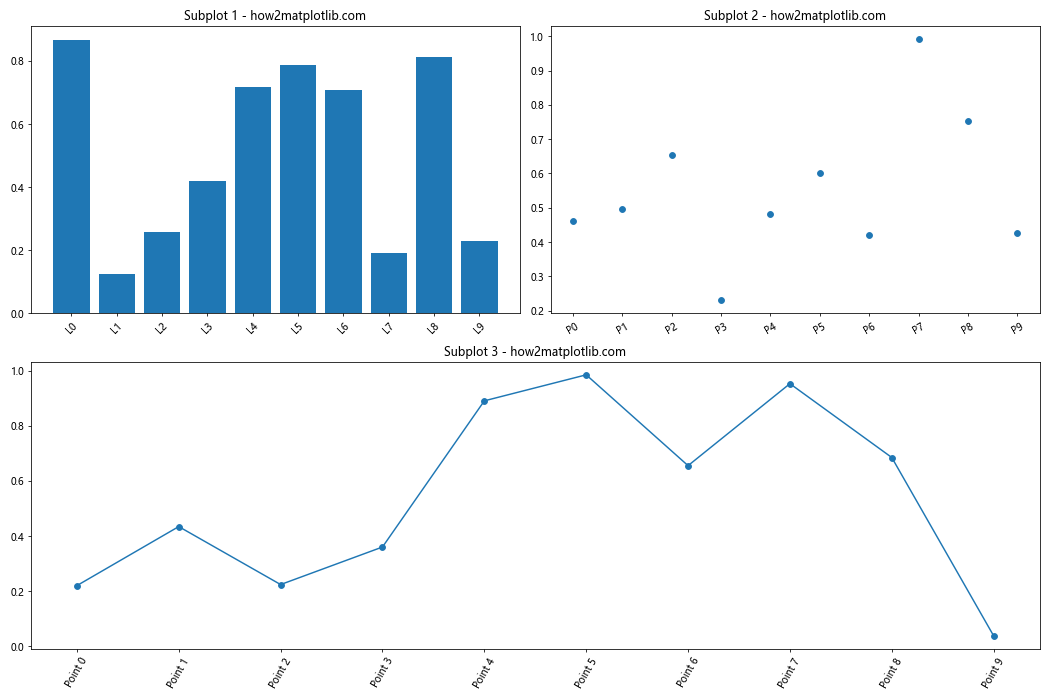
这个例子展示了如何使用 GridSpec 创建复杂的图表布局,并为每个子图单独设置 xticks 旋转。
20. 使用 ax.tick_params() 进行更细致的控制
最后,我们可以使用 ax.tick_params() 方法对刻度进行更细致的控制:
import matplotlib.pyplot as plt
import numpy as np

x = np.arange(10)
y = np.random.rand(10)

fig, ax = plt.subplots(figsize=(12, 6))
ax.bar(x, y)

ax.set_xticks(x)
ax.set_xticklabels([f'Label {i}\nhow2matplotlib.com' for i in x])

ax.tick_params(axis='x',
               rotation=45,
               colors='blue',
               labelsize=10,
               pad=5)

plt.title('Fine-tuned tick parameters')
plt.tight_layout()
plt.show()
Output:
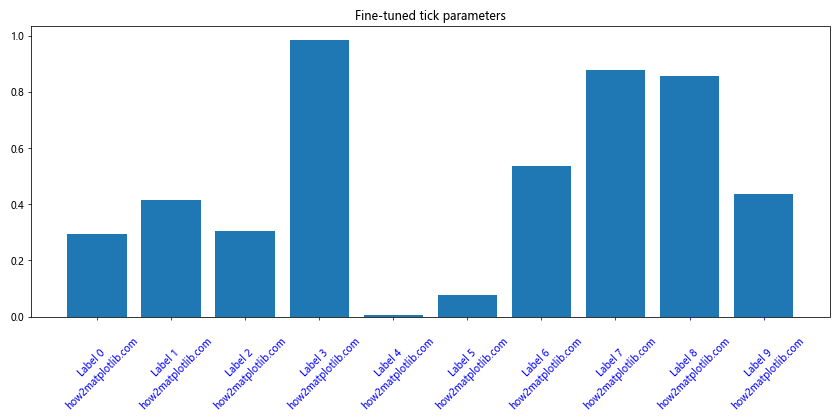
这个例子展示了如何使用 ax.tick_params() 方法来精细控制刻度的各种属性,包括旋转角度、颜色、大小和间距等。
总结起来,Matplotlib 的 xticks 和 rotation 功能为我们提供了强大的工具来优化图表的可读性和美观性。通过调整刻度标签的旋转角度、对齐方式、字体样式等,我们可以有效地处理各种数据可视化场景,从简单的条形图到复杂的时间序列数据。在实际应用中,根据具体的数据特征和展示需求,灵活运用这些技巧可以大大提升图表的质量和信息传达效果。
此外,我们还探讨了如何处理长标签、动态调整刻度、自定义格式化、处理重叠问题等高级技巧。这些方法不仅适用于常见的 2D 图表,也可以应用于 3D 图表和极坐标图。通过结合 Seaborn 等其他库,我们还可以进一步增强图表的视觉吸引力。
在数据可视化过程中,清晰易读的轴标签对于正确解读数据至关重要。通过掌握 Matplotlib 的 xticks 和 rotation 功能,数据科学家和分析师可以创建更专业、更有洞察力的可视化作品,有效地传达数据中的关键信息和模式。无论是在学术研究、商业报告还是数据新闻中,这些技能都将大有用武之地。
最后,值得注意的是,虽然我们主要讨论了 x 轴的标签旋转,但这些技巧同样适用于 y 轴。在某些情况下,旋转 y 轴标签也可能提高图表的可读性。实践中,应根据具体的数据和展示需求,灵活运用这些技巧,以创建最佳的数据可视化效果。
 极客笔记
极客笔记