Matplotlib 双色单线图:如何在一条线上绘制两种颜色
参考:matplotlib two colors one line
Matplotlib 是 Python 中最流行的数据可视化库之一,它提供了丰富的绘图功能。在数据可视化中,有时我们需要在同一条线上使用两种不同的颜色来突出显示某些特定的数据段或区间。这种技术被称为”双色单线图”,它可以有效地展示数据的变化趋势和重要节点。本文将详细介绍如何使用 Matplotlib 创建双色单线图,并提供多个实用的示例代码。
1. 双色单线图的基本概念
双色单线图是指在一条连续的线上使用两种不同的颜色来表示数据。这种图表类型通常用于以下场景:
- 突出显示数据的某个特定区间
- 区分数据的正负值
- 标记数据的阈值或临界点
- 展示数据的不同状态或类别
使用双色单线图可以在不增加图表复杂度的情况下,提供更多的信息和视觉吸引力。
2. 使用 Matplotlib 创建双色单线图的基本方法
要创建双色单线图,我们可以使用 Matplotlib 的 plot() 函数来绘制两段不同颜色的线,然后将它们连接起来。以下是一个基本的示例:
import matplotlib.pyplot as plt
import numpy as np

# 生成数据
x = np.linspace(0, 10, 100)
y = np.sin(x)

# 创建图形和坐标轴
fig, ax = plt.subplots()

# 绘制两段不同颜色的线
ax.plot(x[:50], y[:50], color='blue', label='First half')
ax.plot(x[49:], y[49:], color='red', label='Second half')

# 设置标题和标签
ax.set_title('How2matplotlib.com: Two Colors One Line')
ax.set_xlabel('X-axis')
ax.set_ylabel('Y-axis')

# 添加图例
ax.legend()

# 显示图形
plt.show()
Output:
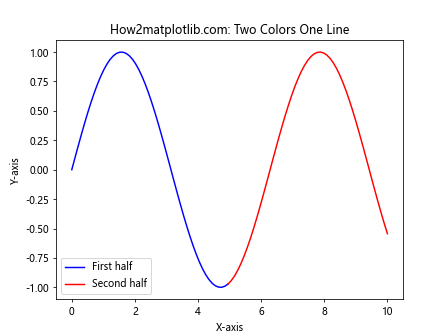
在这个示例中,我们首先生成了一组正弦波数据。然后,我们使用 plot() 函数分别绘制了前半部分(蓝色)和后半部分(红色)的线。注意,我们在两段线的连接处使用了重叠的点(索引 49),以确保线条是连续的。
3. 使用 where 参数创建双色单线图
Matplotlib 提供了一种更简洁的方法来创建双色单线图,那就是使用 plot() 函数的 where 参数。这种方法可以根据条件来决定线条的颜色。以下是一个示例:
import matplotlib.pyplot as plt
import numpy as np

# 生成数据
x = np.linspace(0, 10, 100)
y = np.sin(x)

# 创建图形和坐标轴
fig, ax = plt.subplots()

# 使用 where 参数绘制双色线
ax.plot(x, y, 'b', where=(y > 0), label='Positive')
ax.plot(x, y, 'r', where=(y <= 0), label='Non-positive')

# 设置标题和标签
ax.set_title('How2matplotlib.com: Two Colors One Line using where')
ax.set_xlabel('X-axis')
ax.set_ylabel('Y-axis')

# 添加图例
ax.legend()

# 显示图形
plt.show()
在这个示例中,我们使用 where 参数来指定何时使用蓝色(y > 0)和红色(y <= 0)。这种方法更加简洁,并且可以轻松处理复杂的条件。
4. 使用 np.ma.masked_where() 创建双色单线图
另一种创建双色单线图的方法是使用 NumPy 的 ma.masked_where() 函数。这个函数可以根据条件创建掩码数组,我们可以利用这个特性来绘制不同颜色的线段。以下是一个示例:
import matplotlib.pyplot as plt
import numpy as np

# 生成数据
x = np.linspace(0, 10, 100)
y = np.sin(x)

# 创建掩码数组
y_pos = np.ma.masked_where(y <= 0, y)
y_neg = np.ma.masked_where(y > 0, y)

# 创建图形和坐标轴
fig, ax = plt.subplots()

# 绘制双色线
ax.plot(x, y_pos, 'b', label='Positive')
ax.plot(x, y_neg, 'r', label='Non-positive')

# 设置标题和标签
ax.set_title('How2matplotlib.com: Two Colors One Line using masked arrays')
ax.set_xlabel('X-axis')
ax.set_ylabel('Y-axis')

# 添加图例
ax.legend()

# 显示图形
plt.show()
Output:
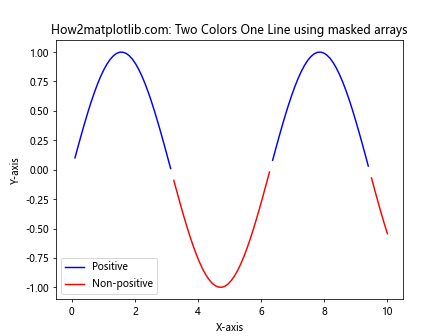
在这个示例中,我们使用 np.ma.masked_where() 创建了两个掩码数组:一个用于正值,另一个用于非正值。然后,我们分别绘制这两个掩码数组,得到了双色单线图。
5. 使用渐变色创建双色单线图
除了使用两种固定的颜色,我们还可以使用颜色渐变来创建更加平滑的双色单线图。这种方法可以使用 Matplotlib 的 LineCollection 类来实现。以下是一个示例:
import matplotlib.pyplot as plt
import numpy as np
from matplotlib.collections import LineCollection

# 生成数据
x = np.linspace(0, 10, 100)
y = np.sin(x)

# 创建点对
points = np.array([x, y]).T.reshape(-1, 1, 2)
segments = np.concatenate([points[:-1], points[1:]], axis=1)

# 创建颜色映射
norm = plt.Normalize(-1, 1)
lc = LineCollection(segments, cmap='coolwarm', norm=norm)
lc.set_array(y)

# 创建图形和坐标轴
fig, ax = plt.subplots()

# 添加线条集合
ax.add_collection(lc)

# 设置坐标轴范围
ax.set_xlim(x.min(), x.max())
ax.set_ylim(y.min(), y.max())

# 设置标题和标签
ax.set_title('How2matplotlib.com: Two Colors One Line with Gradient')
ax.set_xlabel('X-axis')
ax.set_ylabel('Y-axis')

# 添加颜色条
plt.colorbar(lc)

# 显示图形
plt.show()
Output:
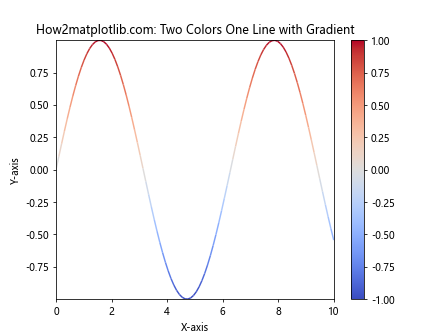
在这个示例中,我们使用 LineCollection 创建了一个线条集合,并使用 ‘coolwarm’ 颜色映射来表示数据的正负值。这种方法可以创建一个平滑的颜色渐变效果。
6. 使用阈值创建双色单线图
在某些情况下,我们可能需要根据某个阈值来区分线条的颜色。以下是一个使用阈值创建双色单线图的示例:
import matplotlib.pyplot as plt
import numpy as np

# 生成数据
x = np.linspace(0, 10, 100)
y = np.sin(x) + np.random.normal(0, 0.1, 100)

# 设置阈值
threshold = 0.5

# 创建图形和坐标轴
fig, ax = plt.subplots()

# 绘制双色线
ax.plot(x, y, 'b', where=(y <= threshold), label='Below threshold')
ax.plot(x, y, 'r', where=(y > threshold), label='Above threshold')

# 添加阈值线
ax.axhline(y=threshold, color='g', linestyle='--', label='Threshold')

# 设置标题和标签
ax.set_title('How2matplotlib.com: Two Colors One Line with Threshold')
ax.set_xlabel('X-axis')
ax.set_ylabel('Y-axis')

# 添加图例
ax.legend()

# 显示图形
plt.show()
在这个示例中,我们设置了一个阈值 0.5,并根据数据是否超过这个阈值来决定线条的颜色。我们还添加了一条绿色虚线来表示阈值。
7. 创建多段双色单线图
有时,我们可能需要在一条线上使用多个颜色段。以下是一个创建多段双色单线图的示例:
import matplotlib.pyplot as plt
import numpy as np

# 生成数据
x = np.linspace(0, 10, 100)
y = np.sin(x)

# 定义颜色变化点
change_points = [2, 4, 6, 8]

# 创建图形和坐标轴
fig, ax = plt.subplots()

# 绘制多段双色线
colors = ['red', 'blue', 'green', 'purple', 'orange']
for i in range(len(change_points) + 1):
    start = change_points[i-1] if i > 0 else 0
    end = change_points[i] if i < len(change_points) else 10
    mask = (x >= start) & (x <= end)
    ax.plot(x[mask], y[mask], color=colors[i], label=f'Segment {i+1}')

# 设置标题和标签
ax.set_title('How2matplotlib.com: Multi-segment Two Colors One Line')
ax.set_xlabel('X-axis')
ax.set_ylabel('Y-axis')

# 添加图例
ax.legend()

# 显示图形
plt.show()
Output:
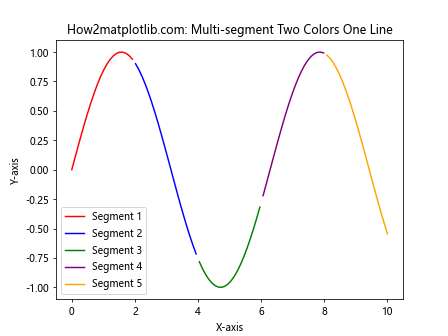
在这个示例中,我们定义了多个颜色变化点,并使用循环来绘制不同颜色的线段。这种方法可以轻松地创建具有多个颜色段的单线图。
8. 使用自定义颜色映射创建双色单线图
Matplotlib 允许我们创建自定义的颜色映射,这可以用来创建更加个性化的双色单线图。以下是一个使用自定义颜色映射的示例:
import matplotlib.pyplot as plt
import numpy as np
from matplotlib.colors import LinearSegmentedColormap

# 生成数据
x = np.linspace(0, 10, 100)
y = np.sin(x)

# 创建自定义颜色映射
colors = ['blue', 'white', 'red']
n_bins = 100
cmap = LinearSegmentedColormap.from_list('custom_cmap', colors, N=n_bins)

# 创建图形和坐标轴
fig, ax = plt.subplots()

# 使用自定义颜色映射绘制线条
points = np.array([x, y]).T.reshape(-1, 1, 2)
segments = np.concatenate([points[:-1], points[1:]], axis=1)
norm = plt.Normalize(-1, 1)
lc = plt.LineCollection(segments, cmap=cmap, norm=norm)
lc.set_array(y)
line = ax.add_collection(lc)

# 设置坐标轴范围
ax.set_xlim(x.min(), x.max())
ax.set_ylim(y.min(), y.max())

# 设置标题和标签
ax.set_title('How2matplotlib.com: Two Colors One Line with Custom Colormap')
ax.set_xlabel('X-axis')
ax.set_ylabel('Y-axis')

# 添加颜色条
plt.colorbar(line)

# 显示图形
plt.show()
在这个示例中,我们创建了一个从蓝色到白色再到红色的自定义颜色映射。这种方法可以让我们更精细地控制线条的颜色变化。
9. 使用填充区域强调双色单线图
我们可以使用填充区域来进一步强调双色单线图中的不同部分。以下是一个使用填充区域的示例:
import matplotlib.pyplot as plt
import numpy as np

# 生成数据
x = np.linspace(0, 10, 100)
y = np.sin(x)

# 创建图形和坐标轴
fig, ax = plt.subplots()

# 绘制双色线
ax.plot(x, y, 'k', label='Sine wave')

# 填充正值区域
ax.fill_between(x, y, 0, where=(y > 0), color='blue', alpha=0.3, label='Positive')

# 填充负值区域
ax.fill_between(x, y, 0, where=(y <= 0), color='red', alpha=0.3, label='Non-positive')

# 设置标题和标签
ax.set_title('How2matplotlib.com: Two Colors One Line with Filled Areas')
ax.set_xlabel('X-axis')
ax.set_ylabel('Y-axis')

# 添加图例
ax.legend()

# 显示图形
plt.show()
Output:
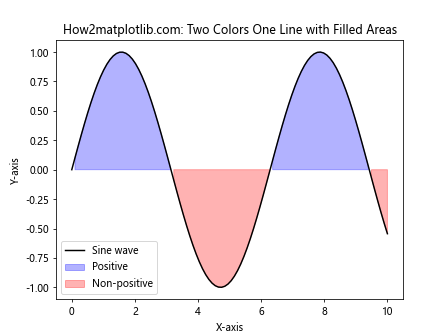
在这个示例中,我们使用 fill_between() 函数来填充线条上方和下方的区域,从而更清晰地展示正值和负值的分布。
10. 创建动态双色单线图
我们还可以创建动态的双色单线图,让颜色随时间变化。以下是一个使用动画创建动态双色单线图的示例:
import matplotlib.pyplot as plt
import numpy as np
from matplotlib.animation import FuncAnimation

# 生成数据
x = np.linspace(0, 10, 100)
y = np.sin(x)

# 创建图形和坐标轴
fig, ax = plt.subplots()
line, = ax.plot([],[], 'k')

# 设置坐标轴范围
ax.set_xlim(x.min(), x.max())
ax.set_ylim(y.min(), y.max())

# 设置标题和标签
ax.set_title('How2matplotlib.com: Dynamic Two Colors One Line')
ax.set_xlabel('X-axis')
ax.set_ylabel('Y-axis')

# 定义动画更新函数
def update(frame):
    threshold = np.sin(frame / 10)
    colors = np.where(y > threshold, 'red', 'blue')
    line.set_data(x[:frame], y[:frame])
    line.set_color(colors[:frame])
    return line,

# 创建动画
anim = FuncAnimation(fig, update, frames=len(x), interval=50, blit=True)

# 显示动画
plt.show()
在这个示例中,我们使用 FuncAnimation 创建了一个动画,其中线条的颜色根据动态变化的阈值而改变。这种方法可以用来展示数据随时间的变化趋势。
11. 使用双色单线图展示股票价格变化
双色单线图在金融数据可视化中特别有用,例如用来展示股票价格的涨跌。以下是一个示例:
import matplotlib.pyplot as plt
import numpy as np
import pandas as pd

# 生成模拟的股票价格数据
dates = pd.date_range(start='2023-01-01', end='2023-12-31', freq='D')
prices = 100 + np.cumsum(np.random.randn(len(dates)) * 0.5)

# 计算价格变化
price_change = prices - prices[0]

# 创建图形和坐标轴
fig, ax = plt.subplots(figsize=(12, 6))

# 绘制双色线
ax.plot(dates, prices, 'g', where=(price_change >= 0), label='Price increase')
ax.plot(dates, prices, 'r', where=(price_change < 0), label='Price decrease')

# 设置标题和标签
ax.set_title('How2matplotlib.com: Stock Price Changes')
ax.set_xlabel('Date')
ax.set_ylabel('Price')

# 添加图例
ax.legend()

# 旋转x轴标签
plt.xticks(rotation=45)

# 显示图形
plt.tight_layout()
plt.show()
在这个示例中,我们使用绿色表示股价上涨,红色表示股价下跌,从而直观地展示了股票价格的变化趋势。
12. 使用双色单线图展示温度变化
双色单线图也可以用来展示温度变化,例如区分高于和低于某个基准温度的情况。以下是一个示例:
import matplotlib.pyplot as plt
import numpy as np

# 生成模拟的温度数据
days = np.arange(1, 366)
temperatures = 20 + 10 * np.sin(2 * np.pi * days / 365) + np.random.randn(365) * 3

# 设置基准温度
baseline = 25

# 创建图形和坐标轴
fig, ax = plt.subplots(figsize=(12, 6))

# 绘制双色线
ax.plot(days, temperatures, 'r', where=(temperatures > baseline), label='Above baseline')
ax.plot(days, temperatures, 'b', where=(temperatures <= baseline), label='Below baseline')

# 添加基准线
ax.axhline(y=baseline, color='g', linestyle='--', label='Baseline')

# 设置标题和标签
ax.set_title('How2matplotlib.com: Temperature Changes Throughout the Year')
ax.set_xlabel('Day of Year')
ax.set_ylabel('Temperature (°C)')

# 添加图例
ax.legend()

# 显示图形
plt.tight_layout()
plt.show()
在这个示例中,我们使用红色表示高于基准温度的部分,蓝色表示低于基准温度的部分,绿色虚线表示基准温度。这种可视化方法可以清晰地展示全年温度变化情况。
13. 使用双色单线图展示数据分布
双色单线图还可以用来展示数据的分布情况,例如区分高于和低于平均值的数据点。以下是一个示例:
import matplotlib.pyplot as plt
import numpy as np

# 生成数据
x = np.linspace(0, 10, 100)
y = np.sin(x) + np.random.normal(0, 0.2, 100)

# 计算平均值
mean = np.mean(y)

# 创建图形和坐标轴
fig, ax = plt.subplots()

# 绘制双色线
ax.plot(x, y, 'r', where=(y > mean), label='Above mean')
ax.plot(x, y, 'b', where=(y <= mean), label='Below mean')

# 添加平均值线
ax.axhline(y=mean, color='g', linestyle='--', label='Mean')

# 设置标题和标签
ax.set_title('How2matplotlib.com: Data Distribution with Two Colors One Line')
ax.set_xlabel('X-axis')
ax.set_ylabel('Y-axis')

# 添加图例
ax.legend()

# 显示图形
plt.show()
在这个示例中,我们使用红色表示高于平均值的数据点,蓝色表示低于或等于平均值的数据点,绿色虚线表示平均值。这种可视化方法可以帮助我们快速识别数据的分布特征。
14. 使用双色单线图展示时间序列数据
双色单线图在展示时间序列数据时也非常有用,特别是当我们想要强调某些特定时间段时。以下是一个示例:
import matplotlib.pyplot as plt
import numpy as np
import pandas as pd

# 生成时间序列数据
dates = pd.date_range(start='2023-01-01', end='2023-12-31', freq='D')
values = np.cumsum(np.random.randn(len(dates)))

# 定义特殊时间段
special_period = (dates >= '2023-06-01') & (dates <= '2023-08-31')

# 创建图形和坐标轴
fig, ax = plt.subplots(figsize=(12, 6))

# 绘制双色线
ax.plot(dates[~special_period], values[~special_period], 'b', label='Normal period')
ax.plot(dates[special_period], values[special_period], 'r', label='Special period')

# 设置标题和标签
ax.set_title('How2matplotlib.com: Time Series Data with Two Colors One Line')
ax.set_xlabel('Date')
ax.set_ylabel('Value')

# 添加图例
ax.legend()

# 旋转x轴标签
plt.xticks(rotation=45)

# 显示图形
plt.tight_layout()
plt.show()
Output:
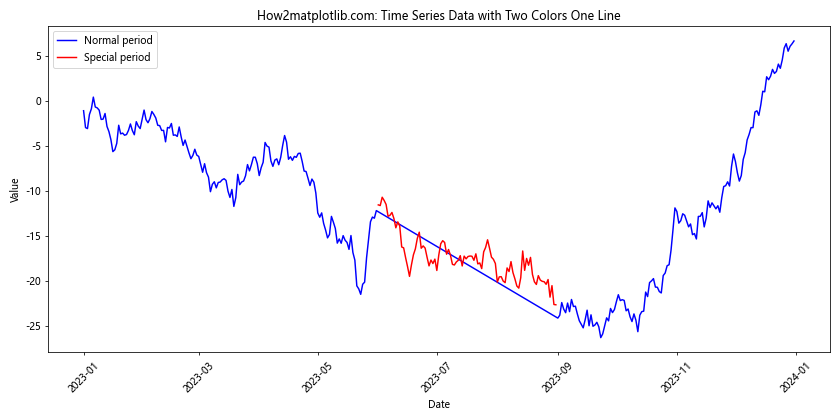
在这个示例中,我们使用蓝色表示正常时期的数据,红色表示特殊时期(这里定义为6月到8月)的数据。这种方法可以帮助我们快速识别特定时间段内的数据变化。
15. 使用双色单线图展示数据趋势变化
双色单线图还可以用来展示数据趋势的变化,例如区分上升趋势和下降趋势。以下是一个示例:
import matplotlib.pyplot as plt
import numpy as np

# 生成数据
x = np.linspace(0, 10, 100)
y = np.cumsum(np.random.randn(100))

# 计算趋势
trend = np.gradient(y)

# 创建图形和坐标轴
fig, ax = plt.subplots()

# 绘制双色线
ax.plot(x, y, 'g', where=(trend > 0), label='Upward trend')
ax.plot(x, y, 'r', where=(trend <= 0), label='Downward trend')

# 设置标题和标签
ax.set_title('How2matplotlib.com: Data Trend Changes with Two Colors One Line')
ax.set_xlabel('X-axis')
ax.set_ylabel('Y-axis')

# 添加图例
ax.legend()

# 显示图形
plt.show()
在这个示例中,我们使用绿色表示上升趋势,红色表示下降趋势。这种可视化方法可以帮助我们快速识别数据的趋势变化点。
结论
通过本文的详细介绍和多个示例,我们可以看到双色单线图是一种强大而灵活的数据可视化工具。它可以在不增加图表复杂度的情况下,提供更多的信息和视觉吸引力。无论是用于展示股票价格变化、温度波动、数据分布还是时间序列趋势,双色单线图都能够有效地传达数据的特征和变化。
在实际应用中,我们可以根据具体需求选择合适的方法来创建双色单线图。例如,使用 where 参数可以快速创建基于条件的双色线;使用 LineCollection 可以创建平滑的颜色渐变效果;使用自定义颜色映射可以实现更精细的颜色控制;而使用动画则可以展示数据随时间的变化。
最后,需要注意的是,虽然双色单线图可以提供丰富的信息,但在使用时也要注意不要过度复杂化图表。选择适当的颜色对比、清晰的图例说明以及恰当的标题和标签,都是创建有效双色单线图的关键因素。通过合理运用这些技巧,我们可以创建出既美观又信息丰富的数据可视化图表。
 极客笔记
极客笔记