Matplotlib 文本旋转:如何灵活调整图表中的文字方向
Matplotlib 是 Python 中最流行的数据可视化库之一,它提供了丰富的功能来创建各种类型的图表和绘图。在数据可视化中,文本标签的清晰度和可读性至关重要。有时,为了避免标签重叠或更好地利用空间,我们需要旋转文本。本文将深入探讨 Matplotlib 中的文本旋转技术,帮助你掌握如何灵活调整图表中的文字方向,从而创建更加清晰、美观的可视化效果。
1. 基本文本旋转
在 Matplotlib 中,我们可以使用 rotation 参数来旋转文本。这个参数可以应用于多种文本元素,如轴标签、刻度标签和普通文本。
1.1 旋转 x 轴标签
最常见的文本旋转应用是旋转 x 轴的刻度标签,特别是当标签较长或数量较多时。
import matplotlib.pyplot as plt
import numpy as np

# 准备数据
x = np.arange(5)
y = np.random.rand(5)

# 创建图表
plt.figure(figsize=(10, 6))
plt.bar(x, y)

# 设置 x 轴标签
plt.xticks(x, ['Category A', 'Category B', 'Category C', 'Category D', 'Category E'], rotation=45)

plt.title('Bar Chart with Rotated X-axis Labels - how2matplotlib.com')
plt.tight_layout()
plt.show()
Output:
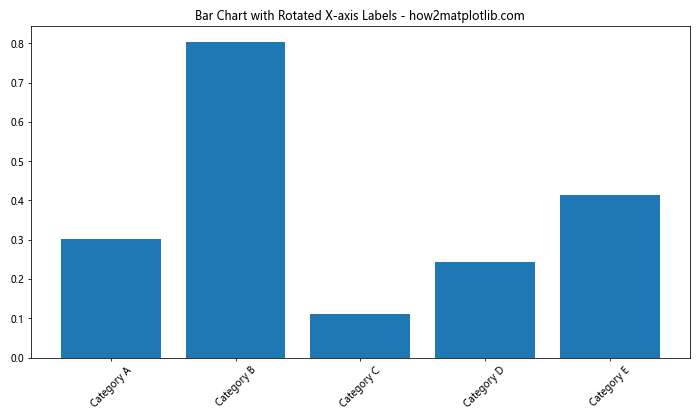
在这个例子中,我们使用 plt.xticks() 函数来设置 x 轴的刻度标签,并通过 rotation=45 参数将标签旋转 45 度。这样可以有效避免长标签之间的重叠。
1.2 旋转 y 轴标签
同样,我们也可以旋转 y 轴的标签:
import matplotlib.pyplot as plt
import numpy as np

# 准备数据
x = np.arange(5)
y = np.random.rand(5)

# 创建图表
plt.figure(figsize=(8, 6))
plt.bar(x, y)

# 设置 y 轴标签
plt.ylabel('Value (in millions) - how2matplotlib.com', rotation=0, labelpad=20)

plt.title('Bar Chart with Horizontal Y-axis Label')
plt.tight_layout()
plt.show()
Output:
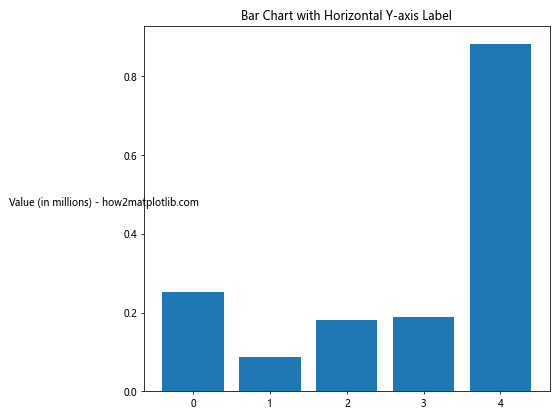
这里,我们使用 plt.ylabel() 函数来设置 y 轴的标签,并通过 rotation=0 将标签旋转为水平。labelpad 参数用于调整标签与轴的距离。
2. 高级文本旋转技巧
除了简单的角度旋转,Matplotlib 还提供了更多高级的文本旋转技巧,让你能够更精细地控制文本的方向和位置。
2.1 使用 ha 和 va 参数
ha(horizontal alignment)和 va(vertical alignment)参数可以帮助我们更好地控制旋转后文本的对齐方式。
import matplotlib.pyplot as plt

fig, ax = plt.subplots(figsize=(10, 6))

ax.text(0.5, 0.5, 'Rotated Text - how2matplotlib.com',
        rotation=45,
        ha='right', va='bottom',
        fontsize=20)

ax.set_xlim(0, 1)
ax.set_ylim(0, 1)
ax.set_title('Text Rotation with Alignment')
plt.show()
Output:
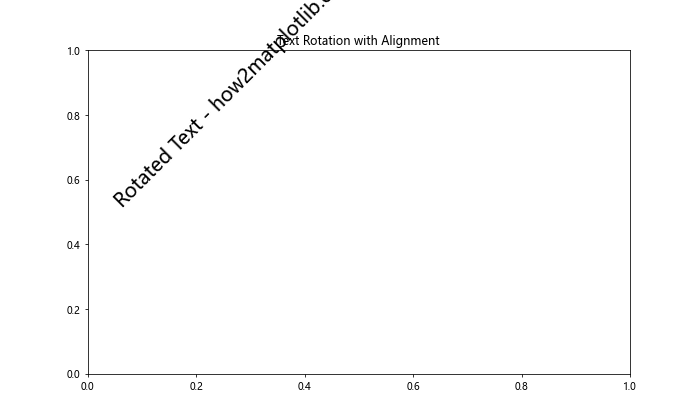
在这个例子中,我们使用 ax.text() 函数在图表中添加文本。rotation=45 将文本旋转 45 度,而 ha='right' 和 va='bottom' 分别设置文本的水平和垂直对齐方式。
2.2 使用弧度而非角度
Matplotlib 也支持使用弧度来指定旋转角度。这在某些情况下可能更为方便。
import matplotlib.pyplot as plt
import numpy as np

fig, ax = plt.subplots(figsize=(10, 6))

for i in range(8):
    angle_rad = i * np.pi / 4
    ax.text(0.5, 0.5, f'Rotated {i*45}° - how2matplotlib.com',
            rotation=angle_rad,
            rotation_mode='rad',
            ha='center', va='center')

ax.set_xlim(0, 1)
ax.set_ylim(0, 1)
ax.set_title('Text Rotation using Radians')
plt.show()
这个例子展示了如何使用弧度来旋转文本。我们使用 rotation_mode='rad' 来指定使用弧度模式,然后通过 rotation=angle_rad 来设置旋转角度。
3. 在不同类型的图表中应用文本旋转
文本旋转技术可以应用于各种类型的图表,让我们来看几个具体的例子。
3.1 在散点图中旋转标签
在散点图中,我们可能需要为每个数据点添加旋转的标签:
import matplotlib.pyplot as plt
import numpy as np

# 准备数据
np.random.seed(42)
x = np.random.rand(20)
y = np.random.rand(20)
labels = [f'Point {i+1}' for i in range(20)]

# 创建散点图
fig, ax = plt.subplots(figsize=(12, 8))
ax.scatter(x, y)

# 添加旋转的标签
for i, (xi, yi, label) in enumerate(zip(x, y, labels)):
    ax.annotate(f'{label} - how2matplotlib.com', (xi, yi),
                xytext=(5, 5), textcoords='offset points',
                rotation=45, ha='left', va='bottom')

ax.set_title('Scatter Plot with Rotated Labels')
plt.tight_layout()
plt.show()
Output:
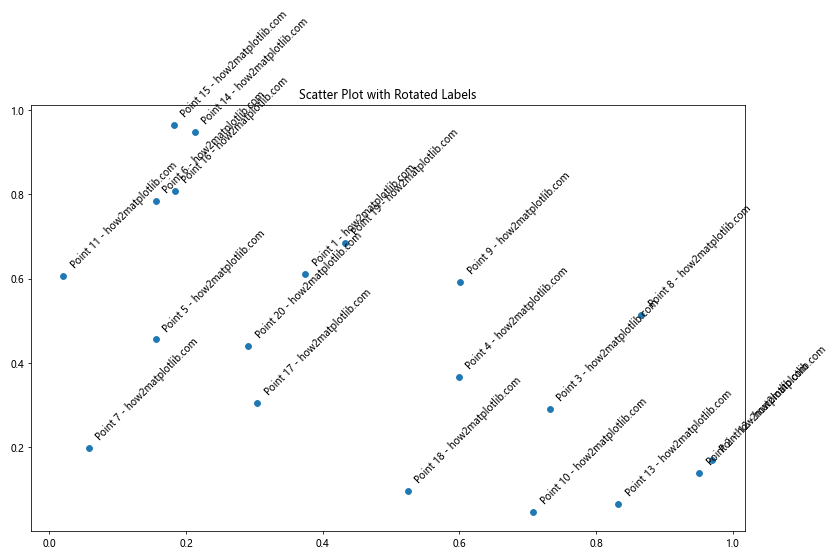
在这个例子中,我们使用 ax.annotate() 函数为每个散点添加旋转的标签。通过设置 rotation=45,我们将所有标签统一旋转 45 度。
3.2 在饼图中旋转标签
饼图中的文本旋转需要特别注意,因为每个扇形的角度都不同:
import matplotlib.pyplot as plt

# 准备数据
sizes = [15, 30, 45, 10]
labels = ['A', 'B', 'C', 'D']
colors = ['#ff9999', '#66b3ff', '#99ff99', '#ffcc99']

# 创建饼图
fig, ax = plt.subplots(figsize=(10, 8))
wedges, texts, autotexts = ax.pie(sizes, labels=labels, colors=colors, autopct='%1.1f%%', startangle=90)

# 旋转标签
for i, text in enumerate(texts):
    angle = (wedges[i].theta2 + wedges[i].theta1) / 2
    x = wedges[i].r * 0.8 * np.cos(np.radians(angle))
    y = wedges[i].r * 0.8 * np.sin(np.radians(angle))
    text.set_position((x, y))
    text.set_rotation(angle)
    text.set_ha('center')
    text.set_va('center')
    text.set_text(f'{labels[i]} - how2matplotlib.com')

ax.set_title('Pie Chart with Rotated Labels')
plt.tight_layout()
plt.show()
这个例子展示了如何在饼图中旋转标签。我们计算每个扇形的中心角度,然后根据这个角度来设置标签的位置和旋转角度。
4. 动态文本旋转
有时,我们可能需要根据数据或其他条件动态调整文本的旋转角度。
4.1 根据数值大小旋转标签
import matplotlib.pyplot as plt
import numpy as np

# 准备数据
categories = ['A', 'B', 'C', 'D', 'E']
values = np.random.randint(10, 100, 5)

# 创建条形图
fig, ax = plt.subplots(figsize=(10, 6))
bars = ax.bar(categories, values)

# 动态旋转标签
for i, (cat, val) in enumerate(zip(categories, values)):
    rotation = 0 if val > 50 else 90
    ax.text(i, val, f'{val} - how2matplotlib.com',
            ha='center', va='bottom', rotation=rotation)

ax.set_title('Bar Chart with Dynamically Rotated Labels')
plt.tight_layout()
plt.show()
Output:
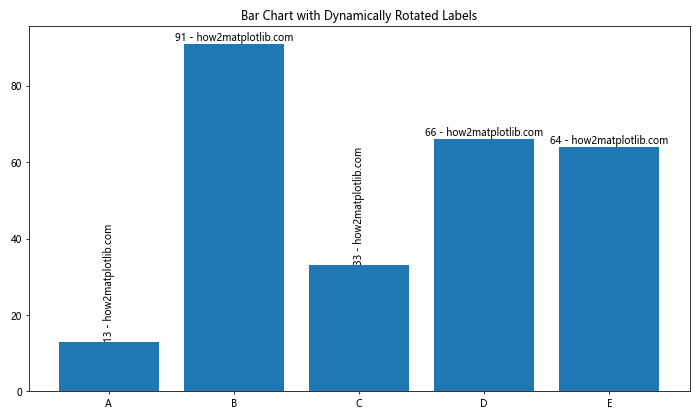
在这个例子中,我们根据条形的高度(即数值大小)来决定标签的旋转角度。如果值大于 50,标签保持水平;否则,标签垂直显示。
4.2 根据文本长度旋转标签
import matplotlib.pyplot as plt
import numpy as np

# 准备数据
categories = ['Short', 'Medium Length', 'Very Long Category Name', 'Normal', 'Extremely Long Category Name That Needs Rotation']
values = np.random.randint(10, 100, 5)

# 创建条形图
fig, ax = plt.subplots(figsize=(12, 6))
bars = ax.bar(range(len(categories)), values)

# 动态旋转标签
for i, (cat, val) in enumerate(zip(categories, values)):
    rotation = 45 if len(cat) > 10 else 0
    ax.text(i, -5, f'{cat} - how2matplotlib.com',
            ha='right' if rotation else 'center',
            va='top', rotation=rotation)

ax.set_xticks([])  # 移除 x 轴刻度
ax.set_ylim(bottom=-20)  # 调整 y 轴范围以容纳标签
ax.set_title('Bar Chart with Labels Rotated Based on Length')
plt.tight_layout()
plt.show()
Output:
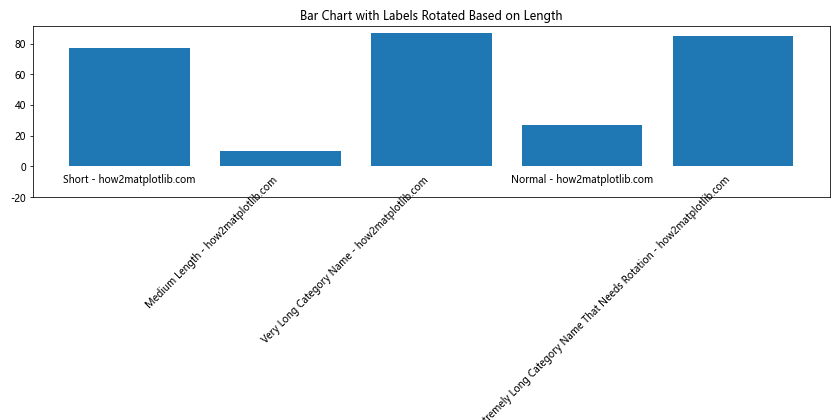
这个例子展示了如何根据类别名称的长度来决定是否旋转标签。如果类别名称长度超过 10 个字符,我们将其旋转 45 度。
5. 文本旋转的美化技巧
仅仅旋转文本可能还不够,我们还需要考虑如何使旋转后的文本更加美观和易读。
5.1 使用不同的字体样式
import matplotlib.pyplot as plt
from matplotlib import font_manager

# 准备数据
x = ['A', 'B', 'C', 'D', 'E']
y = [23, 45, 56, 78, 32]

# 创建图表
fig, ax = plt.subplots(figsize=(10, 6))
bars = ax.bar(x, y)

# 设置不同的字体样式
font_normal = font_manager.FontProperties(family='serif', style='normal', size=12)
font_italic = font_manager.FontProperties(family='serif', style='italic', size=12)
font_bold = font_manager.FontProperties(family='serif', weight='bold', size=12)

# 添加旋转的标签
for i, (xi, yi) in enumerate(zip(x, y)):
    if i % 3 == 0:
        font = font_normal
    elif i % 3 == 1:
        font = font_italic
    else:
        font = font_bold

    ax.text(xi, yi, f'{yi} - how2matplotlib.com', rotation=45,
            ha='left', va='bottom', fontproperties=font)

ax.set_title('Bar Chart with Rotated Labels in Different Font Styles')
plt.tight_layout()
plt.show()
Output:
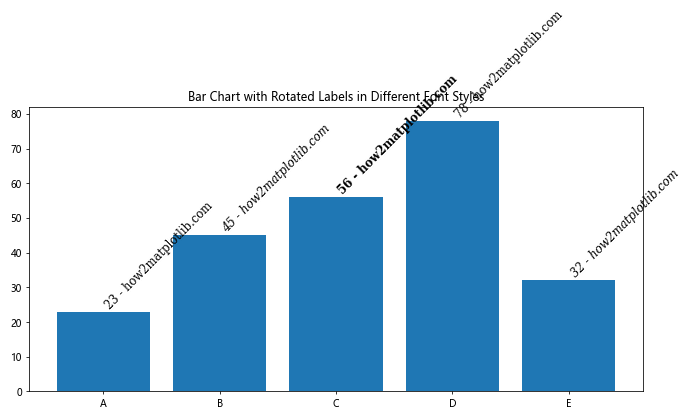
这个例子展示了如何为旋转的文本应用不同的字体样式,包括正常、斜体和粗体。这可以帮助强调某些特定的标签或创建视觉层次。
5.2 添加文本框和阴影
import matplotlib.pyplot as plt
import matplotlib.patches as patches

fig, ax = plt.subplots(figsize=(10, 6))

# 创建一个旋转的文本框
text = ax.text(0.5, 0.5, 'Rotated Text Box - how2matplotlib.com',
               rotation=30, ha='center', va='center', fontsize=16)

# 获取文本的边界框
bbox = text.get_window_extent(renderer=fig.canvas.get_renderer()).transformed(ax.transData.inverted())

# 创建一个稍大的矩形作为背景
rect = patches.Rectangle((bbox.x0, bbox.y0), bbox.width, bbox.height,
                         fill=True, facecolor='white', edgecolor='black',
                         transform=ax.transData, zorder=text.zorder-1)

# 添加阴影效果
shadow = patches.Shadow(rect, 0.05, -0.05)
ax.add_patch(shadow)
ax.add_patch(rect)

ax.set_xlim(0, 1)
ax.set_ylim(0, 1)
ax.set_title('Rotated Text with Background Box and Shadow')
plt.show()
Output:
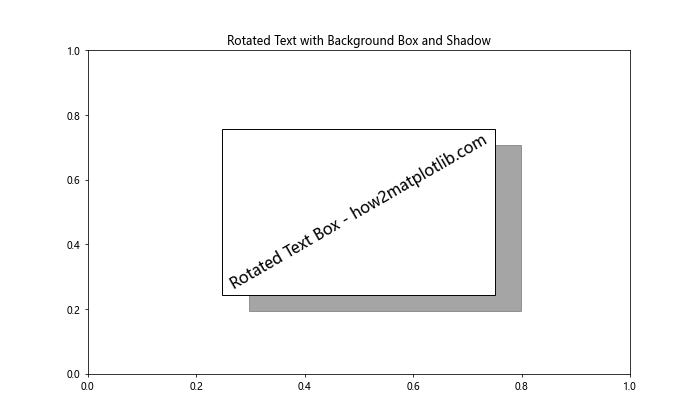
这个例子展示了如何为旋转的文本添加背景框和阴影效果,使其在复杂的图表中更加突出。
6. 处理文本旋转中的常见问题
在使用文本旋转时,我们可能会遇到一些常见问题。让我们来看看如何解决这些问题。
6.1 避免标签重叠
当有多个旋转的标签时,它们可能会相互重叠。我们可以通过调整标签的位置或选择性显示标签来解决这个问题。
import matplotlib.pyplot as plt
import numpy as np

# 准备数据
x = np.arange(20)
y = np.random.randint(10, 100, 20)

# 创建图表
fig, ax = plt.subplots(figsize=(12, 6))
ax.plot(x, y, marker='o')

# 添加旋转的标签,避免重叠
for i, (xi, yi) in enumerate(zip(x, y)):
    if i % 2 == 0:  # 只显示偶数索引的标签
        ax.annotate(f'{yi} - how2matplotlib.com', (xi, yi),
                    xytext=(0, 10), textcoords='offset points',
                    rotation=45, ha='right', va='bottom')

ax.set_title('Line Plot with Selectively Rotated Labels')
plt.tight_layout()
plt.show()
Output:
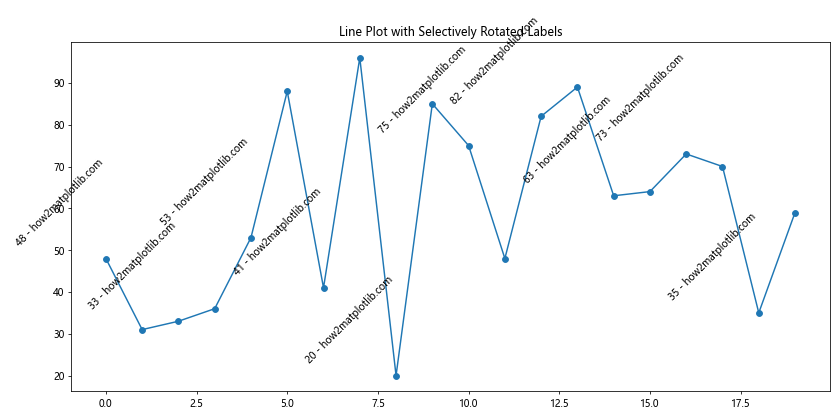
在这个例子中,我们只为偶数索引的数据点添加标签,并通过调整 xytext 参数来微调标签的位置,从而避免重叠。
6.2 处理长文本
当文本非常长时,即使旋转也可能超出图表边界。我们可以通过截断文本或调整图表大小来解决这个问题。
import matplotlib.pyplot as plt

def truncate_text(text, max_length=20):
    return text if len(text) <= max_length else text[:max_length-3] + '...'

# 准备数据
categories = ['Short', 'Medium Length Category', 'Very Long Category Name That Needs Truncation']
values = [30, 50, 70]

# 创建图表
fig, ax = plt.subplots(figsize=(12, 6))
bars = ax.bar(range(len(categories)), values)

# 添加旋转的标签,截断长文本
for i, (cat, val) in enumerate(zip(categories, values)):
    truncated_cat = truncate_text(cat)
    ax.text(i, val, f'{truncated_cat} - how2matplotlib.com',
            rotation=45, ha='right', va='bottom')

ax.set_xticks(range(len(categories)))
ax.set_xticklabels([])
ax.set_title('Bar Chart with Truncated Rotated Labels')
plt.tight_layout()
plt.show()
Output:
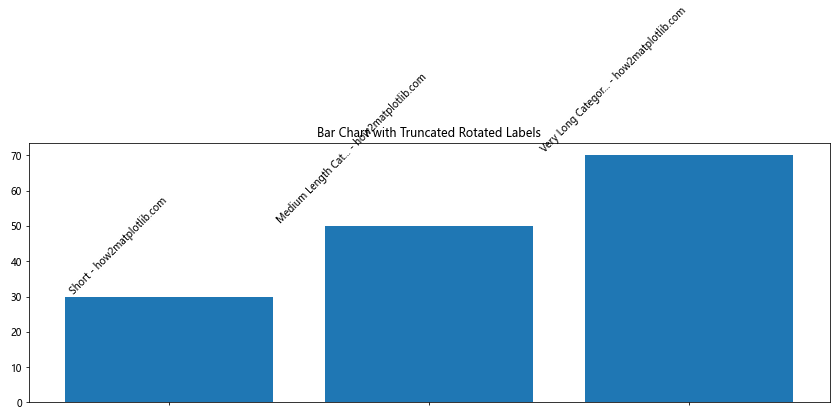
这个例子展示了如何使用自定义函数 truncate_text() 来截断过长的文本,确保旋转后的标签不会超出图表边界。
7. 在复杂图表中应用文本旋转
文本旋转技术在复杂的图表中尤其有用,比如多子图布局或组合图表。
7.1 在多子图布局中应用文本旋转
import matplotlib.pyplot as plt
import numpy as np

# 准备数据
categories = ['A', 'B', 'C', 'D', 'E']
values1 = np.random.randint(10, 100, 5)
values2 = np.random.randint(10, 100, 5)

# 创建多子图布局
fig, (ax1, ax2) = plt.subplots(1, 2, figsize=(15, 6))

# 第一个子图:条形图
bars1 = ax1.bar(categories, values1)
ax1.set_title('Bar Chart')
for i, v in enumerate(values1):
    ax1.text(i, v, f'{v} - how2matplotlib.com', ha='center', va='bottom', rotation=45)

# 第二个子图:折线图
ax2.plot(categories, values2, marker='o')
ax2.set_title('Line Chart')
for i, v in enumerate(values2):
    ax2.annotate(f'{v} - how2matplotlib.com', (categories[i], v),
                 xytext=(5, 5), textcoords='offset points',
                 rotation=45, ha='left', va='bottom')

plt.tight_layout()
plt.show()
Output:
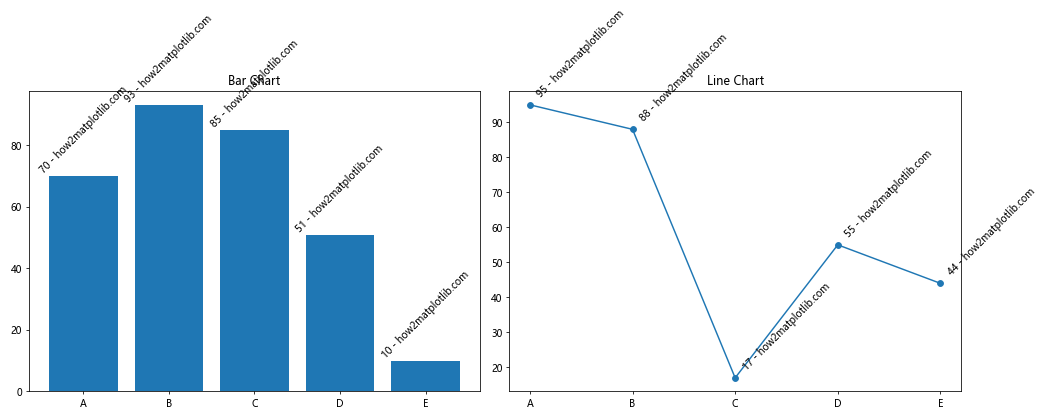
这个例子展示了如何在包含条形图和折线图的多子图布局中应用文本旋转技术。
7.2 在组合图表中应用文本旋转
import matplotlib.pyplot as plt
import numpy as np

# 准备数据
categories = ['A', 'B', 'C', 'D', 'E']
values1 = np.random.randint(10, 100, 5)
values2 = np.random.randint(10, 100, 5)

# 创建组合图表
fig, ax1 = plt.subplots(figsize=(12, 6))

# 条形图
bars = ax1.bar(categories, values1, alpha=0.7)
ax1.set_ylabel('Value 1')
for i, v in enumerate(values1):
    ax1.text(i, v, f'{v} - how2matplotlib.com', ha='center', va='bottom', rotation=45)

# 折线图
ax2 = ax1.twinx()
line = ax2.plot(categories, values2, color='red', marker='o')
ax2.set_ylabel('Value 2')
for i, v in enumerate(values2):
    ax2.annotate(f'{v} - how2matplotlib.com', (categories[i], v),
                 xytext=(5, 5), textcoords='offset points',
                 rotation=45, ha='left', va='bottom', color='red')

plt.title('Combined Bar and Line Chart with Rotated Labels')
plt.tight_layout()
plt.show()
Output:
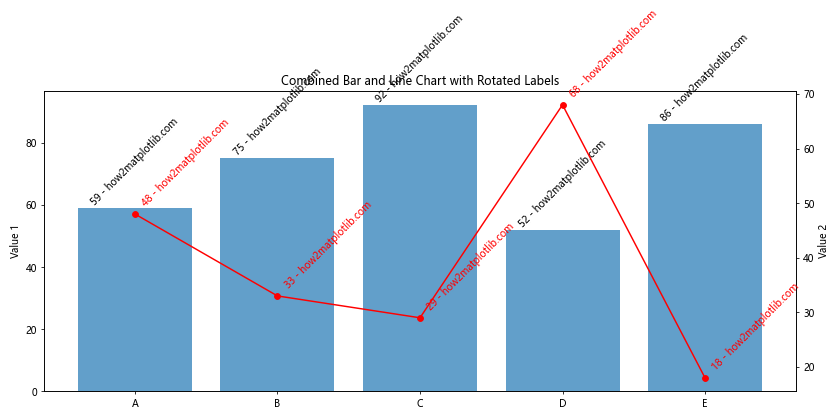
这个例子展示了如何在组合了条形图和折线图的复杂图表中应用文本旋转技术。
8. 文本旋转的最佳实践
在使用文本旋转时,有一些最佳实践可以帮助我们创建更加清晰、专业的图表。
8.1 保持一致性
在同一图表中,尽量保持文本旋转角度的一致性,除非有特殊需求。
import matplotlib.pyplot as plt
import numpy as np

# 准备数据
categories = ['Category A', 'Category B', 'Category C', 'Category D', 'Category E']
values = np.random.randint(10, 100, 5)

# 创建图表
fig, ax = plt.subplots(figsize=(10, 6))
bars = ax.bar(categories, values)

# 添加一致的旋转标签
for i, v in enumerate(values):
    ax.text(i, v, f'{v} - how2matplotlib.com', ha='center', va='bottom', rotation=45)

ax.set_xticklabels(categories, rotation=45, ha='right')
ax.set_title('Bar Chart with Consistent Label Rotation')
plt.tight_layout()
plt.show()
Output:
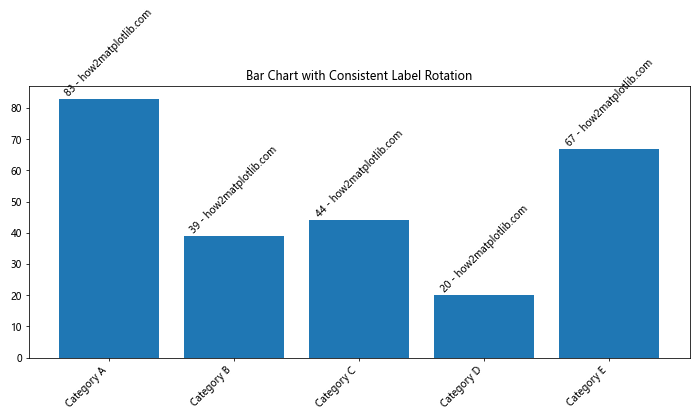
这个例子展示了如何在条形图中保持标签和刻度文本旋转角度的一致性。
8.2 考虑可读性
旋转文本时,始终要考虑可读性。避免使用过大的旋转角度,通常 45 度是一个很好的选择。
import matplotlib.pyplot as plt
import numpy as np

# 准备数据
x = np.linspace(0, 10, 100)
y1 = np.sin(x)
y2 = np.cos(x)

# 创建图表
fig, ax = plt.subplots(figsize=(12, 6))
ax.plot(x, y1, label='sin(x)')
ax.plot(x, y2, label='cos(x)')

# 添加可读性好的旋转标签
ax.text(5, 0.5, 'Peak - how2matplotlib.com', rotation=45, ha='left', va='bottom')
ax.text(5, -0.5, 'Trough - how2matplotlib.com', rotation=45, ha='left', va='top')

ax.set_xlabel('X-axis')
ax.set_ylabel('Y-axis')
ax.set_title('Sine and Cosine Curves with Rotated Labels')
ax.legend()
plt.tight_layout()
plt.show()
Output:
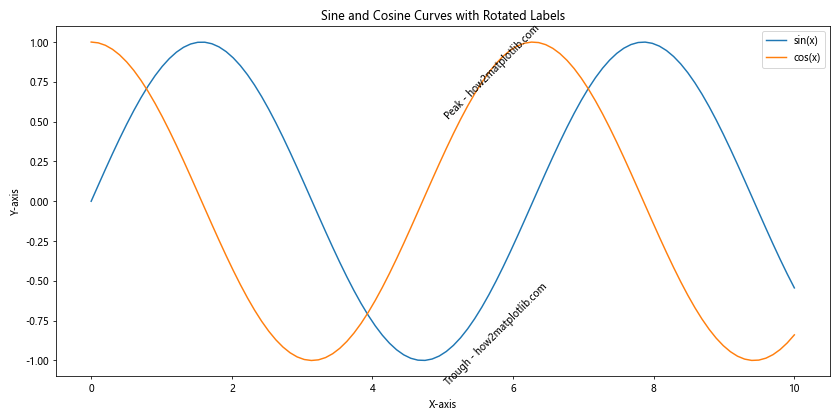
这个例子展示了如何在复杂的曲线图中添加旋转标签,同时保持良好的可读性。
9. 高级文本旋转技巧
对于更复杂的场景,我们可能需要一些高级技巧来实现特殊的文本旋转效果。
9.1 沿曲线旋转文本
有时,我们可能需要让文本沿着某个曲线或路径旋转。这可以通过使用 matplotlib.patheffects 模块来实现。
import matplotlib.pyplot as plt
import numpy as np
from matplotlib.patheffects import withStroke

# 准备数据
theta = np.linspace(0, 2*np.pi, 100)
r = 1 + 0.3 * np.sin(5*theta)
x = r * np.cos(theta)
y = r * np.sin(theta)

# 创建图表
fig, ax = plt.subplots(figsize=(10, 10))
ax.plot(x, y)

# 沿曲线添加旋转文本
for i, (xi, yi, ti) in enumerate(zip(x[::10], y[::10], theta[::10])):
    angle = np.degrees(ti) - 90
    text = ax.text(xi, yi, f'Point {i} - how2matplotlib.com',
                   rotation=angle, ha='center', va='center', fontsize=8)
    text.set_path_effects([withStroke(foreground='white', linewidth=3)])

ax.set_xlim(-1.5, 1.5)
ax.set_ylim(-1.5, 1.5)
ax.set_title('Text Rotated Along a Curve')
ax.set_aspect('equal')
plt.tight_layout()
plt.show()
Output:
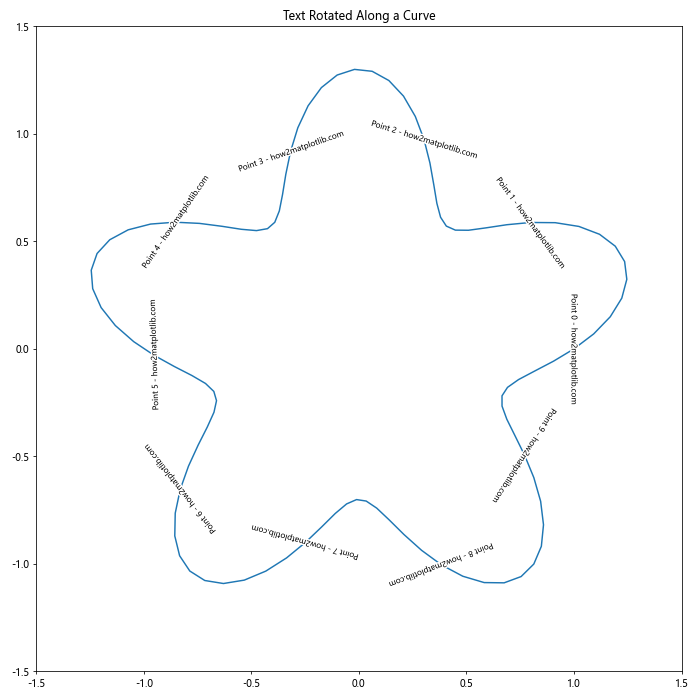
这个例子展示了如何让文本沿着一个复杂的曲线旋转。我们使用 withStroke 效果来为文本添加白色轮廓,提高可读性。
9.2 3D 图表中的文本旋转
在 3D 图表中,文本旋转变得更加复杂,因为我们需要考虑三个维度。
import matplotlib.pyplot as plt
import numpy as np

# 准备数据
x = np.linspace(-5, 5, 100)
y = np.linspace(-5, 5, 100)
X, Y = np.meshgrid(x, y)
Z = np.sin(np.sqrt(X**2 + Y**2))

# 创建 3D 图表
fig = plt.figure(figsize=(12, 8))
ax = fig.add_subplot(111, projection='3d')
surf = ax.plot_surface(X, Y, Z, cmap='viridis')

# 添加旋转的 3D 文本
ax.text(0, 0, 1, 'Peak - how2matplotlib.com', 'x', fontsize=12, rotation=45)
ax.text(5, 5, 0, 'Corner - how2matplotlib.com', 'y', fontsize=12, rotation=45)
ax.text(-5, -5, -1, 'Trough - how2matplotlib.com', 'z', fontsize=12, rotation=45)

ax.set_xlabel('X-axis')
ax.set_ylabel('Y-axis')
ax.set_zlabel('Z-axis')
ax.set_title('3D Surface Plot with Rotated Labels')
plt.tight_layout()
plt.show()
Output:
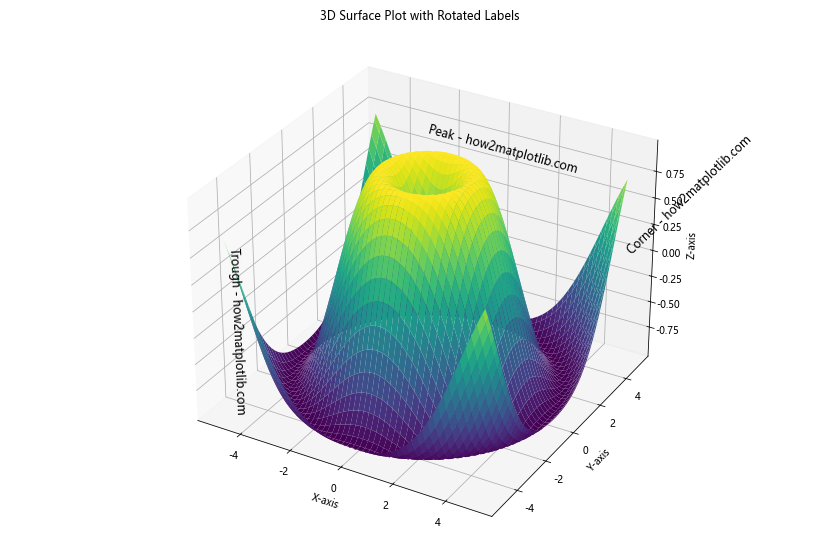
这个例子展示了如何在 3D 表面图中添加旋转的文本标签。注意,在 3D 空间中,我们需要指定文本的对齐轴(’x’、’y’ 或 ‘z’)。
10. 结论
文本旋转是 Matplotlib 中一个强大而灵活的功能,它可以帮助我们创建更加清晰、美观和信息丰富的数据可视化。通过本文介绍的各种技巧和示例,你应该能够熟练地在各种类型的图表中应用文本旋转,解决常见问题,并创建出专业水准的可视化效果。
记住,文本旋转不仅仅是一个技术问题,更是一个设计问题。在使用这个功能时,始终要考虑可读性、一致性和整体美观。通过不断实践和尝试,你将能够找到最适合你的数据和受众的文本旋转方式。
最后,Matplotlib 的文本旋转功能还有很多高级应用,比如动画中的文本旋转、交互式文本旋转等。随着你对这个功能的深入了解和使用,你会发现更多创新的方式来展示你的数据和想法。继续探索,不断尝试新的技巧,你一定能创造出令人印象深刻的数据可视化作品。
 极客笔记
极客笔记