Matplotlib Tab Colors:轻松掌握预定义颜色方案
Matplotlib是Python中最流行的数据可视化库之一,它提供了丰富的绘图功能和自定义选项。在进行数据可视化时,选择合适的颜色方案对于创建美观且易于理解的图表至关重要。Matplotlib提供了一系列预定义的颜色方案,其中”Tab Colors”是一组特别设计的颜色,旨在提供清晰、易区分且视觉上令人愉悦的配色方案。本文将深入探讨Matplotlib的Tab Colors,介绍它们的特点、使用方法以及在不同类型图表中的应用。
什么是Tab Colors?
Tab Colors是Matplotlib中的一组预定义颜色,专门设计用于数据可视化。这组颜色包含了10种不同的颜色,每种颜色都有其独特的名称和RGB值。Tab Colors的设计理念是提供一组互相协调、易于区分且视觉上令人愉悦的颜色,适用于各种类型的图表和数据可视化场景。
Tab Colors包含以下10种颜色:
- tab:blue
- tab:orange
- tab:green
- tab:red
- tab:purple
- tab:brown
- tab:pink
- tab:gray
- tab:olive
- tab:cyan
这些颜色经过精心选择和调整,以确保它们在各种背景下都能保持良好的可读性和区分度。
如何使用Tab Colors
在Matplotlib中使用Tab Colors非常简单。你可以通过颜色名称直接引用这些颜色,也可以使用plt.cm.tab10颜色映射来访问它们。以下是一些基本的使用方法:
1. 直接使用颜色名称
你可以在绘图函数中直接使用Tab Colors的名称:
import matplotlib.pyplot as plt

plt.figure(figsize=(8, 6))
plt.plot([1, 2, 3, 4], [1, 4, 2, 3], color='tab:blue', label='Line 1')
plt.plot([1, 2, 3, 4], [2, 3, 4, 1], color='tab:orange', label='Line 2')
plt.title('How to use Tab Colors in Matplotlib - how2matplotlib.com')
plt.xlabel('X-axis')
plt.ylabel('Y-axis')
plt.legend()
plt.show()
Output:
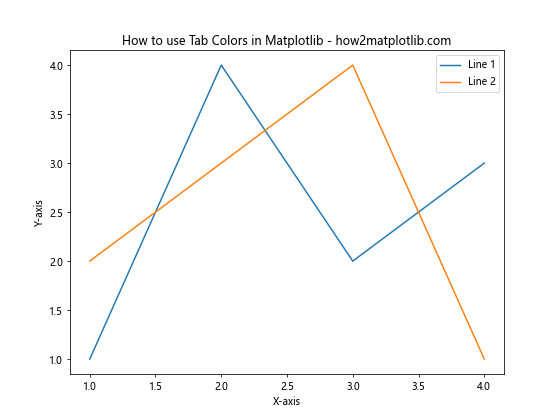
在这个例子中,我们使用tab:blue和tab:orange来设置两条线的颜色。这种方法简单直接,适用于需要明确指定颜色的场景。
2. 使用plt.cm.tab10颜色映射
对于需要使用多种颜色的场景,可以使用plt.cm.tab10颜色映射:
import matplotlib.pyplot as plt
import numpy as np

plt.figure(figsize=(10, 6))
for i in range(10):
    plt.plot(np.arange(10), np.random.rand(10), color=plt.cm.tab10(i), label=f'Line {i+1}')

plt.title('Using plt.cm.tab10 Color Map - how2matplotlib.com')
plt.xlabel('X-axis')
plt.ylabel('Y-axis')
plt.legend(bbox_to_anchor=(1.05, 1), loc='upper left')
plt.tight_layout()
plt.show()
Output:
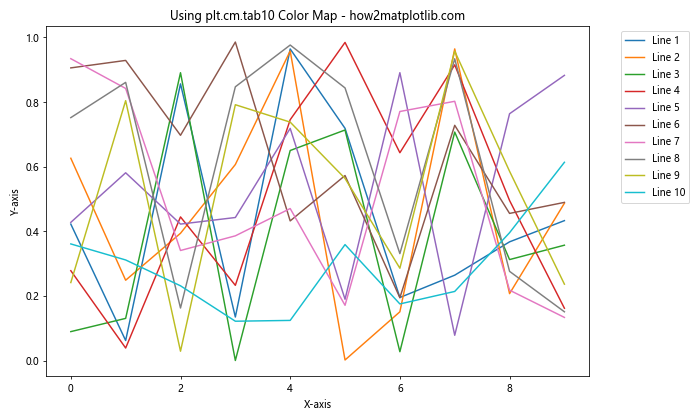
这个例子展示了如何使用plt.cm.tab10颜色映射来为10条线分配不同的颜色。这种方法特别适合需要自动为多个数据系列分配颜色的情况。
Tab Colors在不同类型图表中的应用
Tab Colors可以应用于Matplotlib支持的各种类型的图表。以下是一些常见图表类型的示例:
1. 柱状图
柱状图是展示分类数据的理想选择,Tab Colors可以帮助区分不同的类别:
import matplotlib.pyplot as plt
import numpy as np

categories = ['A', 'B', 'C', 'D', 'E']
values = np.random.rand(5)

plt.figure(figsize=(8, 6))
bars = plt.bar(categories, values, color=plt.cm.tab10(range(5)))

plt.title('Bar Chart with Tab Colors - how2matplotlib.com')
plt.xlabel('Categories')
plt.ylabel('Values')

for bar in bars:
    height = bar.get_height()
    plt.text(bar.get_x() + bar.get_width()/2., height,
             f'{height:.2f}', ha='center', va='bottom')

plt.show()
Output:
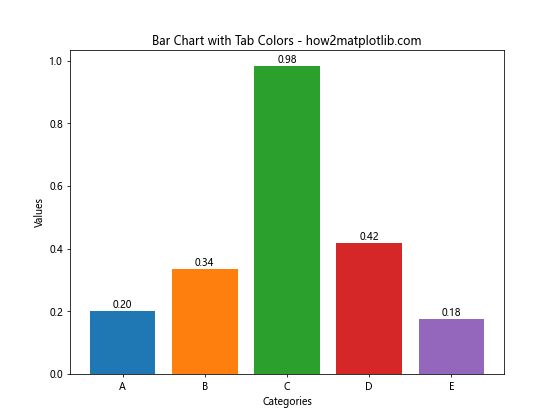
这个例子展示了如何在柱状图中使用Tab Colors。每个柱子都使用了不同的Tab Color,使得各个类别更容易区分。
2. 饼图
饼图是展示部分与整体关系的有效方式,Tab Colors可以帮助清晰地区分不同的扇区:
import matplotlib.pyplot as plt

sizes = [30, 25, 20, 15, 10]
labels = ['A', 'B', 'C', 'D', 'E']
colors = plt.cm.tab10(range(5))

plt.figure(figsize=(8, 8))
plt.pie(sizes, labels=labels, colors=colors, autopct='%1.1f%%', startangle=90)
plt.title('Pie Chart with Tab Colors - how2matplotlib.com')
plt.axis('equal')
plt.show()
Output:
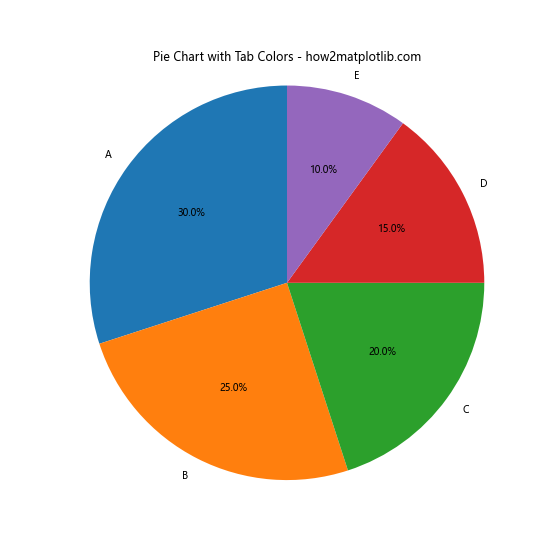
在这个饼图示例中,我们使用Tab Colors为不同的扇区着色,使得各个部分更加醒目和易于识别。
3. 散点图
散点图用于展示两个变量之间的关系,Tab Colors可以用来区分不同的数据组:
import matplotlib.pyplot as plt
import numpy as np

np.random.seed(42)
group1_x = np.random.rand(20)
group1_y = np.random.rand(20)
group2_x = np.random.rand(20) + 0.5
group2_y = np.random.rand(20) + 0.5

plt.figure(figsize=(8, 6))
plt.scatter(group1_x, group1_y, color='tab:blue', label='Group 1')
plt.scatter(group2_x, group2_y, color='tab:orange', label='Group 2')

plt.title('Scatter Plot with Tab Colors - how2matplotlib.com')
plt.xlabel('X-axis')
plt.ylabel('Y-axis')
plt.legend()
plt.show()
Output:
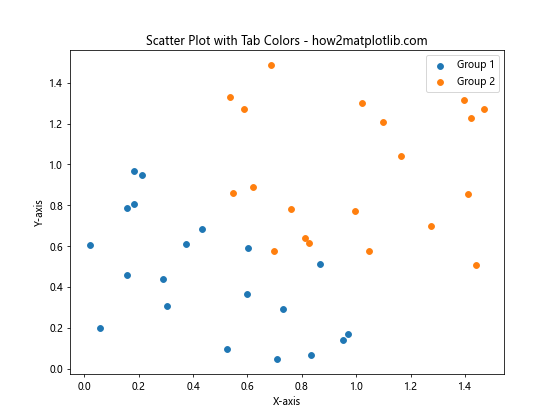
这个散点图示例展示了如何使用Tab Colors来区分两个不同的数据组,使得数据点的分布更加清晰可见。
4. 箱线图
箱线图用于展示数据的分布情况,Tab Colors可以帮助区分不同的数据集:
import matplotlib.pyplot as plt
import numpy as np

np.random.seed(42)
data1 = np.random.normal(100, 10, 200)
data2 = np.random.normal(90, 20, 200)
data3 = np.random.normal(110, 15, 200)

plt.figure(figsize=(8, 6))
box_plot = plt.boxplot([data1, data2, data3], patch_artist=True)

colors = ['tab:blue', 'tab:orange', 'tab:green']
for patch, color in zip(box_plot['boxes'], colors):
    patch.set_facecolor(color)

plt.title('Box Plot with Tab Colors - how2matplotlib.com')
plt.xlabel('Groups')
plt.ylabel('Values')
plt.xticks([1, 2, 3], ['Data 1', 'Data 2', 'Data 3'])
plt.show()
Output:
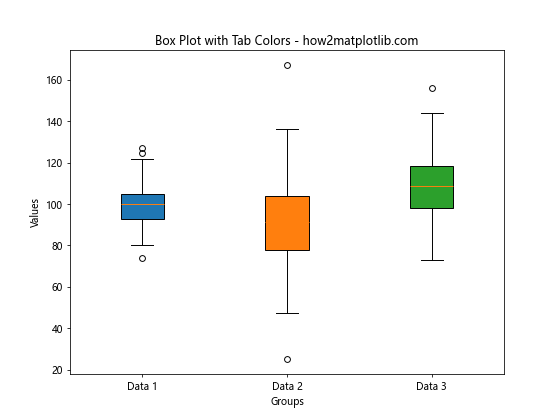
在这个箱线图示例中,我们使用Tab Colors为不同的数据集着色,使得各个箱体更加醒目和易于比较。
自定义Tab Colors
虽然Tab Colors提供了一组预定义的颜色,但有时你可能需要对这些颜色进行微调或创建自己的颜色方案。以下是一些自定义Tab Colors的方法:
1. 调整颜色透明度
你可以通过调整颜色的透明度来创建新的视觉效果:
import matplotlib.pyplot as plt
import numpy as np

x = np.linspace(0, 10, 100)
y1 = np.sin(x)
y2 = np.cos(x)

plt.figure(figsize=(8, 6))
plt.plot(x, y1, color='tab:blue', label='Sin')
plt.plot(x, y2, color='tab:orange', label='Cos')
plt.fill_between(x, y1, color='tab:blue', alpha=0.3)
plt.fill_between(x, y2, color='tab:orange', alpha=0.3)

plt.title('Customizing Tab Colors with Transparency - how2matplotlib.com')
plt.xlabel('X-axis')
plt.ylabel('Y-axis')
plt.legend()
plt.show()
Output:
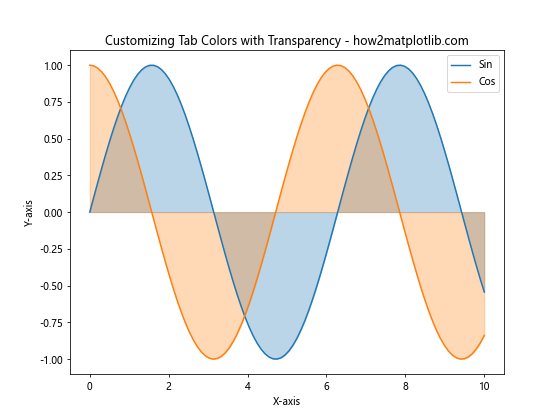
在这个例子中,我们使用alpha参数来调整填充区域的透明度,创造出半透明的效果。
2. 创建自定义颜色映射
你可以基于Tab Colors创建自己的颜色映射:
import matplotlib.pyplot as plt
import matplotlib.colors as mcolors
import numpy as np

custom_colors = [plt.cm.tab10(i) for i in range(5)]
custom_cmap = mcolors.ListedColormap(custom_colors)

data = np.random.rand(10, 10)

plt.figure(figsize=(8, 6))
plt.imshow(data, cmap=custom_cmap)
plt.colorbar()
plt.title('Custom Color Map Based on Tab Colors - how2matplotlib.com')
plt.show()
Output:
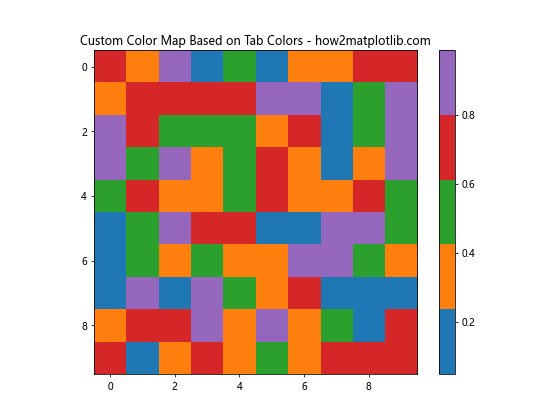
这个例子展示了如何使用Tab Colors的前五种颜色创建一个自定义的颜色映射,并将其应用到热图中。
3. 混合Tab Colors
你可以混合不同的Tab Colors来创建新的颜色:
import matplotlib.pyplot as plt
import numpy as np

blue = plt.cm.tab10(0)
orange = plt.cm.tab10(1)
mixed_color = tuple((np.array(blue) + np.array(orange)) / 2)

x = np.linspace(0, 10, 100)
y = np.sin(x)

plt.figure(figsize=(8, 6))
plt.plot(x, y, color=mixed_color, linewidth=2)
plt.title('Using Mixed Tab Colors - how2matplotlib.com')
plt.xlabel('X-axis')
plt.ylabel('Y-axis')
plt.show()
Output:
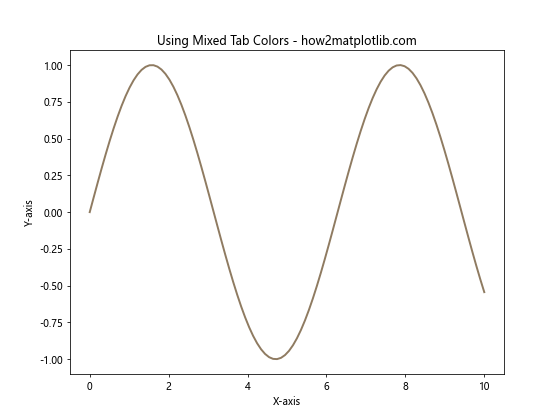
这个例子展示了如何将Tab Colors中的蓝色和橙色混合,创造出一种新的颜色。
Tab Colors在复杂图表中的应用
Tab Colors不仅适用于简单的图表,还可以在更复杂的可视化中发挥作用。以下是一些高级应用示例:
1. 多子图布局
在多子图布局中,Tab Colors可以帮助保持整体视觉一致性:
import matplotlib.pyplot as plt
import numpy as np

fig, axs = plt.subplots(2, 2, figsize=(12, 10))
fig.suptitle('Multiple Subplots with Tab Colors - how2matplotlib.com', fontsize=16)

# Subplot 1: Line plot
x = np.linspace(0, 10, 100)
axs[0, 0].plot(x, np.sin(x), color='tab:blue')
axs[0, 0].plot(x, np.cos(x), color='tab:orange')
axs[0, 0].set_title('Line Plot')

# Subplot 2: Scatter plot
axs[0, 1].scatter(np.random.rand(50), np.random.rand(50), color='tab:green')
axs[0, 1].set_title('Scatter Plot')

# Subplot 3: Bar plot
categories = ['A', 'B', 'C', 'D']
values = np.random.rand(4)
axs[1, 0].bar(categories, values, color=plt.cm.tab10(range(4)))
axs[1, 0].set_title('Bar Plot')

# Subplot 4: Pie chart
sizes = [30, 25, 20, 15, 10]
axs[1, 1].pie(sizes, colors=plt.cm.tab10(range(5)), autopct='%1.1f%%')
axs[1, 1].set_title('Pie Chart')

plt.tight_layout()
plt.show()
Output:
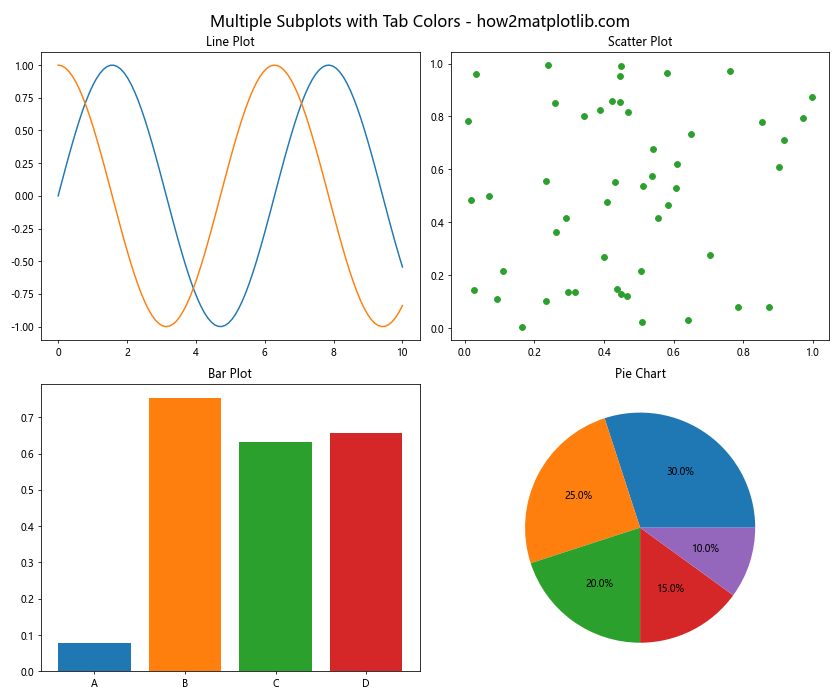
这个例子展示了如何在一个包含多个子图的布局中使用Tab Colors,每个子图使用不同的Tab Color,但整体保持视觉一致性。
2. 堆叠面积图
堆叠面积图是展示多个数据系列随时间变化的有效方式,Tab Colors可以帮助区分不同的数据系列:
import matplotlib.pyplot as plt
import numpy as np

x = np.arange(10)
y1 = np.random.rand(10)
y2 = np.random.rand(10)
y3 = np.random.rand(10)

plt.figure(figsize=(10, 6))
plt.stackplot(x, y1, y2, y3, labels=['Series 1', 'Series 2', 'Series 3'],
              colors=['tab:blue', 'tab:orange', 'tab:green'])

plt.title('Stacked Area Chart with Tab Colors - how2matplotlib.com')
plt.xlabel('X-axis')
plt.ylabel('Y-axis')
plt.legend(loc='upper left')
plt.show()
Output:
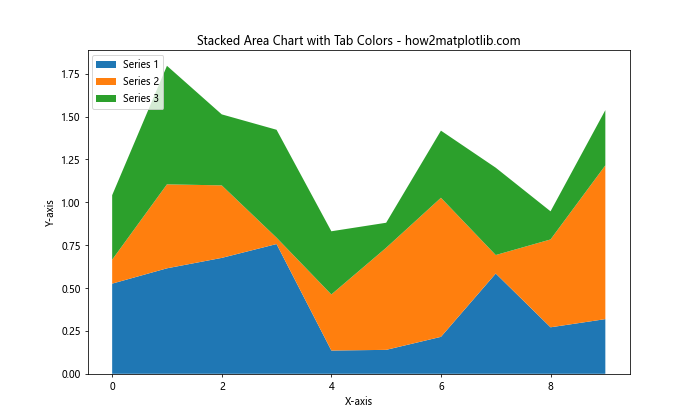
这个堆叠面积图示例展示了如何使用Tab Colors来区分不同的数据系列,使得各个系列的贡献更加清晰可见。
3. 3D图表
Tab Colors也可以应用于3D图表,帮助增强空间感和数据区分:
import matplotlib.pyplot as plt
import numpy as np

fig = plt.figure(figsize=(10, 8))
ax = fig.add_subplot(111, projection='3d')

x = np.random.rand(100)
y = np.random.rand(100)
z = np.random.rand(100)
colors = plt.cm.tab10(np.random.rand(100))

ax.scatter(x, y, z, c=colors, s=50)

ax.set_xlabel('X Label')
ax.set_ylabel('Y Label')
ax.set_zlabel('Z Label')
ax.set_title('3D Scatter Plot with Tab Colors - how2matplotlib.com')

plt.show()
Output:
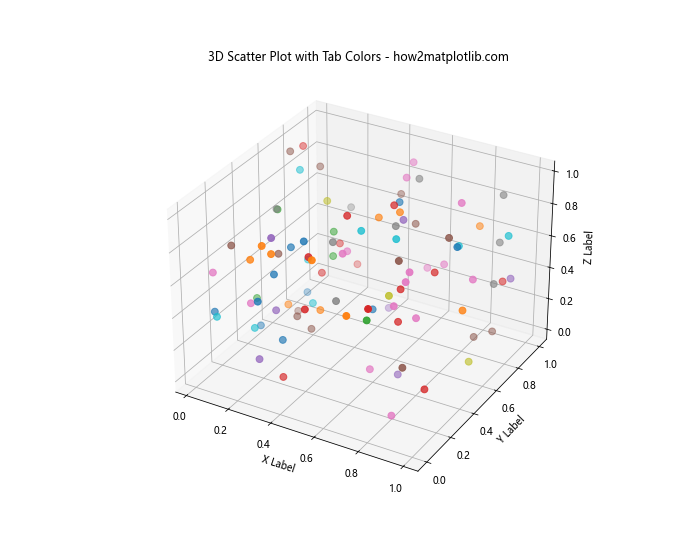
这个3D散点图示例展示了如何使用Tab Colors来为散点着色,增强了数据点在三维空间中的视觉效果。
Tab Colors的颜色理论
了解Tab Colors背后的颜色理论可以帮助我们更好地利用这些颜色。Tab Colors的设计考虑了以下几个方面:
- 色相对比:Tab Colors中的颜色在色轮上分布均匀,确保了良好的色相对比。
- 亮度对比:不同的Tab Colors具有不同的亮度值,使得它们在各种背景下都能保持良好的可读性。
- 饱和度平衡:Tab Colors的饱和度经过精心调整,既不会过于鲜艳刺眼,也不会显得过于暗淡。
以下是一个展示Tab Colors色相、亮度和饱和度的示例:
import matplotlib.pyplot as plt
import matplotlib.colors as mcolors

def plot_color_properties(ax, color, title):
    rgb = mcolors.to_rgb(color)
    hsv = mcolors.rgb_to_hsv(rgb)

    ax.bar(['Hue', 'Saturation', 'Value'], hsv, color=color)
    ax.set_ylim(0, 1)
    ax.set_title(title)

fig, axs = plt.subplots(2, 5, figsize=(15, 6))
fig.suptitle('Color Properties of Tab Colors - how2matplotlib.com', fontsize=16)

for i, color in enumerate(plt.cm.tab10.colors):
    row = i // 5
    col = i % 5
    plot_color_properties(axs[row, col], color, f'tab:{plt.cm.tab10.colors[i]}')

plt.tight_layout()
plt.show()
Output:
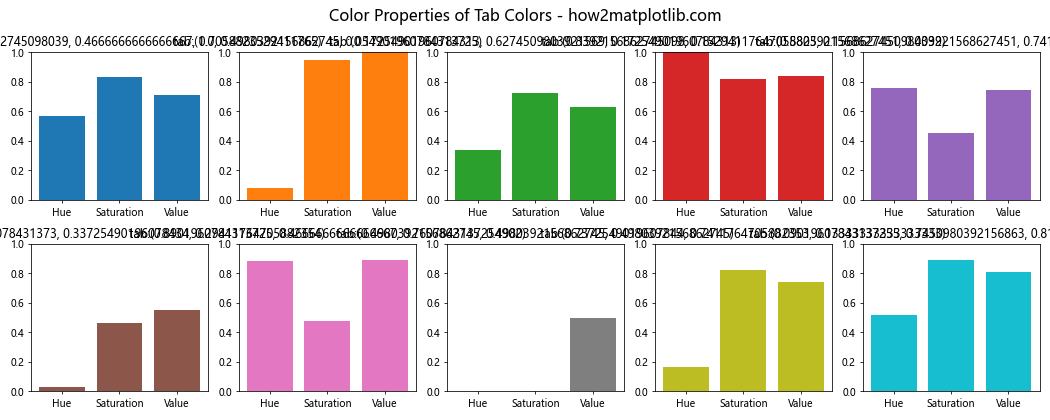
这个示例展示了Tab Colors中每种颜色的色相、饱和度和亮度值,帮助我们理解这些颜色的特性。
Tab Colors的可访问性考虑
在使用Tab Colors时,考虑可访问性是非常重要的。不同的人可能对颜色有不同的感知能力,因此我们需要确保我们的可视化对所有人都是友好的。以下是一些提高可访问性的建议:
- 不要仅依赖颜色来传递信息,可以结合使用形状、纹理或标签。
- 考虑使用高对比度的颜色组合。
- 提供替代文本或描述,以便那些无法区分颜色的人也能理解图表。
以下是一个考虑可访问性的示例:
import matplotlib.pyplot as plt
import numpy as np

x = np.linspace(0, 10, 100)
y1 = np.sin(x)
y2 = np.cos(x)

plt.figure(figsize=(10, 6))
plt.plot(x, y1, color='tab:blue', linestyle='-', marker='o', markevery=10, label='Sin')
plt.plot(x, y2, color='tab:orange', linestyle='--', marker='s', markevery=10, label='Cos')

plt.title('Accessible Plot with Tab Colors - how2matplotlib.com')
plt.xlabel('X-axis')
plt.ylabel('Y-axis')
plt.legend()

# 添加文本描述
plt.text(5, 0.5, 'Sin curve peaks at π/2', color='tab:blue', ha='center')
plt.text(5, -0.5, 'Cos curve starts at 1', color='tab:orange', ha='center')

plt.show()
Output:
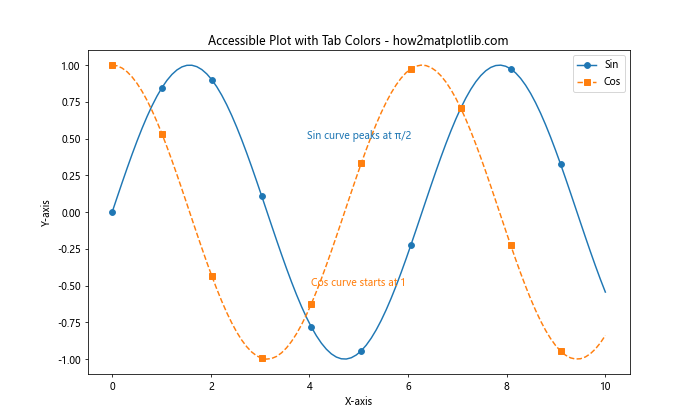
这个例子不仅使用了不同的Tab Colors,还结合了不同的线型和标记,并添加了文本描述,以提高图表的可访问性。
Tab Colors在不同主题中的应用
Matplotlib支持不同的绘图主题,Tab Colors在不同主题下可能会有不同的表现。以下是一个在不同主题下使用Tab Colors的示例:
import matplotlib.pyplot as plt
import numpy as np

x = np.linspace(0, 10, 100)
y1 = np.sin(x)
y2 = np.cos(x)

themes = ['default', 'seaborn', 'ggplot', 'dark_background']

fig, axs = plt.subplots(2, 2, figsize=(12, 10))
fig.suptitle('Tab Colors in Different Themes - how2matplotlib.com', fontsize=16)

for i, theme in enumerate(themes):
    with plt.style.context(theme):
        row = i // 2
        col = i % 2
        axs[row, col].plot(x, y1, color='tab:blue', label='Sin')
        axs[row, col].plot(x, y2, color='tab:orange', label='Cos')
        axs[row, col].set_title(f'{theme.capitalize()} Theme')
        axs[row, col].legend()

plt.tight_layout()
plt.show()
这个示例展示了Tab Colors在不同主题下的表现,帮助我们了解如何在不同的视觉环境中使用这些颜色。
结合其他颜色方案
虽然Tab Colors提供了一组优秀的预定义颜色,但有时我们可能需要将它们与其他颜色方案结合使用。以下是一个结合Tab Colors和其他颜色方案的示例:
import matplotlib.pyplot as plt
import numpy as np

x = np.linspace(0, 10, 100)
y1 = np.sin(x)
y2 = np.cos(x)
y3 = np.tan(x)

plt.figure(figsize=(10, 6))
plt.plot(x, y1, color='tab:blue', label='Sin')
plt.plot(x, y2, color='tab:orange', label='Cos')
plt.plot(x, y3, color='#FF1493', label='Tan')  # 使用自定义颜色

plt.title('Combining Tab Colors with Other Color Schemes - how2matplotlib.com')
plt.xlabel('X-axis')
plt.ylabel('Y-axis')
plt.legend()
plt.ylim(-2, 2)
plt.show()
Output:
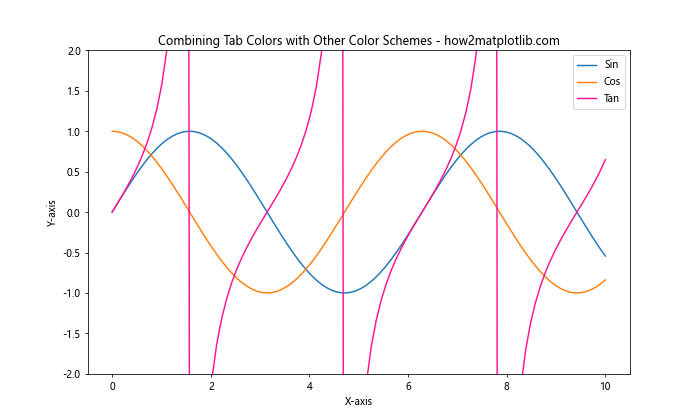
这个例子展示了如何将Tab Colors与自定义颜色结合使用,为图表添加更多的视觉多样性。
Tab Colors在动画中的应用
Tab Colors也可以在Matplotlib的动画功能中发挥作用。以下是一个使用Tab Colors创建简单动画的示例:
import matplotlib.pyplot as plt
import matplotlib.animation as animation
import numpy as np

fig, ax = plt.subplots(figsize=(8, 6))

x = np.linspace(0, 2*np.pi, 100)
line, = ax.plot(x, np.sin(x), color='tab:blue')

def animate(i):
    line.set_ydata(np.sin(x + i/10))
    return line,

ani = animation.FuncAnimation(fig, animate, frames=100, interval=50, blit=True)

plt.title('Animated Plot with Tab Colors - how2matplotlib.com')
plt.xlabel('X-axis')
plt.ylabel('Y-axis')
plt.show()
Output:
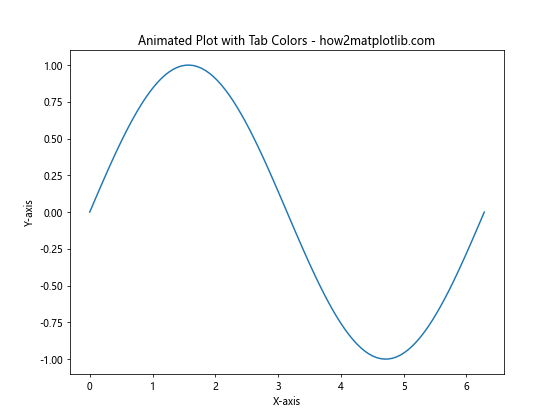
这个动画示例展示了如何使用Tab Colors来创建一个简单的正弦波动画。
总结
Matplotlib的Tab Colors提供了一组精心设计的预定义颜色,适用于各种数据可视化场景。通过本文的详细介绍和丰富的示例,我们了解了Tab Colors的特点、使用方法以及在不同类型图表中的应用。我们还探讨了如何自定义Tab Colors、在复杂图表中应用它们,以及考虑可访问性和不同主题的使用。
Tab Colors的优势在于:
- 视觉协调:这组颜色经过精心选择,能够在视觉上相互协调。
- 易于区分:每种颜色都具有独特的特征,便于在图表中区分不同的数据系列。
- 适用性广:Tab Colors适用于各种类型的图表和数据可视化场景。
- 可定制性:可以根据需要调整透明度或创建自定义颜色映射。
在使用Tab Colors时,我们应该注意:
- 考虑可访问性,确保图表对所有人都友好。
- 根据数据的特性和图表的目的选择合适的颜色。
- 在必要时,可以将Tab Colors与其他颜色方案结合使用。
通过掌握Tab Colors的使用,我们可以创建更加专业、美观且易于理解的数据可视化。无论是简单的线图还是复杂的多子图布局,Tab Colors都能帮助我们更好地展示数据,传达信息。
 极客笔记
极客笔记