Matplotlib中使用plot_surface绘制三维表面图
matplotlib plot_surface是Matplotlib库中用于绘制三维表面图的强大函数。它允许我们将三维数据可视化为连续的表面,非常适合展示复杂的数学函数、地形数据或其他三维关系。在本文中,我们将深入探讨plot_surface函数的使用方法、参数设置以及各种高级技巧,帮助您充分利用这个强大的可视化工具。
1. plot_surface函数基础
plot_surface函数是Matplotlib的mplot3d工具包中的一个重要函数,用于创建三维表面图。要使用这个函数,我们首先需要导入必要的模块并创建一个3D轴对象。
import numpy as np
import matplotlib.pyplot as plt
from mpl_toolkits.mplot3d import Axes3D

fig = plt.figure(figsize=(10, 8))
ax = fig.add_subplot(111, projection='3d')

# 创建数据
x = np.linspace(-5, 5, 100)
y = np.linspace(-5, 5, 100)
X, Y = np.meshgrid(x, y)
Z = np.sin(np.sqrt(X**2 + Y**2))

# 绘制表面图
surf = ax.plot_surface(X, Y, Z)

ax.set_xlabel('X axis')
ax.set_ylabel('Y axis')
ax.set_zlabel('Z axis')
ax.set_title('Surface Plot - how2matplotlib.com')

plt.show()

print("Surface plot created successfully")
Output:
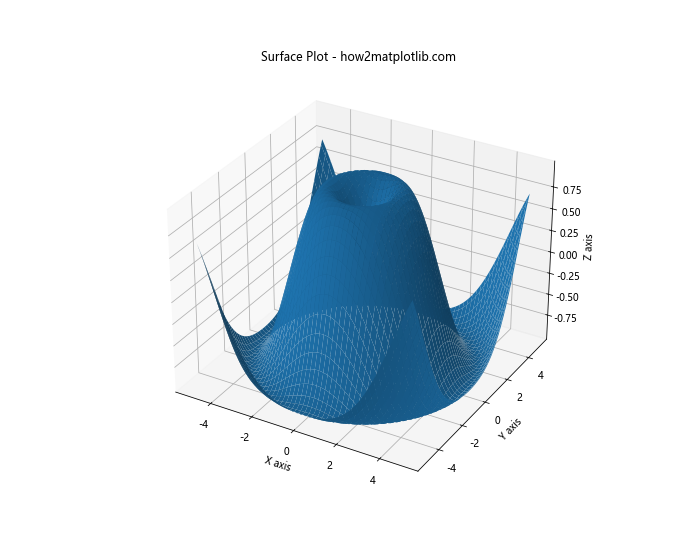
在这个基本示例中,我们首先创建了一个网格数据,然后使用plot_surface函数绘制了一个简单的三维表面图。这个函数需要三个参数:X、Y和Z,它们都是二维数组,表示三维空间中的坐标点。
2. 自定义颜色映射
plot_surface函数允许我们自定义表面的颜色映射,这可以帮助我们更好地理解数据的分布和变化。
import numpy as np
import matplotlib.pyplot as plt
from mpl_toolkits.mplot3d import Axes3D
from matplotlib import cm

fig = plt.figure(figsize=(12, 9))
ax = fig.add_subplot(111, projection='3d')

x = np.linspace(-3, 3, 50)
y = np.linspace(-3, 3, 50)
X, Y = np.meshgrid(x, y)
Z = np.sin(X) * np.cos(Y)

surf = ax.plot_surface(X, Y, Z, cmap=cm.coolwarm,
                       linewidth=0, antialiased=False)

ax.set_xlabel('X axis')
ax.set_ylabel('Y axis')
ax.set_zlabel('Z axis')
ax.set_title('Custom Colormap - how2matplotlib.com')

fig.colorbar(surf, shrink=0.5, aspect=5)

plt.show()

print("Surface plot with custom colormap created")
Output:
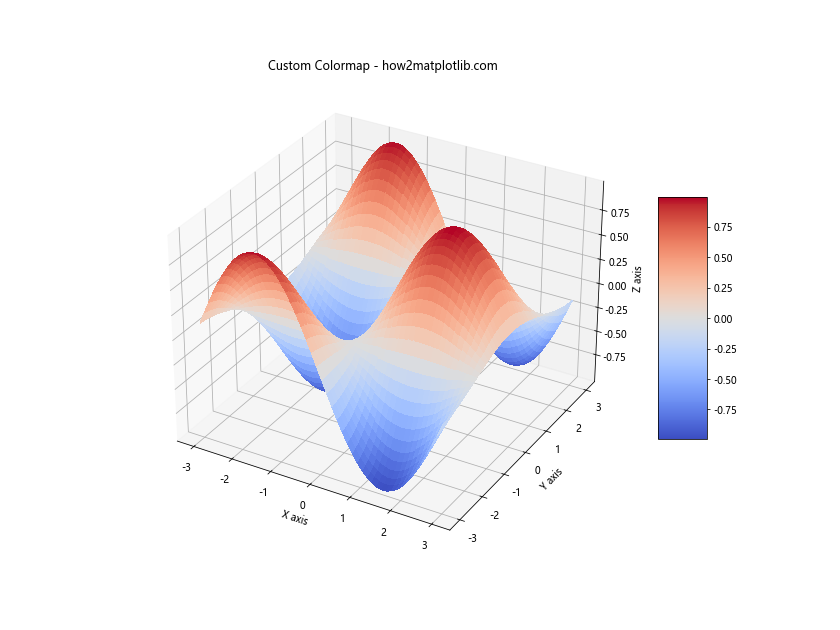
在这个例子中,我们使用了cm.coolwarm颜色映射,这是一种常用的用于表示温度或其他双极数据的颜色映射。我们还添加了一个颜色条,以帮助解释颜色与数值的对应关系。
3. 调整表面样式
plot_surface函数提供了多个参数来调整表面的外观,包括线宽、抗锯齿效果等。
import numpy as np
import matplotlib.pyplot as plt
from mpl_toolkits.mplot3d import Axes3D

fig = plt.figure(figsize=(12, 9))
ax = fig.add_subplot(111, projection='3d')

x = np.linspace(-5, 5, 50)
y = np.linspace(-5, 5, 50)
X, Y = np.meshgrid(x, y)
Z = np.sin(np.sqrt(X**2 + Y**2))

surf = ax.plot_surface(X, Y, Z, cmap='viridis',
                       linewidth=1, antialiased=True, alpha=0.7)

ax.set_xlabel('X axis')
ax.set_ylabel('Y axis')
ax.set_zlabel('Z axis')
ax.set_title('Styled Surface Plot - how2matplotlib.com')

plt.show()

print("Styled surface plot created")
Output:
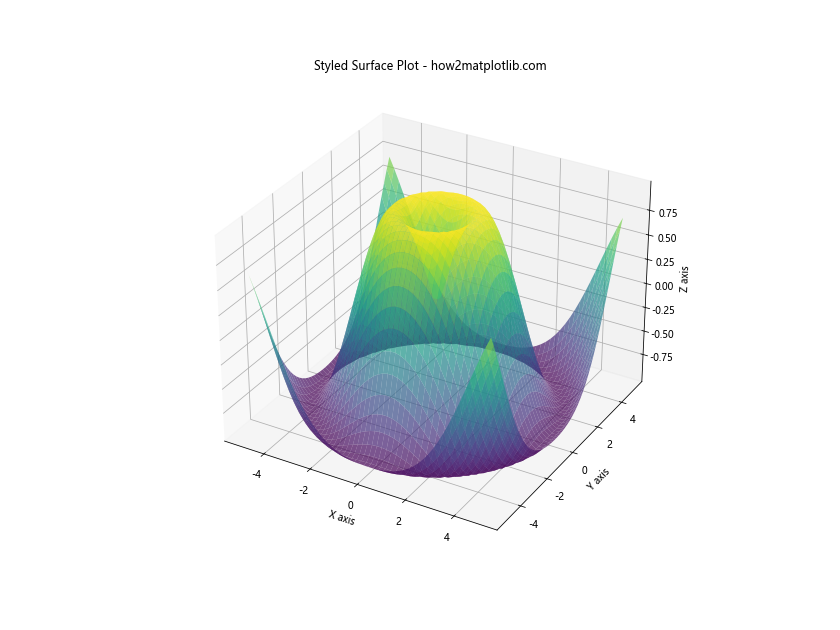
在这个例子中,我们设置了线宽为1,启用了抗锯齿效果,并将表面的透明度设置为0.7。这些设置可以让表面看起来更加平滑和精细。
4. 添加等高线
在三维表面图上添加等高线可以帮助我们更好地理解表面的形状和高度变化。
import numpy as np
import matplotlib.pyplot as plt
from mpl_toolkits.mplot3d import Axes3D

fig = plt.figure(figsize=(12, 9))
ax = fig.add_subplot(111, projection='3d')

x = np.linspace(-5, 5, 100)
y = np.linspace(-5, 5, 100)
X, Y = np.meshgrid(x, y)
Z = np.sin(np.sqrt(X**2 + Y**2))

surf = ax.plot_surface(X, Y, Z, cmap='viridis', alpha=0.8)
contours = ax.contour(X, Y, Z, zdir='z', offset=-2, cmap='coolwarm')

ax.set_xlabel('X axis')
ax.set_ylabel('Y axis')
ax.set_zlabel('Z axis')
ax.set_title('Surface Plot with Contours - how2matplotlib.com')
ax.set_zlim(-2, 1)

plt.show()

print("Surface plot with contours created")
Output:
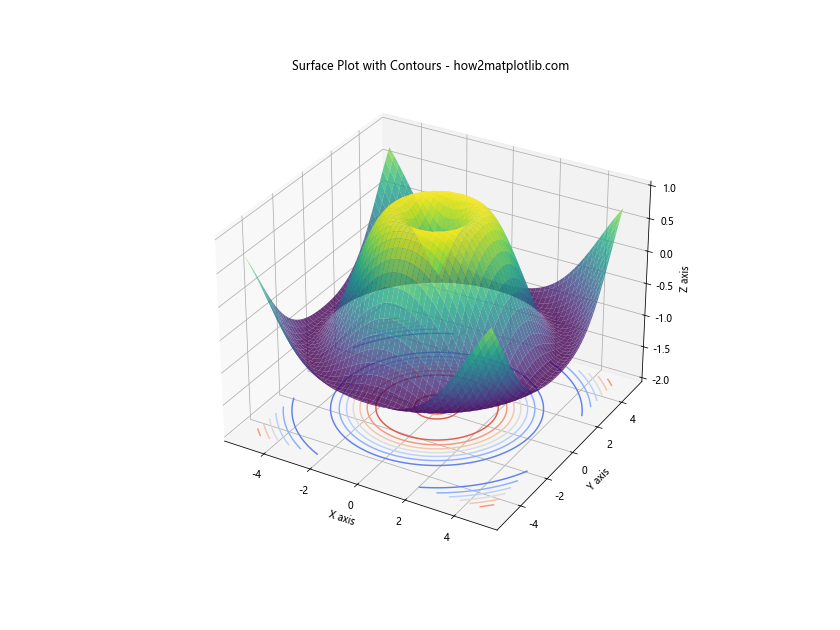
在这个例子中,我们使用contour函数在z=-2的平面上绘制了等高线。这些等高线可以帮助我们更直观地看到表面在不同高度的横截面形状。
5. 多个表面的比较
有时我们需要在同一个图中比较多个表面。plot_surface函数允许我们在一个3D轴上绘制多个表面。
import numpy as np
import matplotlib.pyplot as plt
from mpl_toolkits.mplot3d import Axes3D

fig = plt.figure(figsize=(14, 10))
ax = fig.add_subplot(111, projection='3d')

x = np.linspace(-5, 5, 50)
y = np.linspace(-5, 5, 50)
X, Y = np.meshgrid(x, y)

Z1 = np.sin(np.sqrt(X**2 + Y**2))
Z2 = np.cos(np.sqrt(X**2 + Y**2))

surf1 = ax.plot_surface(X, Y, Z1, cmap='viridis', alpha=0.7)
surf2 = ax.plot_surface(X, Y, Z2, cmap='plasma', alpha=0.7)

ax.set_xlabel('X axis')
ax.set_ylabel('Y axis')
ax.set_zlabel('Z axis')
ax.set_title('Multiple Surfaces - how2matplotlib.com')

plt.show()

print("Multiple surface plot created")
Output:

在这个例子中,我们绘制了两个不同的表面(正弦和余弦函数),并使用不同的颜色映射和透明度来区分它们。这种方法可以帮助我们直观地比较不同函数或数据集的特征。
6. 自定义网格线
plot_surface函数允许我们自定义表面的网格线,这可以帮助我们更清晰地看到表面的结构。
import numpy as np
import matplotlib.pyplot as plt
from mpl_toolkits.mplot3d import Axes3D

fig = plt.figure(figsize=(12, 9))
ax = fig.add_subplot(111, projection='3d')

x = np.linspace(-5, 5, 20)
y = np.linspace(-5, 5, 20)
X, Y = np.meshgrid(x, y)
Z = np.sin(np.sqrt(X**2 + Y**2))

surf = ax.plot_surface(X, Y, Z, cmap='viridis',
                       linewidth=0.5, antialiased=True,
                       rstride=1, cstride=1)

ax.set_xlabel('X axis')
ax.set_ylabel('Y axis')
ax.set_zlabel('Z axis')
ax.set_title('Surface Plot with Custom Grid - how2matplotlib.com')

plt.show()

print("Surface plot with custom grid created")
Output:
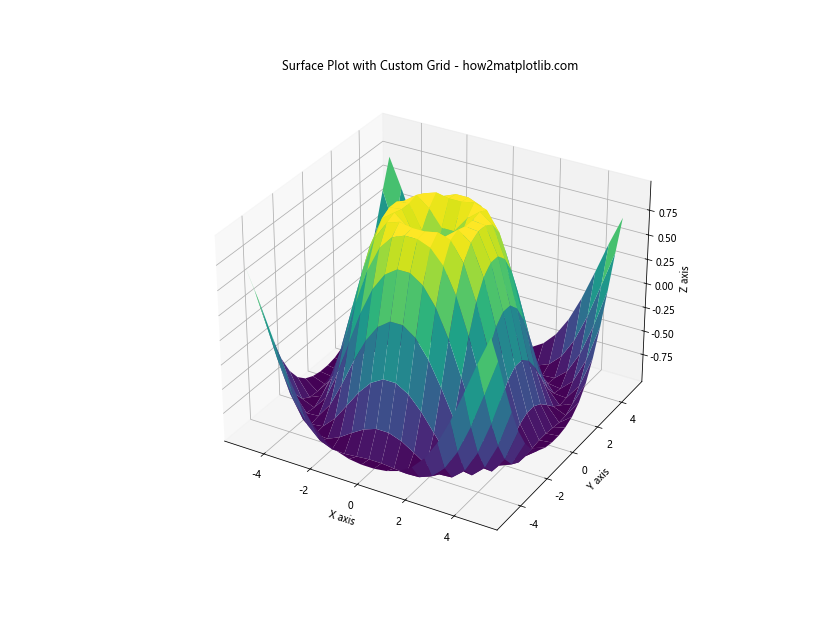
在这个例子中,我们使用rstride和cstride参数来控制网格线的密度。这两个参数分别控制行和列方向上的步长,值越小,网格线越密集。
7. 添加光照效果
为了使三维表面看起来更加真实,我们可以添加光照效果。这可以通过设置表面的法向量来实现。
import numpy as np
import matplotlib.pyplot as plt
from mpl_toolkits.mplot3d import Axes3D

fig = plt.figure(figsize=(12, 9))
ax = fig.add_subplot(111, projection='3d')

x = np.linspace(-5, 5, 50)
y = np.linspace(-5, 5, 50)
X, Y = np.meshgrid(x, y)
Z = np.sin(np.sqrt(X**2 + Y**2))

surf = ax.plot_surface(X, Y, Z, cmap='viridis',
                       linewidth=0, antialiased=False,
                       shade=True, lightsource=plt.matplotlib.colors.LightSource(azdeg=315, altdeg=45))

ax.set_xlabel('X axis')
ax.set_ylabel('Y axis')
ax.set_zlabel('Z axis')
ax.set_title('Surface Plot with Lighting - how2matplotlib.com')

plt.show()

print("Surface plot with lighting created")
Output:
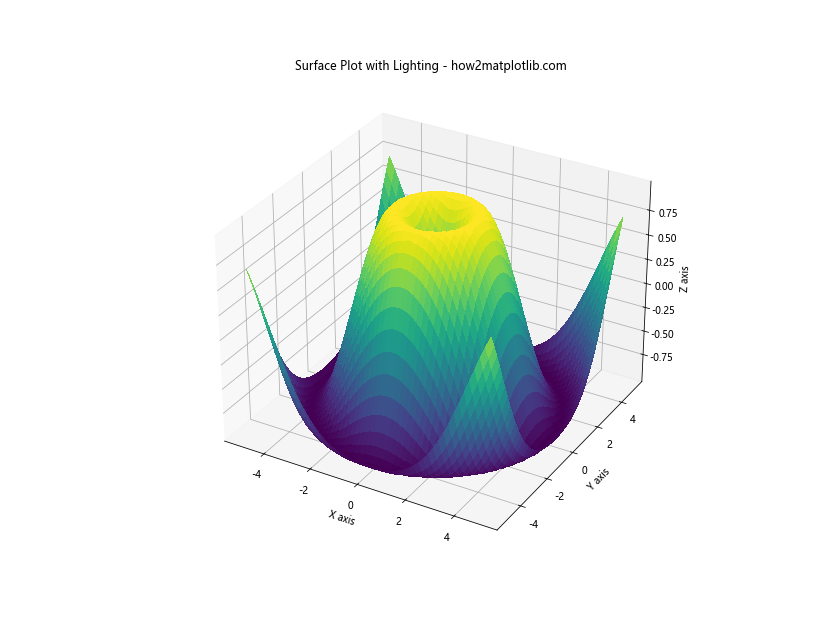
在这个例子中,我们使用了LightSource对象来创建光照效果。azdeg和altdeg参数分别控制光源的方位角和高度角。
8. 动态旋转视图
为了更好地观察三维表面的所有细节,我们可以创建一个动态旋转的视图。
import numpy as np
import matplotlib.pyplot as plt
from mpl_toolkits.mplot3d import Axes3D
from matplotlib.animation import FuncAnimation

fig = plt.figure(figsize=(10, 8))
ax = fig.add_subplot(111, projection='3d')

x = np.linspace(-5, 5, 50)
y = np.linspace(-5, 5, 50)
X, Y = np.meshgrid(x, y)
Z = np.sin(np.sqrt(X**2 + Y**2))

surf = ax.plot_surface(X, Y, Z, cmap='viridis')

ax.set_xlabel('X axis')
ax.set_ylabel('Y axis')
ax.set_zlabel('Z axis')
ax.set_title('Rotating Surface Plot - how2matplotlib.com')

def rotate(angle):
    ax.view_init(elev=10., azim=angle)
    return surf,

ani = FuncAnimation(fig, rotate, frames=np.linspace(0, 360, 200),
                    interval=50, blit=True)

plt.show()

print("Rotating surface plot animation created")
Output:
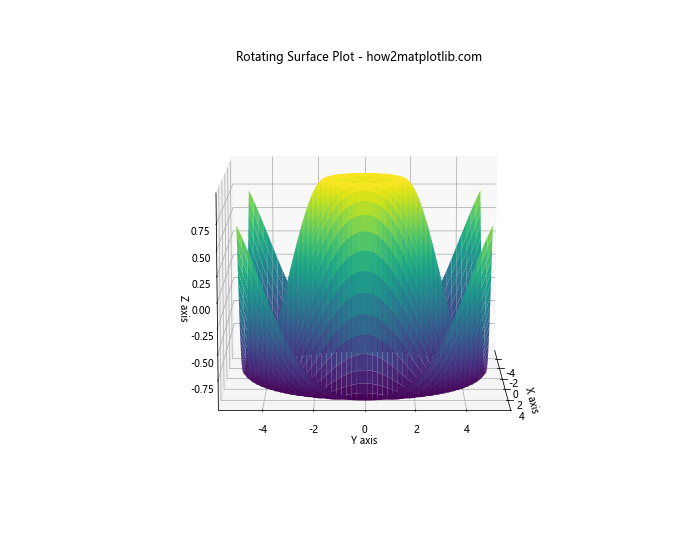
在这个例子中,我们使用FuncAnimation创建了一个动画,通过不断改变视角来旋转表面。这可以帮助我们从不同角度观察表面的特征。
9. 使用不同的投影方式
Matplotlib提供了多种3D投影方式,我们可以尝试不同的投影来展示数据。
import numpy as np
import matplotlib.pyplot as plt
from mpl_toolkits.mplot3d import Axes3D

fig = plt.figure(figsize=(15, 5))

projections = ['3d', 'aitoff', 'hammer']

for i, proj in enumerate(projections):
    ax = fig.add_subplot(131 + i, projection=proj)

    if proj == '3d':
        x = np.linspace(-5, 5, 50)
        y = np.linspace(-5, 5, 50)
        X, Y = np.meshgrid(x, y)
        Z = np.sin(np.sqrt(X**2 + Y**2))
        surf = ax.plot_surface(X, Y, Z, cmap='viridis')
    else:
        x = np.linspace(-np.pi, np.pi, 100)
        y = np.linspace(-np.pi/2, np.pi/2, 100)
        X, Y = np.meshgrid(x, y)
        Z = np.cos(X) * np.cos(Y)
        surf = ax.contourf(X, Y, Z, cmap='viridis')

    ax.set_title(f'{proj.capitalize()} Projection - how2matplotlib.com')

plt.tight_layout()
plt.show()

print("Multiple projection plots created")
Output:
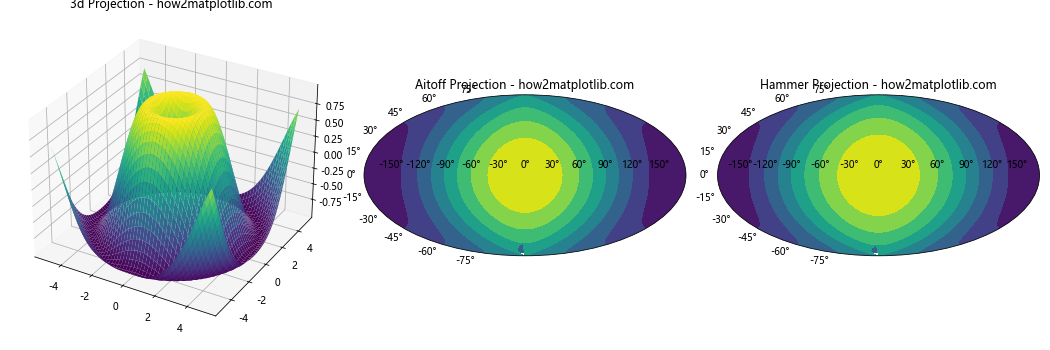
在这个例子中,我们展示了三种不同的投影方式:3D、Aitoff和Hammer投影。对于非3D投影,我们使用contourf函数来绘制等高线填充图,以模拟表面的效果。
10. 添加文本标注
在三维表面图上添加文本标注可以帮助我们标识特定的点或区域。
import numpy as np
import matplotlib.pyplot as plt
from mpl_toolkits.mplot3d import Axes3D

fig = plt.figure(figsize=(12, 9))
ax = fig.add_subplot(111, projection='3d')

x = np.linspace(-5, 5, 50)
y = np.linspace(-5, 5, 50)
X, Y = np.meshgrid(x, y)
Z = np.sin(np.sqrt(X**2 + Y**2))

surf = ax.plot_surface(X, Y, Z, cmap='viridis')

ax.set_xlabel('X axis')
ax.set_ylabel('Y axis')
ax.set_zlabel('Z axis')
ax.set_title('Surface Plot with Annotations - how2matplotlib.com')

# 添加文本标注
ax.text(0, 0, 1, "Peak", color='red')
ax.text(4, 4, -0.5, "Valley", color='blue', fontsize=12)

plt.show()

print("Surface plot with annotations created")
Output:
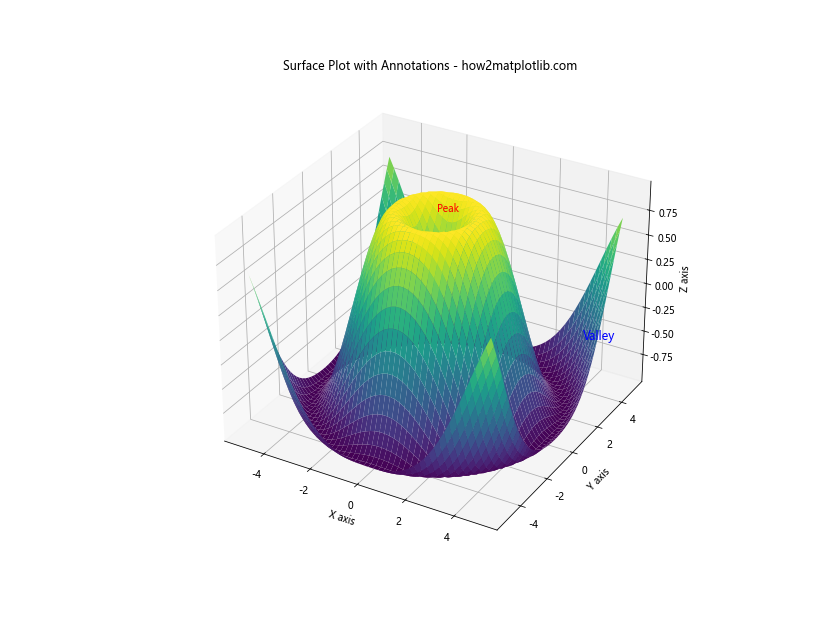
在这个例子中,我们使用ax.text()函数在三维空间中的特定坐标添加了文本标注。这可以帮助我们标识表面上的重要特征或区域。
11. 使用不同的颜色映射
Matplotlib提供了多种颜色映射,我们可以根据数据的特性选择最合适的颜色映射来展示数据。
import numpy as np
import matplotlib.pyplot as plt
from mpl_toolkits.mplot3d import Axes3D

fig = plt.figure(figsize=(15, 10))

cmaps = ['viridis', 'plasma', 'inferno', 'magma']

for i, cmap in enumerate(cmaps):
    ax = fig.add_subplot(2, 2, i+1, projection='3d')

    x = np.linspace(-5, 5, 50)
    y = np.linspace(-5, 5, 50)
    X, Y = np.meshgrid(x, y)
    Z = np.sin(np.sqrt(X**2 + Y**2))

    surf = ax.plot_surface(X, Y, Z, cmap=cmap)

    ax.set_xlabel('X axis')
    ax.set_ylabel('Y axis')
    ax.set_zlabel('Z axis')
    ax.set_title(f'{cmap.capitalize()} Colormap - how2matplotlib.com')

    fig.colorbar(surf, ax=ax, shrink=0.5, aspect=5)

plt.tight_layout()
plt.show()

print("Surface plots with different colormaps created")
Output:
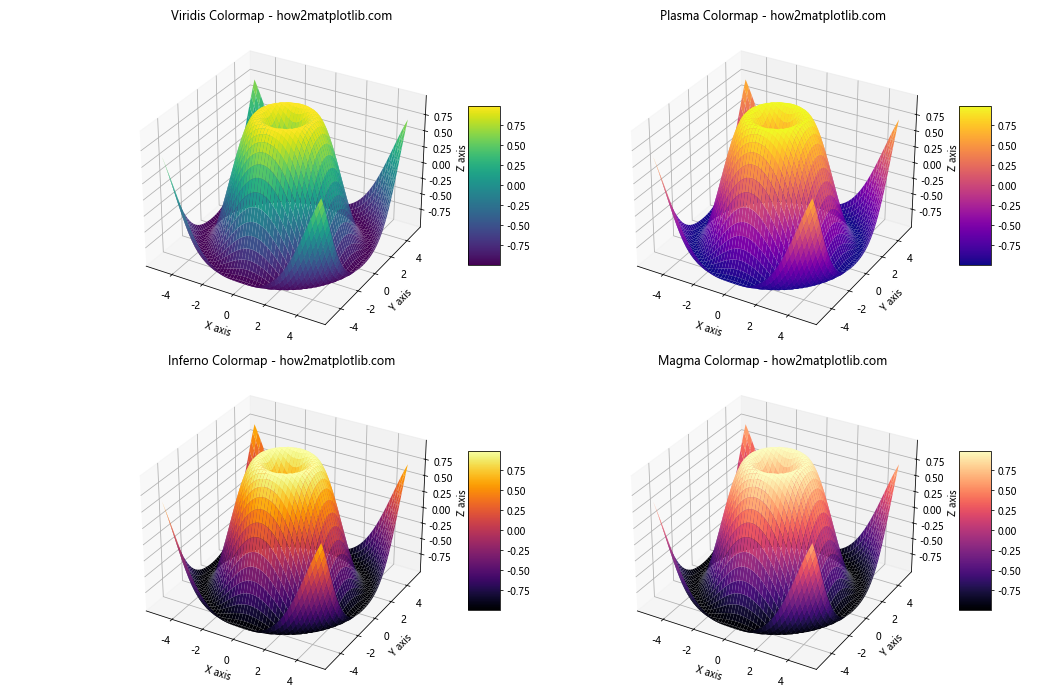
在这个例子中,我们展示了四种不同的颜色映射:viridis、plasma、inferno和magma。这些颜色映射都是为了在打印时保持清晰度和可读性而设计的。
12. 添加阴影效果
为了增强三维表面的立体感,我们可以在底部平面添加阴影效果。
import numpy as np
import matplotlib.pyplot as plt
from mpl_toolkits.mplot3d import Axes3D

fig = plt.figure(figsize=(12, 9))
ax = fig.add_subplot(111, projection='3d')

x = np.linspace(-5, 5, 50)
y = np.linspace(-5, 5, 50)
X, Y = np.meshgrid(x, y)
Z = np.sin(np.sqrt(X**2 + Y**2))

surf = ax.plot_surface(X, Y, Z, cmap='viridis')

# 添加阴影
ax.contourf(X, Y, Z, zdir='z', offset=-2, cmap='viridis', alpha=0.5)

ax.set_xlabel('X axis')
ax.set_ylabel('Y axis')
ax.set_zlabel('Z axis')
ax.set_title('Surface Plot with Shadow - how2matplotlib.com')
ax.set_zlim(-2, 1)

plt.show()

print("Surface plot with shadow effect created")
Output:
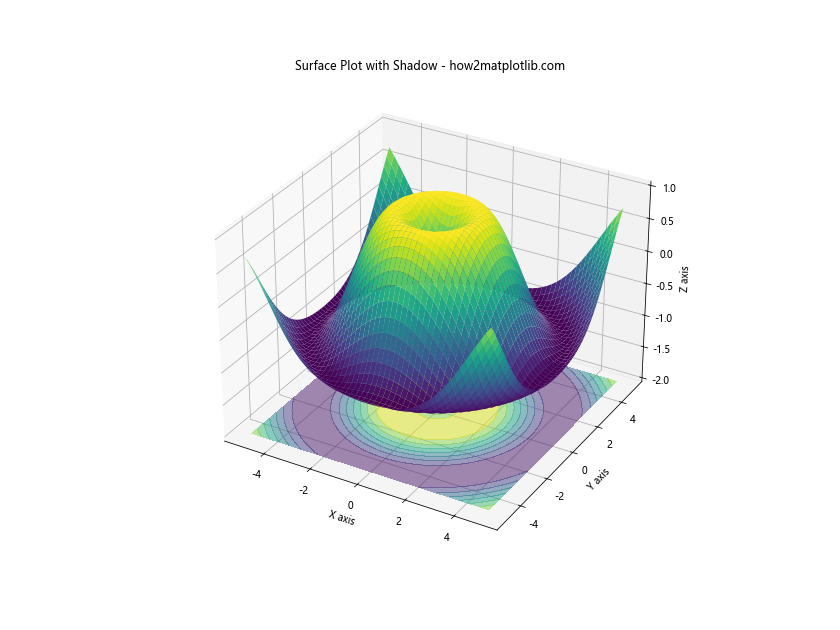
在这个例子中,我们使用contourf函数在z=-2的平面上绘制了表面的投影,并设置了一定的透明度来创建阴影效果。
13. 绘制复杂函数
plot_surface函数不仅可以绘制简单的数学函数,还可以用来可视化更复杂的函数。
import numpy as np
import matplotlib.pyplot as plt
from mpl_toolkits.mplot3d import Axes3D

def complex_function(x, y):
    return np.sin(x) * np.cos(y) * np.exp(-np.sqrt(x**2 + y**2) / 10)

fig = plt.figure(figsize=(12, 9))
ax = fig.add_subplot(111, projection='3d')

x = np.linspace(-10, 10, 100)
y = np.linspace(-10, 10, 100)
X, Y = np.meshgrid(x, y)
Z = complex_function(X, Y)

surf = ax.plot_surface(X, Y, Z, cmap='coolwarm')

ax.set_xlabel('X axis')
ax.set_ylabel('Y axis')
ax.set_zlabel('Z axis')
ax.set_title('Complex Function Surface - how2matplotlib.com')

fig.colorbar(surf, shrink=0.5, aspect=5)

plt.show()

print("Complex function surface plot created")
Output:
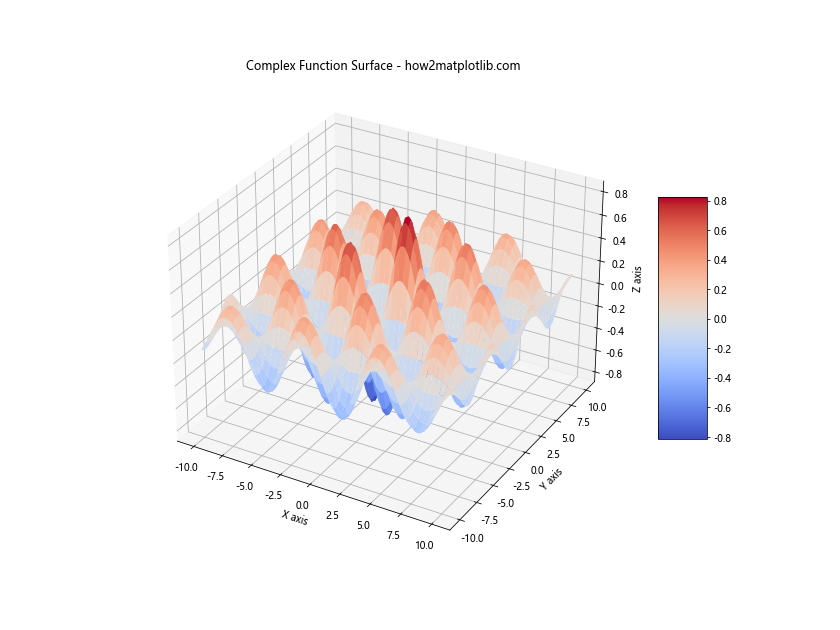
在这个例子中,我们定义了一个更复杂的函数,它结合了正弦、余弦和指数函数。这种复杂函数的可视化可以帮助我们理解函数在不同输入值下的行为。
14. 绘制参数化曲面
plot_surface函数还可以用来绘制参数化曲面,这在数学和物理中非常有用。
import numpy as np
import matplotlib.pyplot as plt
from mpl_toolkits.mplot3d import Axes3D

fig = plt.figure(figsize=(12, 9))
ax = fig.add_subplot(111, projection='3d')

u = np.linspace(0, 2 * np.pi, 100)
v = np.linspace(0, np.pi, 100)
U, V = np.meshgrid(u, v)

X = 10 * np.cos(U) * np.sin(V)
Y = 10 * np.sin(U) * np.sin(V)
Z = 10 * np.cos(V)

surf = ax.plot_surface(X, Y, Z, cmap='viridis')

ax.set_xlabel('X axis')
ax.set_ylabel('Y axis')
ax.set_zlabel('Z axis')
ax.set_title('Parametric Surface (Sphere) - how2matplotlib.com')

plt.show()

print("Parametric surface plot created")
Output:
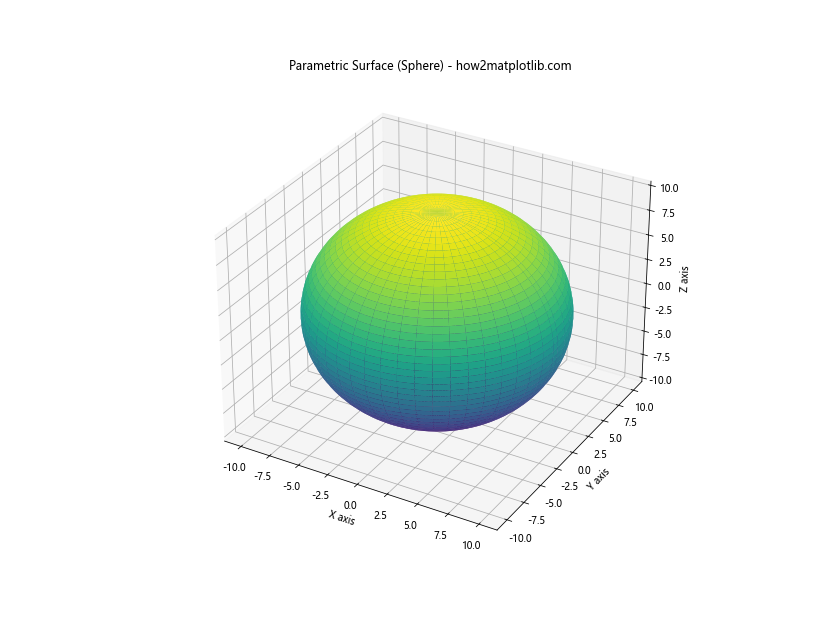
在这个例子中,我们绘制了一个球体的参数化表示。这种方法可以用来绘制各种复杂的几何形状。
15. 绘制地形数据
plot_surface函数在地理信息系统(GIS)中也非常有用,可以用来可视化地形数据。
import numpy as np
import matplotlib.pyplot as plt
from mpl_toolkits.mplot3d import Axes3D

def generate_terrain(size, roughness):
    terrain = np.zeros((size, size))
    terrain[0, 0] = np.random.rand()
    step = size - 1
    while step > 1:
        for i in range(0, size, step):
            for j in range(0, size, step):
                square_avg = np.mean([terrain[i, j], terrain[min(i+step, size-1), j],
                                      terrain[i, min(j+step, size-1)], terrain[min(i+step, size-1), min(j+step, size-1)]])
                terrain[i+step//2, j+step//2] = square_avg + np.random.uniform(-roughness, roughness)
        step //= 2
        roughness /= 2
    return terrain

fig = plt.figure(figsize=(12, 9))
ax = fig.add_subplot(111, projection='3d')

size = 129
terrain = generate_terrain(size, 1)
x = np.linspace(0, 10, size)
y = np.linspace(0, 10, size)
X, Y = np.meshgrid(x, y)

surf = ax.plot_surface(X, Y, terrain, cmap='terrain')

ax.set_xlabel('X axis')
ax.set_ylabel('Y axis')
ax.set_zlabel('Elevation')
ax.set_title('Terrain Visualization - how2matplotlib.com')

fig.colorbar(surf, shrink=0.5, aspect=5)

plt.show()

print("Terrain surface plot created")
在这个例子中,我们使用了一个简单的算法生成了模拟地形数据,然后使用plot_surface函数将其可视化。这种方法可以用来展示真实的地形数据或其他类似的三维数据集。
16. 绘制多个子图
有时我们需要在一个图中比较多个不同的表面。我们可以使用子图功能来实现这一点。
import numpy as np
import matplotlib.pyplot as plt
from mpl_toolkits.mplot3d import Axes3D

fig = plt.figure(figsize=(15, 10))

functions = [
    lambda x, y: np.sin(np.sqrt(x**2 + y**2)),
    lambda x, y: np.cos(x) * np.sin(y),
    lambda x, y: x**2 - y**2,
    lambda x, y: np.exp(-(x**2 + y**2))
]

for i, func in enumerate(functions):
    ax = fig.add_subplot(2, 2, i+1, projection='3d')

    x = np.linspace(-5, 5, 50)
    y = np.linspace(-5, 5, 50)
    X, Y = np.meshgrid(x, y)
    Z = func(X, Y)

    surf = ax.plot_surface(X, Y, Z, cmap='viridis')

    ax.set_xlabel('X axis')
    ax.set_ylabel('Y axis')
    ax.set_zlabel('Z axis')
    ax.set_title(f'Surface {i+1} - how2matplotlib.com')

plt.tight_layout()
plt.show()

print("Multiple surface plots created")
Output:
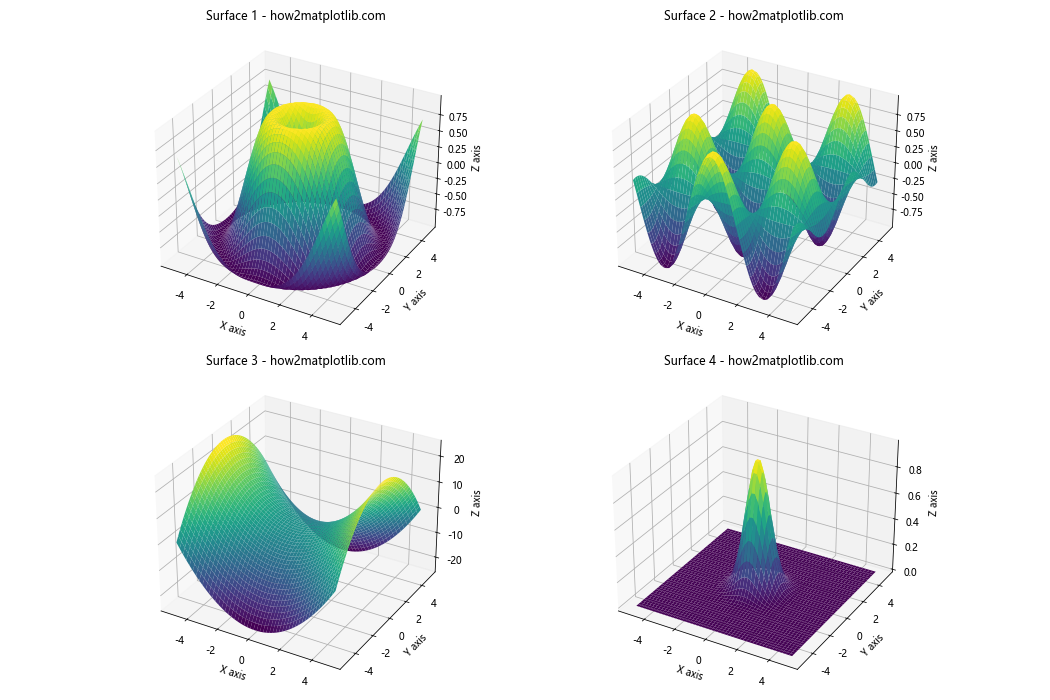
在这个例子中,我们创建了四个不同的子图,每个子图都显示了一个不同的数学函数的三维表面。这种方法可以帮助我们直观地比较不同函数的特征。
17. 使用不同的绘图样式
Matplotlib提供了多种绘图样式,我们可以使用这些样式来改变图表的整体外观。
import numpy as np
import matplotlib.pyplot as plt
from mpl_toolkits.mplot3d import Axes3D

styles = ['default', 'seaborn-darkgrid', 'ggplot', 'bmh']

fig = plt.figure(figsize=(20, 15))

for i, style in enumerate(styles):
    plt.style.use(style)

    ax = fig.add_subplot(2, 2, i+1, projection='3d')

    x = np.linspace(-5, 5, 50)
    y = np.linspace(-5, 5, 50)
    X, Y = np.meshgrid(x, y)
    Z = np.sin(np.sqrt(X**2 + Y**2))

    surf = ax.plot_surface(X, Y, Z, cmap='viridis')

    ax.set_xlabel('X axis')
    ax.set_ylabel('Y axis')
    ax.set_zlabel('Z axis')
    ax.set_title(f'{style.capitalize()} Style - how2matplotlib.com')

plt.tight_layout()
plt.show()

print("Surface plots with different styles created")
在这个例子中,我们使用了四种不同的绘图样式:默认样式、Seaborn的暗网格样式、ggplot样式和bmh样式。每种样式都会改变图表的颜色、字体和其他视觉元素。
18. 添加交互性
我们可以使用Matplotlib的交互工具来增加图表的交互性,允许用户旋转和缩放三维表面。
import numpy as np
import matplotlib.pyplot as plt
from mpl_toolkits.mplot3d import Axes3D

def interactive_surface():
    fig = plt.figure(figsize=(12, 9))
    ax = fig.add_subplot(111, projection='3d')

    x = np.linspace(-5, 5, 50)
    y = np.linspace(-5, 5, 50)
    X, Y = np.meshgrid(x, y)
    Z = np.sin(np.sqrt(X**2 + Y**2))

    surf = ax.plot_surface(X, Y, Z, cmap='viridis')

    ax.set_xlabel('X axis')
    ax.set_ylabel('Y axis')
    ax.set_zlabel('Z axis')
    ax.set_title('Interactive Surface Plot - how2matplotlib.com')

    plt.show()

interactive_surface()

print("Interactive surface plot created. You can now rotate and zoom the plot.")
Output:

在这个例子中,我们创建了一个基本的交互式三维表面图。当你运行这段代码时,你可以使用鼠标来旋转和缩放图表,以便从不同角度观察表面。
19. 使用不同的表面类型
除了常规的表面图,Matplotlib还提供了其他类型的三维图,如线框图和点云图。
import numpy as np
import matplotlib.pyplot as plt
from mpl_toolkits.mplot3d import Axes3D

fig = plt.figure(figsize=(15, 5))

x = np.linspace(-5, 5, 50)
y = np.linspace(-5, 5, 50)
X, Y = np.meshgrid(x, y)
Z = np.sin(np.sqrt(X**2 + Y**2))

# Surface plot
ax1 = fig.add_subplot(131, projection='3d')
surf = ax1.plot_surface(X, Y, Z, cmap='viridis')
ax1.set_title('Surface Plot - how2matplotlib.com')

# Wireframe plot
ax2 = fig.add_subplot(132, projection='3d')
wire = ax2.plot_wireframe(X, Y, Z, color='r')
ax2.set_title('Wireframe Plot - how2matplotlib.com')

# Scatter plot
ax3 = fig.add_subplot(133, projection='3d')
scatter = ax3.scatter(X, Y, Z, c=Z, cmap='viridis')
ax3.set_title('Scatter Plot - how2matplotlib.com')

for ax in [ax1, ax2, ax3]:
    ax.set_xlabel('X axis')
    ax.set_ylabel('Y axis')
    ax.set_zlabel('Z axis')

plt.tight_layout()
plt.show()

print("Different types of 3D plots created")
Output:
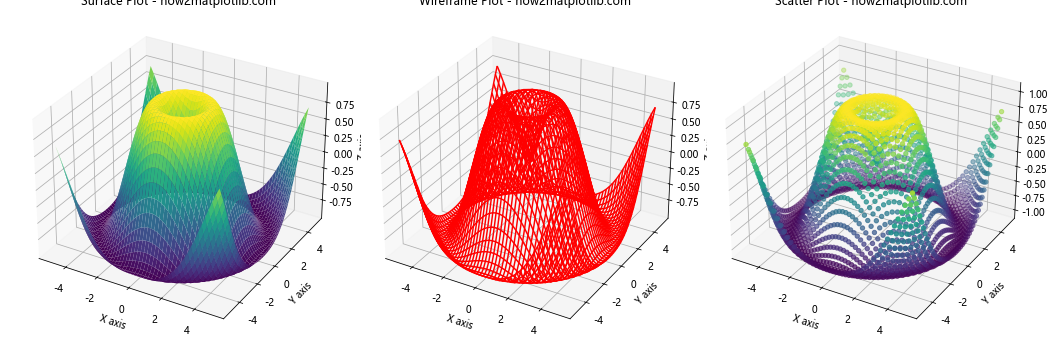
在这个例子中,我们展示了三种不同类型的三维图:表面图、线框图和散点图。每种类型都有其特定的用途和优势。
20. 自定义视角和缩放
我们可以通过设置视角和缩放来自定义三维图的显示方式。
import```python
import numpy as np
import matplotlib.pyplot as plt
from mpl_toolkits.mplot3d import Axes3D

fig = plt.figure(figsize=(20, 5))

x = np.linspace(-5, 5, 50)
y = np.linspace(-5, 5, 50)
X, Y = np.meshgrid(x, y)
Z = np.sin(np.sqrt(X**2 + Y**2))

views = [(30, 45), (60, 30), (90, 0), (20, 80)]

for i, (elev, azim) in enumerate(views):
    ax = fig.add_subplot(141 + i, projection='3d')
    surf = ax.plot_surface(X, Y, Z, cmap='viridis')

    ax.view_init(elev=elev, azim=azim)
    ax.set_xlabel('X axis')
    ax.set_ylabel('Y axis')
    ax.set_zlabel('Z axis')
    ax.set_title(f'Elevation: {elev}, Azimuth: {azim} - how2matplotlib.com')

plt.tight_layout()
plt.show()

print("Surface plots with different viewpoints created")
在这个例子中,我们创建了四个子图,每个子图都显示了相同的表面,但从不同的角度观察。我们使用view_init()函数来设置每个视图的仰角(elevation)和方位角(azimuth)。这种方法可以帮助我们从不同角度观察数据,发现可能被单一视角遗漏的特征。
结论
通过本文的详细介绍和丰富的示例,我们深入探讨了Matplotlib中plot_surface函数的使用方法和各种高级技巧。从基本的表面图绘制到复杂的自定义和交互式可视化,plot_surface函数展现了其强大的功能和灵活性。
我们学习了如何:
1. 创建基本的三维表面图
2. 自定义颜色映射和样式
3. 添加等高线和光照效果
4. 创建动态旋转视图
5. 使用不同的投影方式
6. 添加文本标注和阴影效果
7. 绘制复杂函数和参数化曲面
8. 可视化地形数据
9. 创建多个子图进行比较
10. 使用不同的绘图样式
11. 添加交互性
12. 尝试不同类型的三维图
13. 自定义视角和缩放
这些技巧和方法可以帮助我们更好地理解和展示三维数据,无论是在科学研究、数据分析还是可视化艺术领域。通过组合这些技术,我们可以创建出既信息丰富又视觉吸引的三维可视化效果。
然而,这只是Matplotlib三维绘图功能的冰山一角。随着深入学习和实践,你会发现更多强大的功能和技巧。例如,你可以探索如何将三维图与其他类型的图表结合,如何优化大规模数据的渲染性能,或者如何将这些可视化嵌入到交互式应用程序中。
最后,记住可视化的目的是传达信息和洞察。虽然三维图表可以非常引人注目,但有时简单的二维图表可能更有效地传达你的信息。始终根据你的数据和目标受众选择最合适的可视化方法。
 极客笔记
极客笔记