Matplotlib饼图图例:如何创建和自定义饼图及其图例
参考:matplotlib pie chart legend
Matplotlib是Python中最流行的数据可视化库之一,它提供了强大的工具来创建各种类型的图表,包括饼图。饼图是一种圆形统计图形,用于显示数据的比例分布。在本文中,我们将深入探讨如何使用Matplotlib创建饼图,并重点关注如何添加和自定义图例。我们将涵盖从基础到高级的各种技巧,帮助你掌握饼图和图例的创建与定制。
1. 基础饼图的创建
首先,让我们从创建一个基本的饼图开始。饼图通常用于显示各部分占整体的比例。以下是一个简单的例子:
import matplotlib.pyplot as plt

# 数据
sizes = [30, 20, 25, 15, 10]
labels = ['A', 'B', 'C', 'D', 'E']

# 创建饼图
plt.pie(sizes, labels=labels)
plt.title('How2matplotlib.com Basic Pie Chart')
plt.axis('equal')  # 确保饼图是圆的
plt.show()
Output:
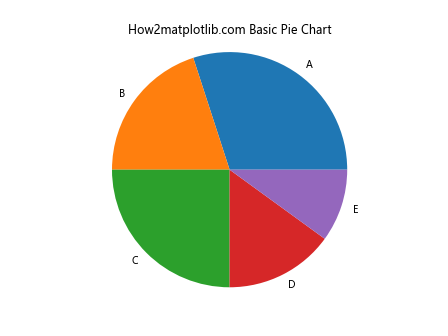
在这个例子中,我们使用plt.pie()函数创建了一个基本的饼图。sizes参数指定了每个扇区的大小,labels参数为每个扇区提供标签。plt.axis('equal')确保饼图是圆形的,而不是椭圆形。
2. 添加图例
虽然直接在饼图上标注标签很有用,但有时我们可能希望使用单独的图例来提供更清晰的信息。以下是如何添加图例的示例:
import matplotlib.pyplot as plt

sizes = [30, 20, 25, 15, 10]
labels = ['Apple', 'Banana', 'Cherry', 'Date', 'Elderberry']
colors = ['red', 'yellow', 'purple', 'brown', 'blue']

plt.pie(sizes, labels=labels, colors=colors, autopct='%1.1f%%', startangle=90)
plt.title('How2matplotlib.com Fruit Distribution')
plt.axis('equal')
plt.legend(title="Fruits", loc="center left", bbox_to_anchor=(1, 0, 0.5, 1))
plt.show()
Output:
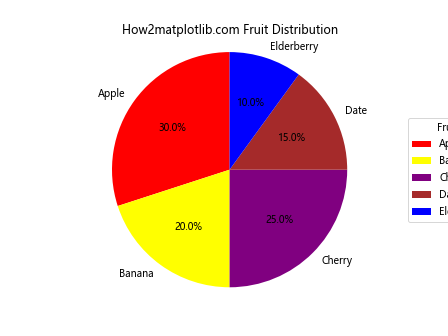
在这个例子中,我们使用plt.legend()函数添加了图例。title参数设置图例的标题,loc参数指定图例的位置,bbox_to_anchor参数用于微调图例的位置。
3. 自定义图例
Matplotlib提供了多种方式来自定义图例的外观。以下是一个更复杂的例子,展示了如何自定义图例:
import matplotlib.pyplot as plt

sizes = [25, 20, 30, 15, 10]
labels = ['Python', 'Java', 'JavaScript', 'C++', 'Ruby']
colors = ['#ff9999', '#66b3ff', '#99ff99', '#ffcc99', '#ff99cc']
explode = (0.1, 0, 0, 0, 0)  # 突出显示第一个扇区

fig, ax = plt.subplots()
ax.pie(sizes, explode=explode, labels=labels, colors=colors, autopct='%1.1f%%', startangle=90)
ax.axis('equal')

# 自定义图例
legend = ax.legend(title="Programming Languages", loc="center left", bbox_to_anchor=(1, 0, 0.5, 1))
legend.get_title().set_fontweight('bold')
for text in legend.get_texts():
    text.set_color('navy')

plt.title('How2matplotlib.com Programming Language Popularity')
plt.tight_layout()
plt.show()
Output:
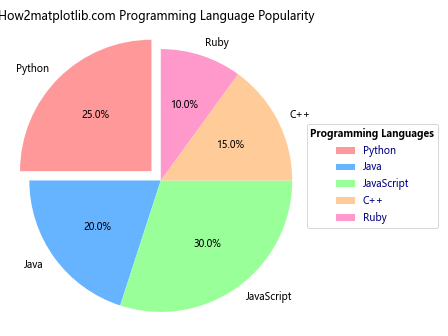
在这个例子中,我们使用了fig, ax = plt.subplots()来创建一个图形和轴对象,这给了我们更多的控制权。我们自定义了图例的标题字体粗细和文本颜色。
4. 分离图例项
有时,我们可能想要将某些项目从饼图中分离出来,并在图例中单独显示。这在处理大量小数据点时特别有用:
import matplotlib.pyplot as plt

sizes = [30, 25, 20, 10, 5, 3, 2, 5]
labels = ['A', 'B', 'C', 'D', 'E', 'F', 'G', 'Others']
colors = plt.cm.Spectral(np.linspace(0, 1, len(sizes)))

# 将小于5%的部分合并为"其他"
threshold = 5
small_sizes = [size if size >= threshold else 0 for size in sizes]
other_size = sum(size for size in sizes if size < threshold)
small_sizes[-1] = other_size

fig, ax = plt.subplots()
wedges, texts, autotexts = ax.pie(small_sizes, labels=labels, colors=colors, autopct='%1.1f%%', startangle=90)

# 隐藏小于阈值的标签和百分比
for i, size in enumerate(sizes):
    if size < threshold:
        texts[i].set_visible(False)
        autotexts[i].set_visible(False)

ax.axis('equal')
plt.title('How2matplotlib.com Data Distribution')

# 创建自定义图例
legend_labels = [f'{label}: {size}%' for label, size in zip(labels, sizes) if size >= threshold]
legend_labels.append(f'Others: {other_size}%')
plt.legend(legend_labels, title="Categories", loc="center left", bbox_to_anchor=(1, 0, 0.5, 1))

plt.tight_layout()
plt.show()
在这个例子中,我们将小于5%的部分合并为”其他”类别,并在图例中单独列出。这种方法可以使饼图更加清晰,同时仍然保留所有信息。
5. 嵌套饼图
嵌套饼图(也称为环形图)可以用来显示多层次的数据。以下是一个创建嵌套饼图的例子:
import matplotlib.pyplot as plt

# 外圈数据
sizes_outer = [40, 30, 30]
labels_outer = ['Fruits', 'Vegetables', 'Grains']
colors_outer = ['#ff9999', '#66b3ff', '#99ff99']

# 内圈数据
sizes_inner = [15, 25, 10, 20, 30]
labels_inner = ['Apples', 'Bananas', 'Carrots', 'Potatoes', 'Wheat']
colors_inner = ['#ff6666', '#ffcc99', '#ff9933', '#cc9900', '#cccc00']

fig, ax = plt.subplots()

# 绘制外圈
ax.pie(sizes_outer, labels=labels_outer, colors=colors_outer, autopct='%1.1f%%', startangle=90, radius=1, wedgeprops=dict(width=0.3, edgecolor='white'))

# 绘制内圈
ax.pie(sizes_inner, labels=labels_inner, colors=colors_inner, autopct='%1.1f%%', startangle=90, radius=0.7, wedgeprops=dict(width=0.4, edgecolor='white'))

ax.axis('equal')
plt.title('How2matplotlib.com Food Categories')

# 创建两个图例
outer_legend = plt.legend(labels_outer, title="Categories", loc="center left", bbox_to_anchor=(1, 0.6, 0.5, 0.4))
ax.add_artist(outer_legend)
plt.legend(labels_inner, title="Subcategories", loc="center left", bbox_to_anchor=(1, 0, 0.5, 0.4))

plt.tight_layout()
plt.show()
Output:
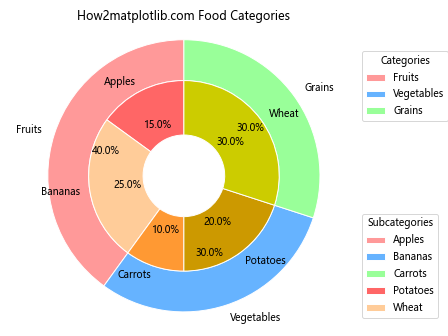
这个例子创建了一个嵌套饼图,外圈显示主要类别,内圈显示子类别。我们使用两个单独的plt.pie()调用来创建外圈和内圈,并为每个圈添加了单独的图例。
6. 动态图例
有时,我们可能需要根据数据动态生成图例。以下是一个根据数据值动态生成图例的例子:
import matplotlib.pyplot as plt

sizes = [35, 25, 20, 15, 5]
labels = ['Category A', 'Category B', 'Category C', 'Category D', 'Category E']
colors = plt.cm.Set3(np.linspace(0, 1, len(sizes)))

fig, ax = plt.subplots()
wedges, texts, autotexts = ax.pie(sizes, labels=labels, colors=colors, autopct='%1.1f%%', startangle=90)

ax.axis('equal')
plt.title('How2matplotlib.com Dynamic Legend Example')

# 动态生成图例
legend_labels = [f'{label} ({size}%)' for label, size in zip(labels, sizes)]
plt.legend(wedges, legend_labels, title="Categories", loc="center left", bbox_to_anchor=(1, 0, 0.5, 1))

plt.tight_layout()
plt.show()
在这个例子中,我们根据数据值动态生成图例标签,包括每个类别的百分比。这种方法可以让图例提供更多信息,而不仅仅是类别名称。
7. 自定义图例样式
Matplotlib允许我们高度自定义图例的样式。以下是一个展示如何自定义图例样式的详细例子:
import matplotlib.pyplot as plt
from matplotlib.patches import Circle

sizes = [30, 25, 20, 15, 10]
labels = ['A', 'B', 'C', 'D', 'E']
colors = ['#ff9999', '#66b3ff', '#99ff99', '#ffcc99', '#ff99cc']

fig, ax = plt.subplots()
wedges, texts, autotexts = ax.pie(sizes, labels=labels, colors=colors, autopct='%1.1f%%', startangle=90)

ax.axis('equal')
plt.title('How2matplotlib.com Custom Legend Style')

# 创建自定义图例
legend_elements = [Circle((0, 0), 0.25, facecolor=color, edgecolor='black') for color in colors]
legend = ax.legend(legend_elements, labels, title="Categories", loc="center left", bbox_to_anchor=(1, 0, 0.5, 1))

# 自定义图例样式
legend.get_frame().set_facecolor('#f0f0f0')
legend.get_frame().set_edgecolor('black')
legend.get_frame().set_linewidth(2)
plt.setp(legend.get_texts(), color='navy')
legend.get_title().set_fontweight('bold')

plt.tight_layout()
plt.show()
Output:
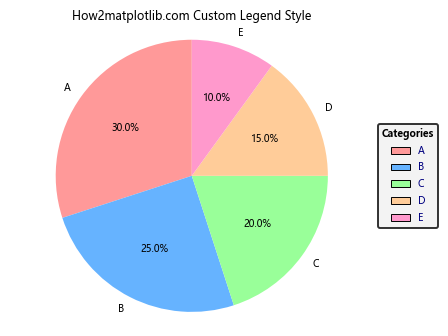
在这个例子中,我们使用Circle对象创建了自定义的图例标记,并详细设置了图例框的背景色、边框颜色和宽度,以及文本颜色和标题字体粗细。
8. 图例位置调整
图例的位置对于整体图表的布局非常重要。以下是一个展示如何精确调整图例位置的例子:
import matplotlib.pyplot as plt

sizes = [30, 25, 20, 15, 10]
labels = ['Category 1', 'Category 2', 'Category 3', 'Category 4', 'Category 5']
colors = plt.cm.Pastel1(np.linspace(0, 1, len(sizes)))

fig, (ax1, ax2) = plt.subplots(1, 2, figsize=(12, 6))

# 左侧饼图:图例在右侧
wedges, texts, autotexts = ax1.pie(sizes, labels=labels, colors=colors, autopct='%1.1f%%', startangle=90)
ax1.axis('equal')
ax1.set_title('How2matplotlib.com Legend on Right')
ax1.legend(wedges, labels, title="Categories", loc="center left", bbox_to_anchor=(1, 0, 0.5, 1))

# 右侧饼图:图例在下方
wedges, texts, autotexts = ax2.pie(sizes, colors=colors, autopct='%1.1f%%', startangle=90)
ax2.axis('equal')
ax2.set_title('How2matplotlib.com Legend on Bottom')
ax2.legend(wedges, labels, title="Categories", loc="upper center", bbox_to_anchor=(0.5, -0.1), ncol=3)

plt.tight_layout()
plt.show()
这个例子创建了两个饼图,一个的图例在右侧,另一个的图例在底部。通过调整loc和bbox_to_anchor参数,我们可以精确控制图例的位置。
9. 图例与数据交互
有时,我们可能希望图例能够与数据交互。以下是一个例子,展示如何创建一个可以通过点击图例来切换饼图扇区可见性的交互式图表:
import matplotlib.pyplot as plt

sizes = [30, 25, 20, 15, 10]
labels = ['A', 'B', 'C', 'D', 'E']
colors = plt.cm.Set3(np.linspace(0, 1, len(sizes)))

fig, ax = plt.subplots()
wedges, texts, autotexts = ax.pie(sizes, labels=labels, colors=colors, autopct='%1.1f%%', startangle=90)

ax.axis('equal')
plt.title('How2matplotlib.com Interactive Legend')

# 创建可交互的图例
leg = ax.legend(wedges, labels, title="Categories", loc="center left", bbox_to_anchor=(1, 0, 0.5, 1))

# 定义点击事件处理函数
def on_click(event):
    if event.inaxes == leg.axes:
        for i, legline in enumerate(leg.get_lines()):
            if legline.contains(event)[0]:
                wedges[i].set_visible(not wedges[i].get_visible())
                autotexts[i].set_visible(not autotexts[i].get_visible())
                legline.set_alpha(1.0 if wedges[i].get_visible() else 0.2)
                fig.canvas.draw()

# 连接点击事件
fig.canvas.mpl_connect('button_press_event', on_click)

plt.tight_layout()
plt.show()
这个例子创建了一个交互式饼图,用户可以通过点击图例来切换各个扇区的可见性。这种交互性可以帮助用户更好地探索数据。
10. 自定义图例标记
除了使用默认的图例标记,我们还可以创建自定义的图例标记。以下是一个使用自定义标记的例子:
import matplotlib.pyplot as plt
from matplotlib.patches import Rectangle

sizes = [35, 30, 20, 15]
labels = ['Product A', 'Product B', 'Product C', 'Product D']
colors = ['#ff9999', '#66b3ff', '#99ff99', '#ffcc99']

fig, ax = plt.subplots()
wedges, texts, autotexts = ax.pie(sizes, labels=labels, colors=colors, autopct='%1.1f%%', startangle=90)

ax.axis('equal')
plt.title('How2matplotlib.com Custom Legend Markers')

# 创建自定义图例标记
legend_elements = [Rectangle((0, 0), 1, 1, facecolor=color, edgecolor='black') for color in colors]
legend = ax.legend(legend_elements, labels, title="Products", loc="center left", bbox_to_anchor=(1, 0, 0.5, 1))

# 自定义图例样式
legend.get_frame().set_facecolor('#f0f0f0')
legend.get_frame().set_edgecolor('black')
plt.setp(legend.get_texts(), fontweight='bold')

plt.tight_layout()
plt.show()
Output:
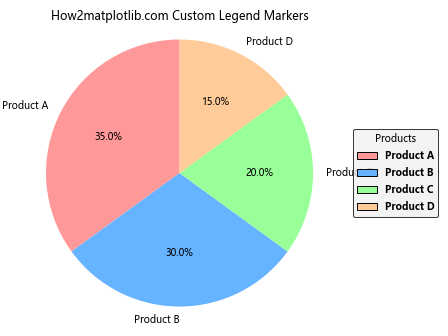
在这个例子中,我们使用Rectangle对象作为自定义的图例标记,创造了一个独特的图例样式。
11. 多列图例
当有大量类别时,单列图例可能会变得过长。在这种情况下,使用多列图例可能更合适:
import matplotlib.pyplot as plt

sizes = [10, 9, 8, 7, 6, 5, 4, 3, 2, 1]
labels = ['A', 'B', 'C', 'D', 'E', 'F', 'G', 'H', 'I', 'J']
colors = plt.cm.tab20(np.linspace(0, 1, len(sizes)))

fig, ax = plt.subplots(figsize=(10, 6))
wedges, texts, autotexts = ax.pie(sizes, colors=colors, autopct='%1.1f%%', startangle=90)

ax.axis('equal')
plt.title('How2matplotlib.com Multi-column Legend')

# 创建多列图例
legend = ax.legend(wedges, labels, title="Categories", loc="center left", bbox_to_anchor=(1, 0, 0.5, 1), ncol=2)

plt.tight_layout()
plt.show()
这个例子创建了一个双列图例,通过设置ncol=2参数来实现。这种布局在处理大量类别时特别有用。
12. 图例中添加额外信息
有时,我们可能希望在图例中包含比简单标签更多的信息。以下是一个在图例中添加额外数据的例子:
import matplotlib.pyplot as plt

sizes = [30, 25, 20, 15, 10]
labels = ['Apple', 'Banana', 'Cherry', 'Date', 'Elderberry']
values = [100, 85, 70, 50, 30]
colors = plt.cm.Pastel1(np.linspace(0, 1, len(sizes)))

fig, ax = plt.subplots()
wedges, texts, autotexts = ax.pie(sizes, labels=labels, colors=colors, autopct='%1.1f%%', startangle=90)

ax.axis('equal')
plt.title('How2matplotlib.com Legend with Extra Information')

# 创建包含额外信息的图例
legend_labels = [f'{label} ({size}%, ${value})' for label, size, value in zip(labels, sizes, values)]
legend = ax.legend(wedges, legend_labels, title="Fruit Sales", loc="center left", bbox_to_anchor=(1, 0, 0.5, 1))

plt.tight_layout()
plt.show()
在这个例子中,图例不仅显示了类别名称,还包括了每个类别的百分比和一个额外的数值(如销售额)。
13. 图例标题样式
图例的标题也可以进行自定义,以突出其重要性或与整体设计保持一致:
import matplotlib.pyplot as plt

sizes = [35, 30, 20, 15]
labels = ['Category A', 'Category B', 'Category C', 'Category D']
colors = ['#ff9999', '#66b3ff', '#99ff99', '#ffcc99']

fig, ax = plt.subplots()
wedges, texts, autotexts = ax.pie(sizes, labels=labels, colors=colors, autopct='%1.1f%%', startangle=90)

ax.axis('equal')
plt.title('How2matplotlib.com Custom Legend Title Style')

legend = ax.legend(wedges, labels, title="Data Categories", loc="center left", bbox_to_anchor=(1, 0, 0.5, 1))

# 自定义图例标题样式
title = legend.get_title()
title.set_fontsize(14)
title.set_fontweight('bold')
title.set_color('navy')

plt.tight_layout()
plt.show()
Output:
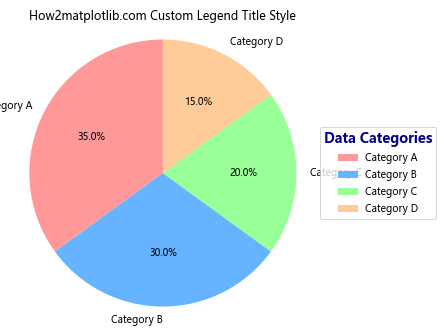
这个例子展示了如何自定义图例标题的字体大小、粗细和颜色,使其更加突出。
14. 图例框样式
图例框的样式也可以进行自定义,以增强整体视觉效果:
import matplotlib.pyplot as plt

sizes = [30, 25, 20, 15, 10]
labels = ['A', 'B', 'C', 'D', 'E']
colors = plt.cm.Set2(np.linspace(0, 1, len(sizes)))

fig, ax = plt.subplots()
wedges, texts, autotexts = ax.pie(sizes, labels=labels, colors=colors, autopct='%1.1f%%', startangle=90)

ax.axis('equal')
plt.title('How2matplotlib.com Custom Legend Box Style')

legend = ax.legend(wedges, labels, title="Categories", loc="center left", bbox_to_anchor=(1, 0, 0.5, 1))

# 自定义图例框样式
frame = legend.get_frame()
frame.set_facecolor('#e0e0e0')
frame.set_edgecolor('navy')
frame.set_linewidth(2)
frame.set_boxstyle("round,pad=0.5")

plt.tight_layout()
plt.show()
这个例子展示了如何自定义图例框的背景色、边框颜色、线宽和形状,创造出一个独特的外观。
15. 图例中的分隔线
在某些情况下,我们可能希望在图例中添加分隔线来组织不同的类别:
import matplotlib.pyplot as plt
from matplotlib.patches import Patch

sizes = [20, 15, 10, 25, 20, 10]
labels = ['A1', 'A2', 'A3', 'B1', 'B2', 'B3']
colors = plt.cm.Paired(np.linspace(0, 1, len(sizes)))

fig, ax = plt.subplots()
wedges, texts, autotexts = ax.pie(sizes, labels=labels, colors=colors, autopct='%1.1f%%', startangle=90)

ax.axis('equal')
plt.title('How2matplotlib.com Legend with Separators')

# 创建带分隔线的图例
legend_elements = [Patch(facecolor=color, edgecolor='black', label=label) for color, label in zip(colors, labels)]
legend_elements.insert(3, Patch(facecolor='none', edgecolor='none', label=''))  # 添加空白行作为分隔符
legend = ax.legend(handles=legend_elements, title="Categories", loc="center left", bbox_to_anchor=(1, 0, 0.5, 1))

plt.tight_layout()
plt.show()
这个例子在图例中的两组类别之间添加了一个空白行,作为视觉分隔符。
结论
通过本文,我们详细探讨了如何使用Matplotlib创建饼图并自定义其图例。从基础的饼图创建到高级的图例定制,我们涵盖了多个方面,包括图例位置调整、样式定制、交互性添加等。这些技巧和方法可以帮助你创建更加信息丰富、视觉吸引力强的饼图,更好地展示和解释你的数据。
记住,图例不仅仅是标签的集合,它是连接数据和观众的桥梁。通过精心设计的图例,你可以大大提高饼图的可读性和信息传递效率。在实际应用中,根据具体的数据特点和展示需求,灵活运用这些技巧,创造出最适合你的数据可视化效果。
最后,持续练习和实验是掌握这些技巧的关键。尝试将这些方法应用到你自己的数据集中,探索更多的可能性,你会发现Matplotlib在数据可视化方面的强大潜力。
 极客笔记
极客笔记