Matplotlib移动图例
介绍
Matplotlib是一个用于创建图表和可视化数据的Python库。在使用Matplotlib创建图表时,图例是一个很重要的部分,用来解释图表中不同元素的含义。有时候,默认的图例位置不够理想,需要将图例移动到更合适的位置。本文将介绍如何使用Matplotlib移动图例。
移动图例到指定位置
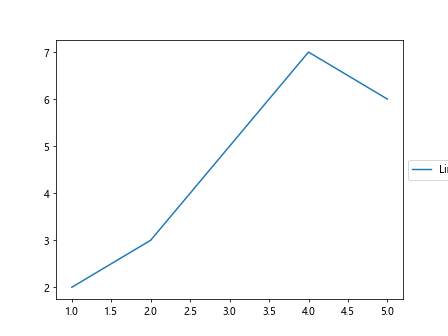
在Matplotlib中,可以使用bbox_to_anchor参数来控制图例的位置。这个参数表示图例的起始位置。下面是一个示例代码:
import matplotlib.pyplot as plt

x = [1, 2, 3, 4, 5]
y = [2, 3, 5, 7, 6]

plt.plot(x, y, label='Line')
plt.legend(loc='center left', bbox_to_anchor=(1, 0.5))
plt.show()
Output:

在这个示例中,图例被移动到了图表的右侧中间位置。参数(1, 0.5)表示图例的起始位置在右上角。
移动图例到指定坐标
除了通过bbox_to_anchor参数来移动图例,还可以直接指定图例的坐标。下面是一个示例代码:
import matplotlib.pyplot as plt

x = [1, 2, 3, 4, 5]
y = [2, 3, 5, 7, 6]

plt.plot(x, y, label='Line')
plt.legend(loc='center left')
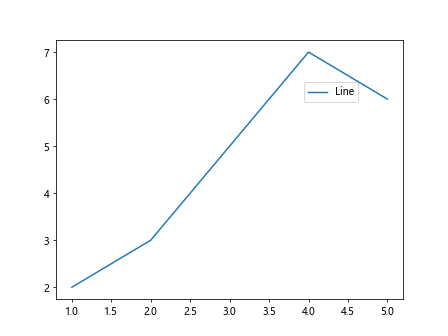
plt.gca().get_legend().set_bbox_to_anchor((0.7, 0.8))
plt.show()
Output:

在这个示例中,图例被移动到了坐标(0.7, 0.8)的位置。使用get_legend()方法获取图例对象,然后调用set_bbox_to_anchor()方法设置图例的坐标。
自定义图例边界框
除了移动图例的位置,还可以通过自定义图例边界框的方式来调整图例的位置。下面是一个示例代码:
import matplotlib.pyplot as plt

x = [1, 2, 3, 4, 5]
y = [2, 3, 5, 7, 6]

plt.plot(x, y, label='Line')
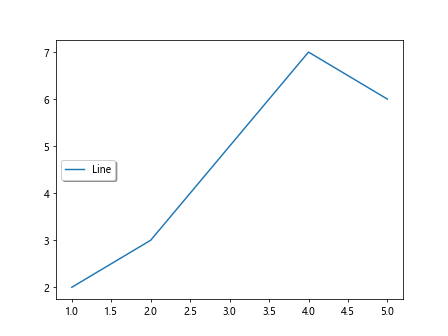
plt.legend(loc='center left', fancybox=True, shadow=True)
plt.show()
Output:

在这个示例中,将图例边界框设置为fancybox模式,并显示阴影,使得图例更加突出。
移动图例到不同子图
如果在一个包含多个子图的图表中,需要将图例移动到不同的子图,可以通过matplotlib.offsetbox模块来实现。下面是一个示例代码:
import matplotlib.pyplot as plt
from matplotlib.offsetbox import AnchoredText

fig, axs = plt.subplots(2)

x = [1, 2, 3, 4, 5]
y1 = [2, 3, 5, 7, 6]
y2 = [3, 4, 6, 8, 7]

axs[0].plot(x, y1, label='Line 1')
axs[1].plot(x, y2, label='Line 2')

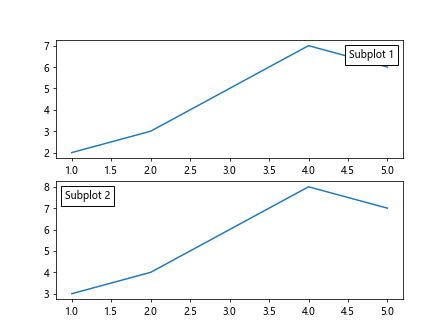
at = AnchoredText("Subplot 1", loc='upper right')
axs[0].add_artist(at)

at = AnchoredText("Subplot 2", loc='upper left')
axs[1].add_artist(at)

plt.show()
Output:

在这个示例中,将图例放置在不同的子图中,通过AnchoredText类来实现。
移动图例在3D图中
在3D图表中,移动图例的方法与2D图表有些差异。下面是一个示例代码:
import numpy as np
import matplotlib.pyplot as plt
from mpl_toolkits.mplot3d import Axes3D

x = np.linspace(-5, 5, 100)
y = np.linspace(-5, 5, 100)
X, Y = np.meshgrid(x, y)
Z = np.sin(np.sqrt(X**2 + Y**2))

fig = plt.figure()
ax = fig.add_subplot(111, projection='3d')

surf = ax.plot_surface(X, Y, Z, cmap='viridis')
fig.colorbar(surf, ax=ax, shrink=0.5, aspect=5)

ax.legend(loc='center right', bbox_to_anchor=(0, 0.5))
plt.show()
在这个示例中,将图例移动到了3D图表的右侧中间位置。
结语
通过本文的介绍,我们学习了如何在Matplotlib中移动图例,包括移动到指定位置、指定坐标、自定义边界框、不同子图以及3D图表中。移动图例可以使得图表更加清晰,更加易于理解。
 极客笔记
极客笔记