matplotlib markersize
在matplotlib中,markersize是指定散点图中散点的大小的参数。通过调整markersize的数值,可以控制散点的大小,从而使数据更加直观地展示在图中。
1. 设置markersize为默认值
import matplotlib.pyplot as plt

x = [1, 2, 3, 4, 5]
y = [2, 3, 4, 5, 6]

plt.scatter(x, y, markersize=20)

plt.show()
2. 调整markersize为较大值
import matplotlib.pyplot as plt

x = [1, 2, 3, 4, 5]
y = [2, 3, 4, 5, 6]

plt.scatter(x, y, markersize=50)

plt.show()
3. 调整markersize为较小值
import matplotlib.pyplot as plt

x = [1, 2, 3, 4, 5]
y = [2, 3, 4, 5, 6]

plt.scatter(x, y, markersize=5)

plt.show()
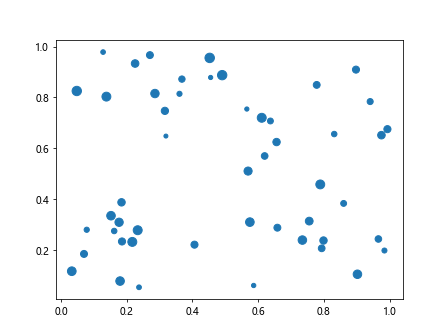
4. 根据数据设置markersize
import matplotlib.pyplot as plt
import numpy as np

x = np.random.rand(50)
y = np.random.rand(50)
sizes = np.random.randint(10, 100, 50)

plt.scatter(x, y, s=sizes)

plt.show()
Output:
5. 使用字符串变量设置markersize
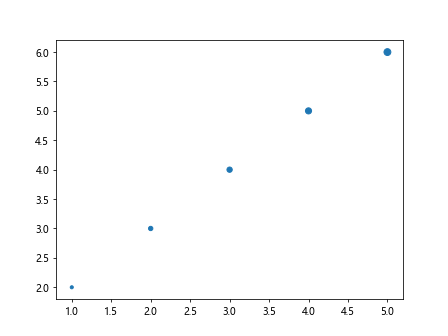
import matplotlib.pyplot as plt

x = [1, 2, 3, 4, 5]
y = [2, 3, 4, 5, 6]
sizes = ['small', 'medium', 'large', 'x-large', 'xx-large']

size_mapping = {
    'small': 10,
    'medium': 20,
    'large': 30,
    'x-large': 40,
    'xx-large': 50
}

sizes_in_pixels = [size_mapping[size] for size in sizes]

plt.scatter(x, y, s=sizes_in_pixels)

plt.show()
Output:
6. 使用变量数组设置markersize
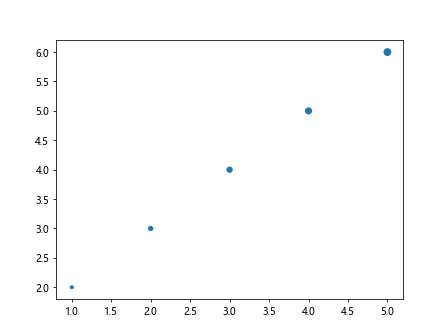
import matplotlib.pyplot as plt

x = [1, 2, 3, 4, 5]
y = [2, 3, 4, 5, 6]
sizes = [10, 20, 30, 40, 50]

plt.scatter(x, y, s=sizes)

plt.show()
Output:
7. 设置markersize为正态分布随机数
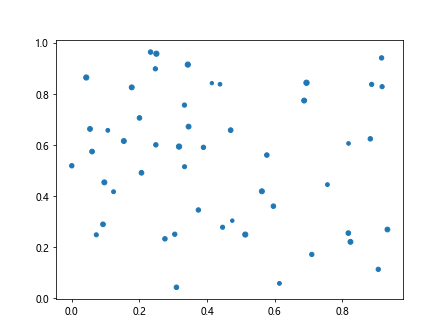
import matplotlib.pyplot as plt
import numpy as np

x = np.random.rand(50)
y = np.random.rand(50)
sizes = np.random.normal(20, 5, 50)

plt.scatter(x, y, s=sizes)

plt.show()
Output:
8. 设置markersize为两个不同的数组
import matplotlib.pyplot as plt
import numpy as np

x = np.random.rand(50)
y = np.random.rand(50)
sizes1 = np.random.randint(10, 30, 50)
sizes2 = np.random.randint(30, 50, 50)

plt.scatter(x[:25], y[:25], s=sizes1)
plt.scatter(x[25:], y[25:], s=sizes2)

plt.show()
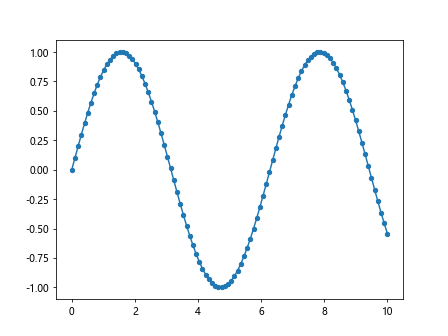
9. 使用markersize参数绘制散点图和线图
import matplotlib.pyplot as plt
import numpy as np

x = np.linspace(0, 10, 100)
y = np.sin(x)

plt.scatter(x, y, s=20)
plt.plot(x, y)

plt.show()
Output:
10. 结合markersize和颜色设置
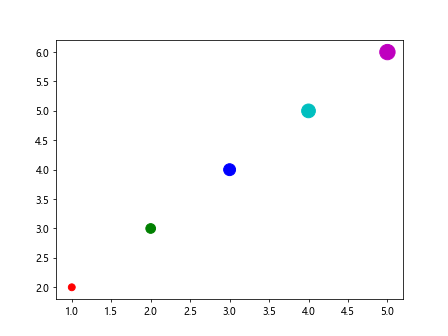
import matplotlib.pyplot as plt

x = [1, 2, 3, 4, 5]
y = [2, 3, 4, 5, 6]
sizes = [50, 100, 150, 200, 250]
colors = ['r', 'g', 'b', 'c', 'm']

plt.scatter(x, y, s=sizes, c=colors)

plt.show()
Output:
通过以上示例代码,可以发现在matplotlib中可以通过设置markersize参数来控制散点图中散点的大小,从而使数据更加清晰地展示在图中。
 极客笔记
极客笔记