Matplotlib 图例(Legend)详解:如何创建、自定义和优化
Matplotlib 是 Python 中最流行的数据可视化库之一,而图例(Legend)是数据可视化中不可或缺的组成部分。本文将深入探讨 Matplotlib 中图例的各个方面,包括创建基本图例、自定义图例样式、调整图例位置、处理多列图例等高级主题。通过本文,您将全面掌握 Matplotlib 图例的使用技巧,让您的数据可视化作品更加专业和易于理解。
1. 创建基本图例
在 Matplotlib 中创建图例是一个简单的过程。通常,我们只需要在绘制图形时为每个数据系列指定一个标签,然后调用 plt.legend() 或 ax.legend() 方法即可。
以下是一个创建基本图例的示例:
import matplotlib.pyplot as plt
import numpy as np

x = np.linspace(0, 10, 100)
y1 = np.sin(x)
y2 = np.cos(x)

plt.figure(figsize=(10, 6))
plt.plot(x, y1, label='Sin(x) - how2matplotlib.com')
plt.plot(x, y2, label='Cos(x) - how2matplotlib.com')
plt.legend()
plt.title('Basic Legend Example')
plt.xlabel('X-axis')
plt.ylabel('Y-axis')
plt.show()
Output:
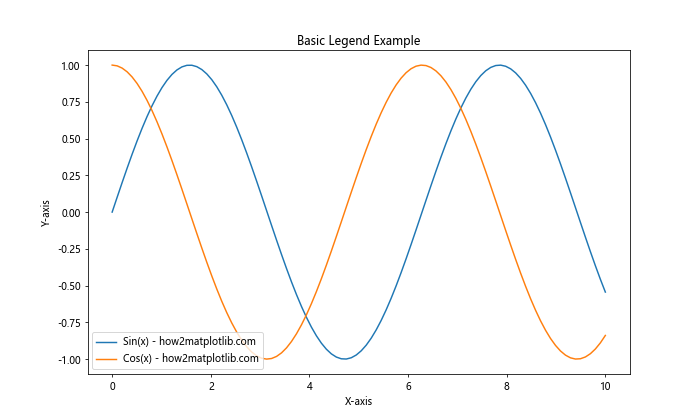
在这个示例中,我们绘制了正弦和余弦函数的图形。通过在 plt.plot() 函数中使用 label 参数为每条线指定标签,然后调用 plt.legend() 方法,Matplotlib 会自动创建一个包含这些标签的图例。
2. 自定义图例位置
默认情况下,Matplotlib 会尝试将图例放置在不会遮挡主要数据的位置。但有时我们可能想要更精确地控制图例的位置。我们可以使用 loc 参数来指定图例的位置。
以下是一个自定义图例位置的示例:
import matplotlib.pyplot as plt
import numpy as np

x = np.linspace(0, 10, 100)
y1 = np.sin(x)
y2 = np.cos(x)

plt.figure(figsize=(10, 6))
plt.plot(x, y1, label='Sin(x) - how2matplotlib.com')
plt.plot(x, y2, label='Cos(x) - how2matplotlib.com')
plt.legend(loc='lower left')
plt.title('Custom Legend Location')
plt.xlabel('X-axis')
plt.ylabel('Y-axis')
plt.show()
Output:
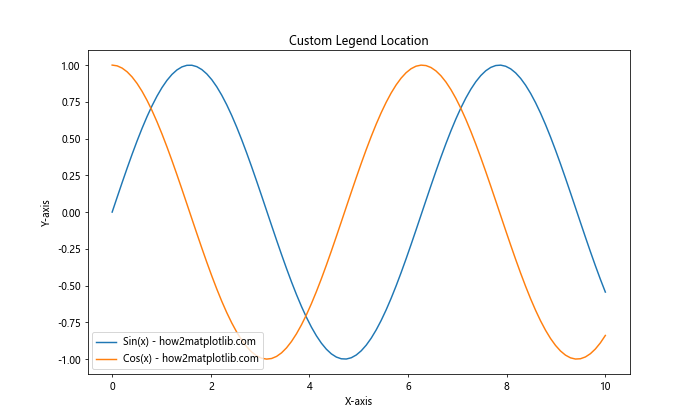
在这个示例中,我们使用 loc='lower left' 将图例放置在左下角。loc 参数可以接受多种值,如 ‘upper right’、’center’、’best’ 等。
3. 图例样式自定义
Matplotlib 提供了多种方式来自定义图例的样式,包括更改字体大小、颜色、边框样式等。
以下是一个自定义图例样式的示例:
import matplotlib.pyplot as plt
import numpy as np

x = np.linspace(0, 10, 100)
y1 = np.sin(x)
y2 = np.cos(x)

plt.figure(figsize=(10, 6))
plt.plot(x, y1, label='Sin(x) - how2matplotlib.com')
plt.plot(x, y2, label='Cos(x) - how2matplotlib.com')
plt.legend(fontsize=12, frameon=True, facecolor='lightgray', edgecolor='black')
plt.title('Customized Legend Style')
plt.xlabel('X-axis')
plt.ylabel('Y-axis')
plt.show()
Output:
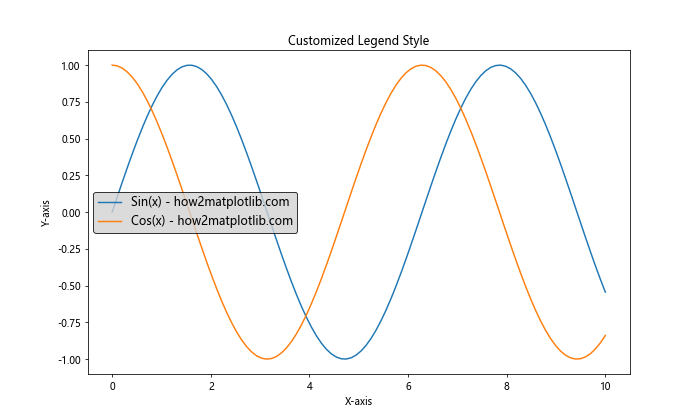
在这个示例中,我们设置了图例的字体大小(fontsize),添加了边框(frameon=True),设置了背景色(facecolor)和边框颜色(edgecolor)。
4. 多列图例
当图例项目较多时,单列图例可能会占用过多的图表空间。在这种情况下,我们可以使用多列图例来优化布局。
以下是创建多列图例的示例:
import matplotlib.pyplot as plt
import numpy as np

x = np.linspace(0, 10, 100)
plt.figure(figsize=(12, 6))

for i in range(5):
    plt.plot(x, np.sin(x + i), label=f'Sin(x + {i}) - how2matplotlib.com')

plt.legend(ncol=3, loc='upper center', bbox_to_anchor=(0.5, -0.05))
plt.title('Multi-column Legend')
plt.xlabel('X-axis')
plt.ylabel('Y-axis')
plt.tight_layout()
plt.show()
Output:
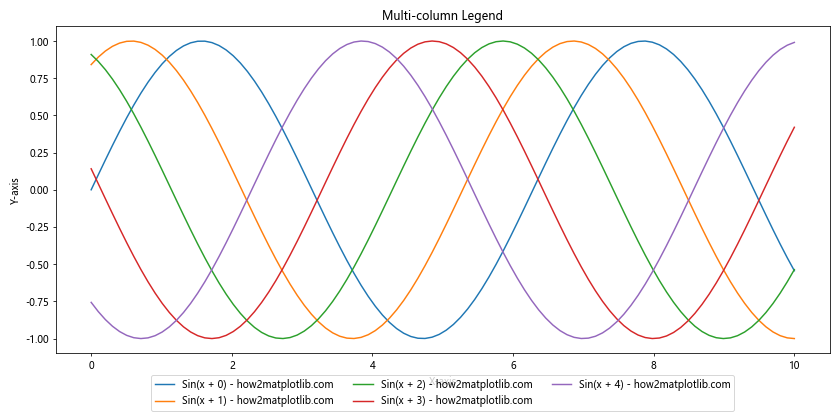
在这个示例中,我们使用 ncol 参数指定图例的列数,bbox_to_anchor 参数用于精确定位图例的位置。
5. 图例中添加自定义元素
有时,我们可能需要在图例中添加一些自定义元素,比如特殊的标记或者文本说明。Matplotlib 允许我们通过 plt.legend() 方法的 handles 和 labels 参数来实现这一点。
以下是一个在图例中添加自定义元素的示例:
import matplotlib.pyplot as plt
import numpy as np
from matplotlib.lines import Line2D

x = np.linspace(0, 10, 100)
y1 = np.sin(x)
y2 = np.cos(x)

fig, ax = plt.subplots(figsize=(10, 6))
ax.plot(x, y1)
ax.plot(x, y2)

custom_lines = [Line2D([0], [0], color='blue', lw=2),
                Line2D([0], [0], color='orange', lw=2),
                Line2D([0], [0], marker='o', color='green', lw=0)]

ax.legend(custom_lines, ['Sin(x) - how2matplotlib.com',
                         'Cos(x) - how2matplotlib.com',
                         'Special Point - how2matplotlib.com'])
plt.title('Legend with Custom Elements')
plt.xlabel('X-axis')
plt.ylabel('Y-axis')
plt.show()
Output:
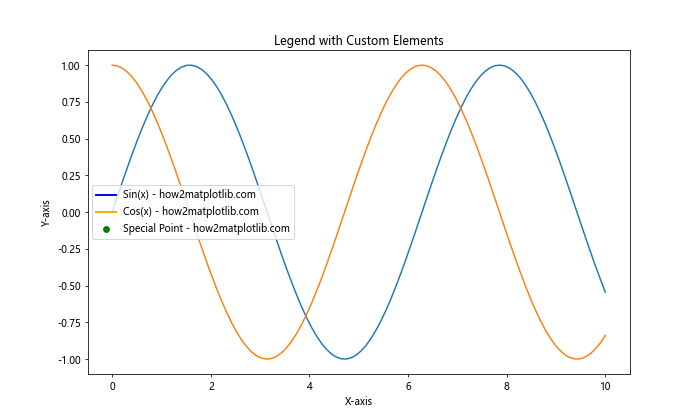
在这个示例中,我们创建了自定义的 Line2D 对象来表示不同的图例元素,包括两条线和一个特殊点。然后,我们使用这些自定义元素和相应的标签创建图例。
6. 图例框架样式
Matplotlib 提供了多种图例框架样式,可以通过 fancybox、shadow 等参数来调整。
以下是一个自定义图例框架样式的示例:
import matplotlib.pyplot as plt
import numpy as np

x = np.linspace(0, 10, 100)
y1 = np.sin(x)
y2 = np.cos(x)

plt.figure(figsize=(10, 6))
plt.plot(x, y1, label='Sin(x) - how2matplotlib.com')
plt.plot(x, y2, label='Cos(x) - how2matplotlib.com')
plt.legend(fancybox=True, shadow=True, framealpha=0.7)
plt.title('Legend with Fancy Box and Shadow')
plt.xlabel('X-axis')
plt.ylabel('Y-axis')
plt.show()
Output:
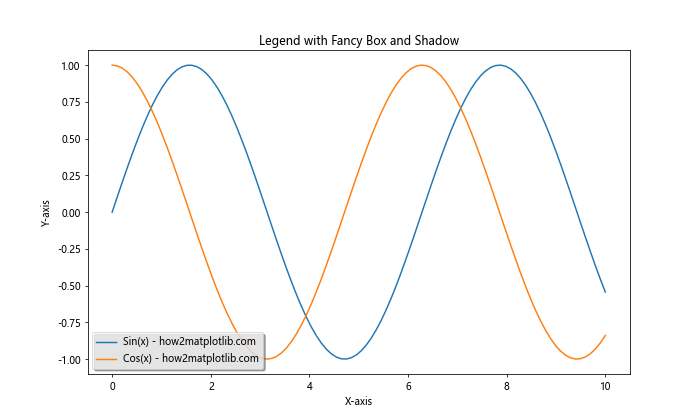
在这个示例中,我们使用 fancybox=True 创建了圆角边框,shadow=True 添加了阴影效果,framealpha=0.7 设置了框架的透明度。
7. 图例中的标记大小
当图例中包含点或标记时,有时需要调整这些标记的大小以提高可读性。我们可以使用 markerscale 参数来实现这一点。
以下是调整图例中标记大小的示例:
import matplotlib.pyplot as plt
import numpy as np

x = np.linspace(0, 10, 20)
y1 = np.sin(x)
y2 = np.cos(x)

plt.figure(figsize=(10, 6))
plt.plot(x, y1, 'o-', label='Sin(x) - how2matplotlib.com')
plt.plot(x, y2, 's-', label='Cos(x) - how2matplotlib.com')
plt.legend(markerscale=2)
plt.title('Legend with Larger Markers')
plt.xlabel('X-axis')
plt.ylabel('Y-axis')
plt.show()
Output:

在这个示例中,markerscale=2 使图例中的标记大小变为原来的两倍,使其更加醒目。
8. 图例中的行间距
当图例包含多个项目时,调整行间距可以提高可读性。我们可以使用 labelspacing 参数来控制图例项目之间的垂直间距。
以下是调整图例行间距的示例:
import matplotlib.pyplot as plt
import numpy as np

x = np.linspace(0, 10, 100)
plt.figure(figsize=(10, 6))

for i in range(5):
    plt.plot(x, np.sin(x + i), label=f'Sin(x + {i}) - how2matplotlib.com')

plt.legend(labelspacing=1.5)
plt.title('Legend with Increased Label Spacing')
plt.xlabel('X-axis')
plt.ylabel('Y-axis')
plt.show()
Output:
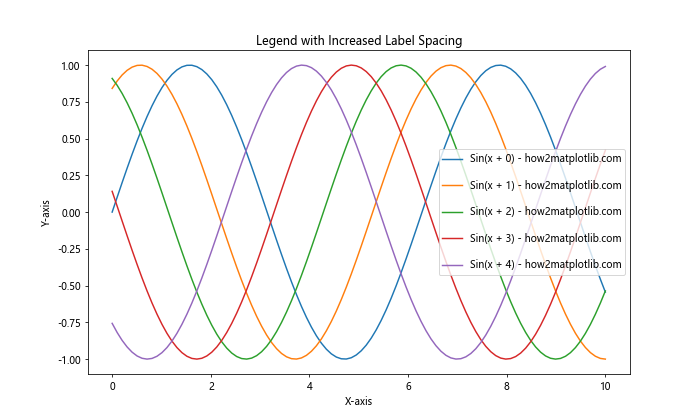
在这个示例中,labelspacing=1.5 增加了图例项目之间的垂直间距,使其更加易读。
9. 图例标题
有时,我们可能想要为图例添加一个标题,以提供更多上下文信息。Matplotlib 允许我们使用 title 参数来实现这一点。
以下是为图例添加标题的示例:
import matplotlib.pyplot as plt
import numpy as np

x = np.linspace(0, 10, 100)
y1 = np.sin(x)
y2 = np.cos(x)

plt.figure(figsize=(10, 6))
plt.plot(x, y1, label='Sin(x) - how2matplotlib.com')
plt.plot(x, y2, label='Cos(x) - how2matplotlib.com')
plt.legend(title='Trigonometric Functions')
plt.title('Legend with Title')
plt.xlabel('X-axis')
plt.ylabel('Y-axis')
plt.show()
Output:

在这个示例中,我们使用 title 参数为图例添加了一个标题 “Trigonometric Functions”。
10. 图例中的数学公式
Matplotlib 支持在图例中使用 LaTeX 格式的数学公式,这对于科学和工程可视化非常有用。
以下是在图例中使用数学公式的示例:
import matplotlib.pyplot as plt
import numpy as np

x = np.linspace(0, 10, 100)
y1 = np.sin(x)
y2 = np.cos(x)

plt.figure(figsize=(10, 6))
plt.plot(x, y1, label=r'\sin(x) - how2matplotlib.com')
plt.plot(x, y2, label=r'\cos(x) - how2matplotlib.com')
plt.legend()
plt.title('Legend with Math Formulas')
plt.xlabel('X-axis')
plt.ylabel('Y-axis')
plt.show()
Output:
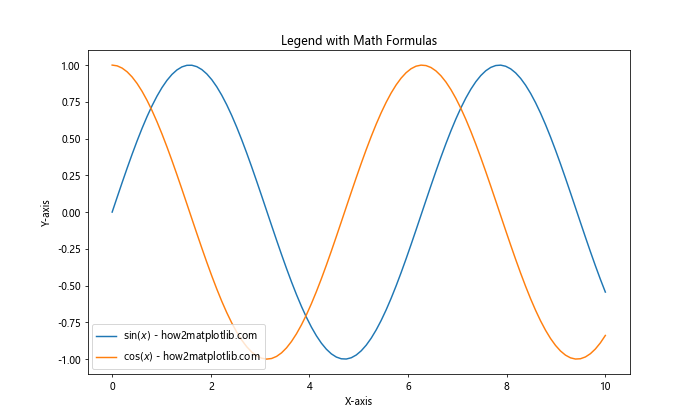
在这个示例中,我们使用 LaTeX 格式($\sin(x)$ 和 $\cos(x)$)来表示数学公式。注意使用原始字符串(r'')来避免反斜杠被解释为转义字符。
11. 图例中的颜色条
在某些情况下,我们可能需要在图例中包含颜色条(colorbar)。这在表示连续数据范围时特别有用。
以下是在图例中包含颜色条的示例:
import matplotlib.pyplot as plt
import numpy as np
from matplotlib.patches import Rectangle
from matplotlib.collections import PatchCollection

fig, ax = plt.subplots(figsize=(10, 6))

# 创建一些随机数据
np.random.seed(42)
x = np.random.rand(50)
y = np.random.rand(50)
colors = np.random.rand(50)

# 绘制散点图
scatter = ax.scatter(x, y, c=colors, cmap='viridis')

# 创建颜色条图例
cmap = plt.get_cmap('viridis')
colors = cmap(np.linspace(0, 1, 5))
patches = [Rectangle((0, 0), 1, 1) for _ in range(5)]
collection = PatchCollection(patches, cmap=cmap)
collection.set_array(np.linspace(0, 1, 5))

# 添加图例
legend = ax.legend(handles=collection.get_children(),
                   labels=['0.0', '0.25', '0.5', '0.75', '1.0'],
                   title='Color Scale - how2matplotlib.com',
                   loc='center left', bbox_to_anchor=(1, 0.5))

# 设置图例中矩形的颜色
for patch, color in zip(legend.get_patches(), colors):
    patch.set_facecolor(color)

plt.colorbar(scatter)
plt.title('Scatter Plot with Color Legend')
plt.tight_layout()
plt.show()
在这个示例中,我们创建了一个散点图,其中点的颜色表示一个连续的数据范围。然后,我们在图例中创建了一个自定义的颜色条,显示了颜色所代表的数值范围。
12. 图例中的透明度
有时,我们可能需要调整图例中元素的透明度,以便更好地与背景融合或突出某些元素。
以下是调整图例透明度的示例:
import matplotlib.pyplot as plt
import numpy as np

x = np.linspace(0, 10, 100)
y1 = np.sin(x)
y2 = np.cos(x)

plt.figure(figsize=(10, 6))
plt.plot(x, y1, label='Sin(x) - how2matplotlib.com', alpha=0.5)
plt.plot(x, y2, label='Cos(x) - how2matplotlib.com', alpha=0.5)
plt.legend(framealpha=0.5)
plt.title('Legend with Transparency')
plt.xlabel('X-axis')
plt.ylabel('Y-axis')
plt.show()
Output:
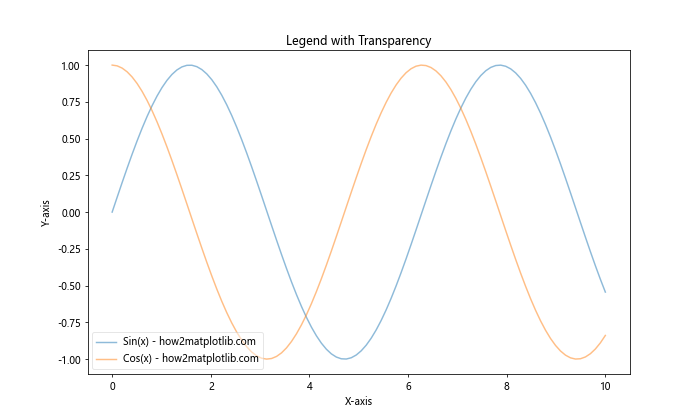
在这个示例中,我们使用 alpha=0.5 设置了线条的透明度,同时使用 framealpha=0.5 设置了图例框架的透明度。这样可以让图例更好地融入背景中。
13. 图例中的线条样式
当图表中包含多条线时,我们可能希望在图例中显示不同的线条样式。Matplotlib 允许我们自定义图例中的线条样式。
以下是自定义图例中线条样式的示例:
import matplotlib.pyplot as plt
import numpy as np

x = np.linspace(0, 10, 100)
y1 = np.sin(x)
y2 = np.cos(x)
y3 = np.tan(x)

plt.figure(figsize=(10, 6))
plt.plot(x, y1, '--', label='Sin(x) - how2matplotlib.com')
plt.plot(x, y2, '-.', label='Cos(x) - how2matplotlib.com')
plt.plot(x, y3, ':', label='Tan(x) - how2matplotlib.com')
plt.legend()
plt.title('Legend with Different Line Styles')
plt.xlabel('X-axis')
plt.ylabel('Y-axis')
plt.ylim(-2, 2)  # 限制 y 轴范围以便更好地显示
plt.show()
Output:
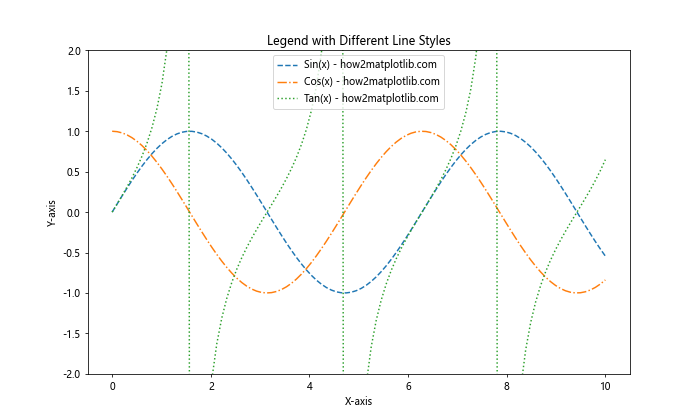
在这个示例中,我们使用了不同的线条样式('--' 表示虚线,'-.' 表示点划线,':' 表示点线)来绘制不同的函数。这些不同的线条样式会自动反映在图例中。
14. 图例中的标记
除了线条样式,我们还可以在图例中显示不同的标记。这在绘制散点图或者需要强调数据点时特别有用。
以下是在图例中使用不同标记的示例:
import matplotlib.pyplot as plt
import numpy as np

x = np.linspace(0, 10, 10)
y1 = np.sin(x)
y2 = np.cos(x)
y3 = np.tan(x)

plt.figure(figsize=(10, 6))
plt.plot(x, y1, 'o-', label='Sin(x) - how2matplotlib.com')
plt.plot(x, y2, 's-', label='Cos(x) - how2matplotlib.com')
plt.plot(x, y3, '^-', label='Tan(x) - how2matplotlib.com')
plt.legend()
plt.title('Legend with Different Markers')
plt.xlabel('X-axis')
plt.ylabel('Y-axis')
plt.ylim(-2, 2)  # 限制 y 轴范围以便更好地显示
plt.show()
Output:
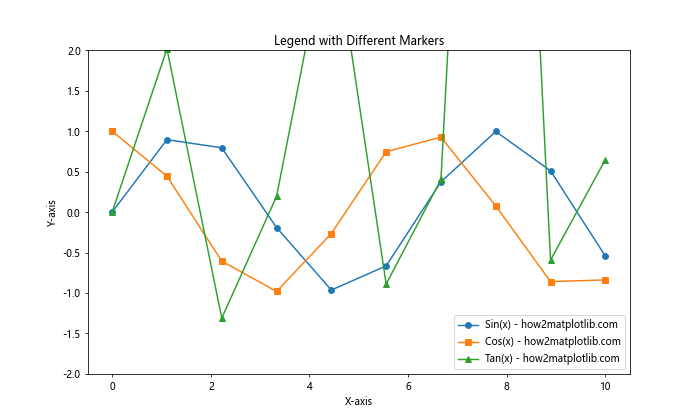
在这个示例中,我们使用了不同的标记('o' 表示圆点,'s' 表示正方形,'^' 表示三角形)来绘制不同的函数。这些不同的标记会自动反映在图例中。
15. 图例的拖动功能
在某些情况下,我们可能希望用户能够交互式地移动图例的位置。Matplotlib 提供了一个简单的方法来实现这一功能。
以下是启用图例拖动功能的示例:
import matplotlib.pyplot as plt
import numpy as np

x = np.linspace(0, 10, 100)
y1 = np.sin(x)
y2 = np.cos(x)

fig, ax = plt.subplots(figsize=(10, 6))
ax.plot(x, y1, label='Sin(x) - how2matplotlib.com')
ax.plot(x, y2, label='Cos(x) - how2matplotlib.com')
legend = ax.legend()
legend.set_draggable(True)
plt.title('Draggable Legend')
plt.xlabel('X-axis')
plt.ylabel('Y-axis')
plt.show()
Output:
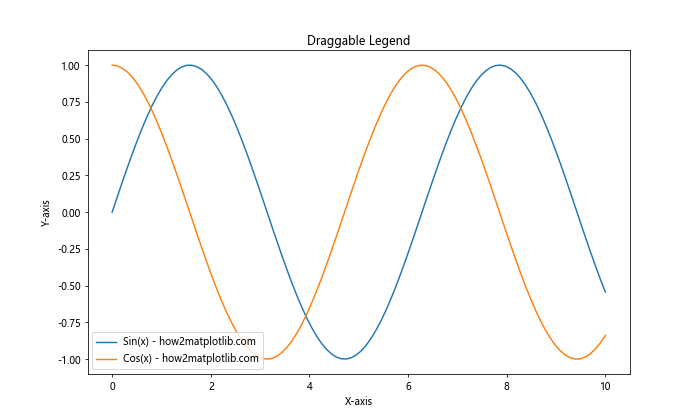
在这个示例中,我们使用 legend.set_draggable(True) 来启用图例的拖动功能。运行这段代码后,用户可以在图表中自由拖动图例到任何位置。
16. 图例中的图像
在某些特殊情况下,我们可能需要在图例中包含小图像或图标。虽然这不是一个常见的需求,但 Matplotlib 确实提供了这种功能。
以下是在图例中包含图像的示例:
import matplotlib.pyplot as plt
import numpy as np
from matplotlib.offsetbox import OffsetImage, AnnotationBbox

def create_icon(color):
    # 创建一个简单的彩色方块作为图标
    return np.full((20, 20, 3), color)

x = np.linspace(0, 10, 100)
y1 = np.sin(x)
y2 = np.cos(x)

fig, ax = plt.subplots(figsize=(10, 6))
ax.plot(x, y1, 'r', label='Sin(x) - how2matplotlib.com')
ax.plot(x, y2, 'b', label='Cos(x) - how2matplotlib.com')

# 创建自定义图例
red_icon = create_icon([1, 0, 0])
blue_icon = create_icon([0, 0, 1])

red_image = OffsetImage(red_icon, zoom=0.5)
blue_image = OffsetImage(blue_icon, zoom=0.5)

ab_red = AnnotationBbox(red_image, (0, 0), xycoords='data', frameon=False)
ab_blue = AnnotationBbox(blue_image, (0, 0), xycoords='data', frameon=False)

ax.add_artist(ab_red)
ax.add_artist(ab_blue)

ax.legend([ab_red, ab_blue], ['Sin(x) - how2matplotlib.com', 'Cos(x) - how2matplotlib.com'])

plt.title('Legend with Images')
plt.xlabel('X-axis')
plt.ylabel('Y-axis')
plt.show()
Output:
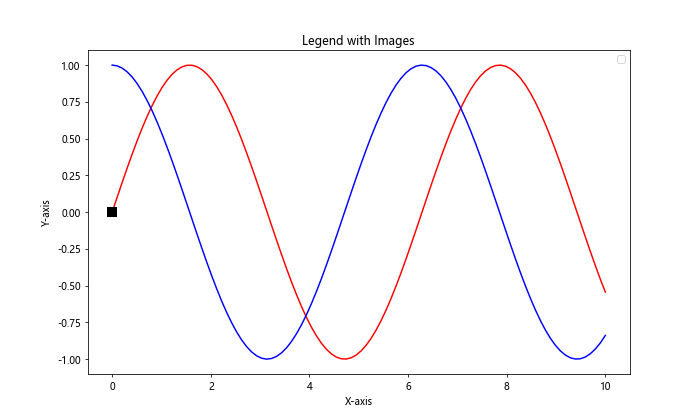
在这个示例中,我们创建了简单的彩色方块作为图标,并将它们添加到图例中。这种技术可以用来创建自定义的图例项,包括小图像或图标。
17. 图例的字体样式
有时,我们可能需要更改图例中文本的字体样式,以匹配整体设计或提高可读性。
以下是自定义图例字体样式的示例:
import matplotlib.pyplot as plt
import numpy as np

x = np.linspace(0, 10, 100)
y1 = np.sin(x)
y2 = np.cos(x)

plt.figure(figsize=(10, 6))
plt.plot(x, y1, label='Sin(x) - how2matplotlib.com')
plt.plot(x, y2, label='Cos(x) - how2matplotlib.com')
plt.legend(prop={'family': 'serif', 'weight': 'bold', 'size': 12})
plt.title('Legend with Custom Font Style')
plt.xlabel('X-axis')
plt.ylabel('Y-axis')
plt.show()
Output:
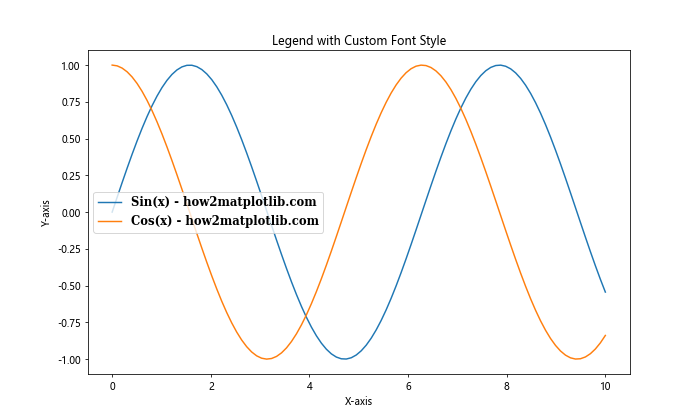
在这个示例中,我们使用 prop 参数来设置图例的字体属性。我们将字体家族设置为 serif,字重设置为粗体,大小设置为 12。
18. 多图例
在某些复杂的图表中,我们可能需要多个图例来解释不同的数据系列或特征。Matplotlib 允许我们在一个图表中添加多个图例。
以下是创建多个图例的示例:
import matplotlib.pyplot as plt
import numpy as np

x = np.linspace(0, 10, 100)
y1 = np.sin(x)
y2 = np.cos(x)
y3 = np.exp(-x/10) * np.sin(x)
y4 = np.exp(-x/10) * np.cos(x)

fig, ax = plt.subplots(figsize=(12, 6))

l1, = ax.plot(x, y1, 'r-', label='Sin(x) - how2matplotlib.com')
l2, = ax.plot(x, y2, 'b-', label='Cos(x) - how2matplotlib.com')
l3, = ax.plot(x, y3, 'g--', label='Damped Sin(x) - how2matplotlib.com')
l4, = ax.plot(x, y4, 'm--', label='Damped Cos(x) - how2matplotlib.com')

# 创建第一个图例
leg1 = ax.legend(handles=[l1, l2], loc='upper right', title='Standard Functions')

# 添加第二个图例
ax.add_artist(leg1)  # 需要手动添加第一个图例
ax.legend(handles=[l3, l4], loc='lower right', title='Damped Functions')

plt.title('Multiple Legends')
plt.xlabel('X-axis')
plt.ylabel('Y-axis')
plt.show()
Output:
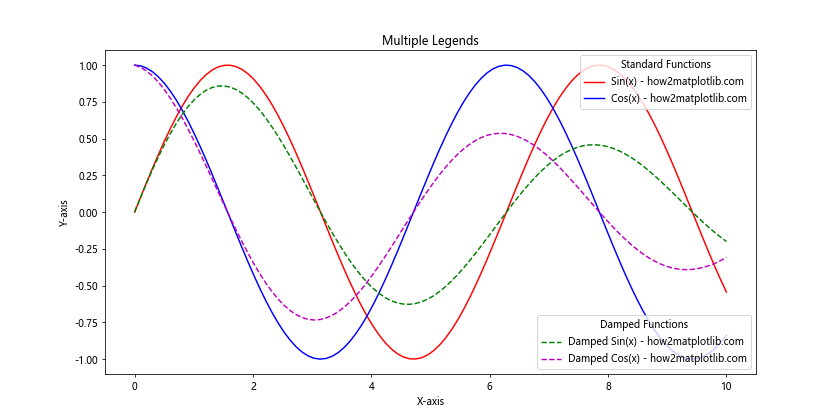
在这个示例中,我们创建了两个独立的图例:一个用于标准三角函数,另一个用于阻尼三角函数。我们使用 ax.add_artist() 方法来确保两个图例都被显示。
结论
通过本文,我们详细探讨了 Matplotlib 中图例的各个方面,从基本的创建到高级的自定义。我们学习了如何创建基本图例、自定义图例位置和样式、处理多列图例、添加自定义元素、使用数学公式、包含颜色条、调整透明度、使用不同的线条样式和标记、启用拖动功能、在图例中包含图像、自定义字体样式,以及创建多个图例。
掌握这些技巧将使您能够创建更加专业、信息丰富和视觉吸引力的数据可视化作品。图例是数据可视化中至关重要的组成部分,它能帮助读者快速理解图表中的信息。通过灵活运用 Matplotlib 提供的各种图例功能,您可以大大提高数据展示的效果和清晰度。
记住,创建有效的图例不仅仅是技术问题,还需要考虑数据的特性、目标受众以及整体设计美学。在实际应用中,您可能需要根据具体情况组合使用这些技巧,以达到最佳的可视化效果。
继续探索和实践这些技巧,您将能够在各种数据可视化场景中自如地运用 Matplotlib 的图例功能,创造出既美观又富有洞察力的数据图表。
 极客笔记
极客笔记