Matplotlib图例标题
在matplotlib中,图例是用来标记每个数据系列的标签,以便更好地理解图表。然而,有时候我们也需要为整个图例添加一个标题,以进一步说明图例的含义。本文将介绍如何在matplotlib中添加图例标题。
添加图例标题
要在matplotlib中添加图例标题,可以使用Legend对象的set_title方法。下面是一个简单的示例代码:
import matplotlib.pyplot as plt

x = [1, 2, 3, 4, 5]
y1 = [1, 4, 9, 16, 25]
y2 = [1, 3, 6, 10, 15]

plt.plot(x, y1, label='Line 1')
plt.plot(x, y2, label='Line 2')
plt.legend(title='Legend Title')

plt.show()
Output:
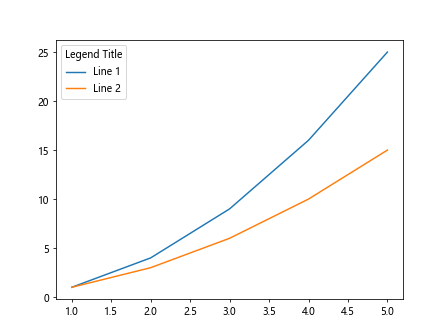
在上面的示例中,我们使用plt.legend(title='Legend Title')来添加图例标题”Legend Title”。
自定义图例标题样式
除了添加一个简单的文本标题之外,我们还可以通过设置legend_title属性来自定义图例标题的样式。下面的示例代码演示了如何设置图例标题的字体大小、颜色和对齐方式:
import matplotlib.pyplot as plt

x = [1, 2, 3, 4, 5]
y1 = [1, 4, 9, 16, 25]
y2 = [1, 3, 6, 10, 15]

plt.plot(x, y1, label='Line 1')
plt.plot(x, y2, label='Line 2')
legend = plt.legend(title='Legend Title')
legend.get_title().set_fontsize('12')
legend.get_title().set_color('red')
legend.get_title().set_ha('center')

plt.show()
Output:
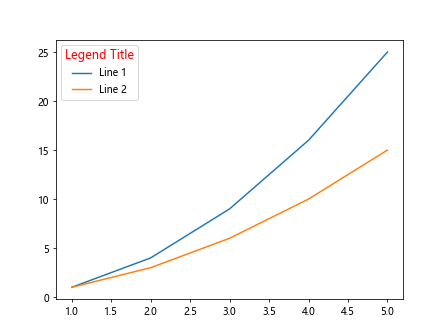
在上面的示例中,我们通过legend.get_title()获取图例标题对象,并分别设置了字体大小为12,颜色为红色,对齐方式为居中。
水平对齐图例标题
有时候,我们需要将图例标题水平对齐,可以通过设置legend_title属性的对齐方式来实现。下面的示例代码演示了如何将图例标题水平对齐到右侧:
import matplotlib.pyplot as plt

x = [1, 2, 3, 4, 5]
y1 = [1, 4, 9, 16, 25]
y2 = [1, 3, 6, 10, 15]

plt.plot(x, y1, label='Line 1')
plt.plot(x, y2, label='Line 2')
legend = plt.legend(title='Legend Title')
legend.get_title().set_ha('right')

plt.show()
Output:
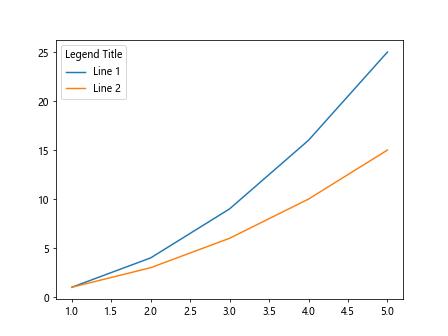
在上面的示例中,我们通过legend.get_title().set_ha('right')将图例标题水平对齐到右侧。
垂直对齐图例标题
类似地,我们也可以将图例标题垂直对齐到顶部、底部或中间位置。下面的示例代码演示了如何将图例标题垂直对齐到底部:
import matplotlib.pyplot as plt

x = [1, 2, 3, 4, 5]
y1 = [1, 4, 9, 16, 25]
y2 = [1, 3, 6, 10, 15]

plt.plot(x, y1, label='Line 1')
plt.plot(x, y2, label='Line 2')
legend = plt.legend(title='Legend Title')
legend.get_title().set_va('bottom')

plt.show()
Output:
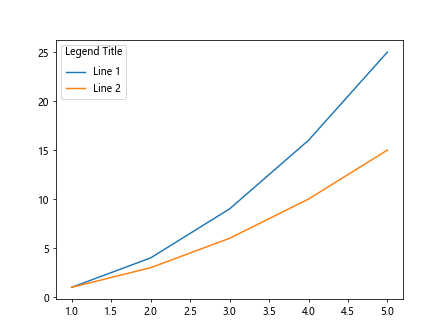
在上面的示例中,我们通过legend.get_title().set_va('bottom')将图例标题垂直对齐到底部。
更改图例标题文本
除了样式和对齐方式之外,我们还可以通过set_text方法来更改图例标题的文本。下面的示例代码演示了如何将图例标题更改为”New Legend Title”:
import matplotlib.pyplot as plt

x = [1, 2, 3, 4, 5]
y1 = [1, 4, 9, 16, 25]
y2 = [1, 3, 6, 10, 15]

plt.plot(x, y1, label='Line 1')
plt.plot(x, y2, label='Line 2')
legend = plt.legend(title='Legend Title')
legend.get_title().set_text('New Legend Title')

plt.show()
Output:
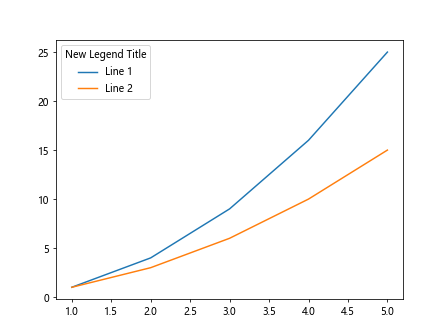
在上面的示例中,我们通过legend.get_title().set_text('New Legend Title')将图例标题更改为”New Legend Title”。
隐藏图例标题
如果不需要显示图例标题,我们可以通过设置set_visible方法来隐藏它。下面的示例代码演示了如何隐藏图例标题:
import matplotlib.pyplot as plt

x = [1, 2, 3, 4, 5]
y1 = [1, 4, 9, 16, 25]
y2 = [1, 3, 6, 10, 15]

plt.plot(x, y1, label='Line 1')
plt.plot(x, y2, label='Line 2')
legend = plt.legend(title='Legend Title')
legend.get_title().set_visible(False)

plt.show()
Output:
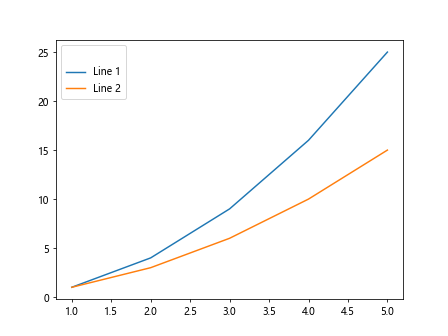
在上面的示例中,我们通过legend.get_title().set_visible(False)隐藏了图例标题。
设置图例标题边框
除了设置文本样式和对齐方式之外,有时候我们还需要为图例标题添加边框。下面的示例代码演示了如何为图例标题添加边框:
import matplotlib.pyplot as plt

x = [1, 2, 3, 4, 5]
y1 = [1, 4, 9, 16, 25]
y2 = [1, 3, 6, 10, 15]

plt.plot(x, y1, label='Line 1')
plt.plot(x, y2, label='Line 2')
legend = plt.legend(title='Legend Title')
legend.get_title().set_bbox({'facecolor': 'lightblue', 'edgecolor': 'black', 'linewidth': 1, 'pad': 5})

plt.show()
Output:
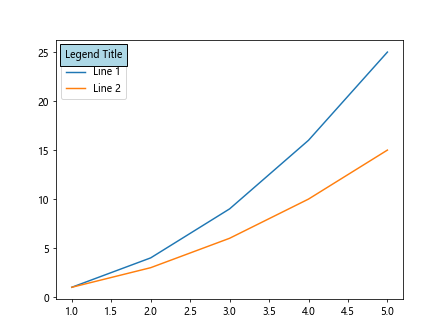
在上面的示例中,我们通过legend.get_title().set_bbox为图例标题添加了一个浅蓝色背景色,并设置了黑色边框、边框宽度为1、内边距为5。
修改图例标题位置
默认情况下,图例标题位于图例框的顶部。我们可以通过设置loc参数来修改图例标题的位置。下面的示例代码演示了如何将图例标题移动到图例框的底部:
import matplotlib.pyplot as plt

x = [1, 2, 3, 4, 5]
y1 = [1, 4, 9, 16, 25]
y2 = [1, 3, 6, 10, 15]

plt.plot(x, y1, label='Line 1')
plt.plot(x, y2, label='Line 2')
plt.legend(title='Legend Title', loc='lower center')

plt.show()
Output:
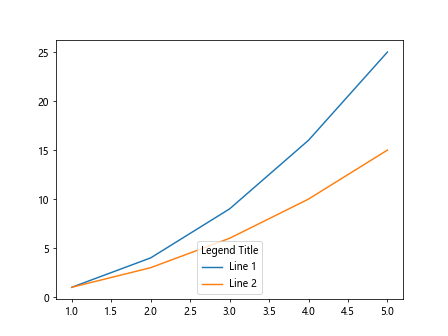
在上面的示例中,我们通过plt.legend(title='Legend Title', loc='lower center')
将图例标题移动到图例框的底部中心位置。
改变图例标题背景颜色
有时候我们需要为图例标题添加背景色,以更好地突出显示。下面的示例代码演示了如何为图例标题添加背景色:
import matplotlib.pyplot as plt

x = [1, 2, 3, 4, 5]
y1 = [1, 4, 9, 16, 25]
y2 = [1, 3, 6, 10, 15]

plt.plot(x, y1, label='Line 1')
plt.plot(x, y2, label='Line 2')
legend = plt.legend(title='Legend Title')
legend.get_title().set_backgroundcolor('lightyellow')

plt.show()
Output:
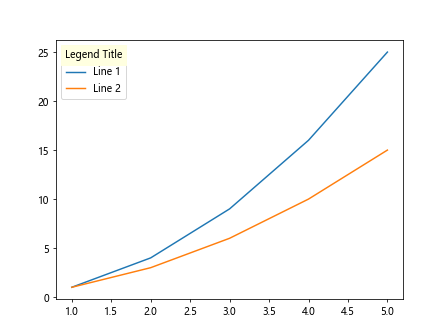
在上面的示例中,我们通过legend.get_title().set_backgroundcolor('lightyellow')为图例标题添加了浅黄色的背景色。
设置图例标题透明度
除了背景颜色之外,我们还可以设置图例标题的透明度。下面的示例代码演示了如何设置图例标题的透明度为0.5:
import matplotlib.pyplot as plt

x = [1, 2, 3, 4, 5]
y1 = [1, 4, 9, 16, 25]
y2 = [1, 3, 6, 10, 15]

plt.plot(x, y1, label='Line 1')
plt.plot(x, y2, label='Line 2')
legend = plt.legend(title='Legend Title')
legend.get_title().set_alpha(0.5)

plt.show()
Output:
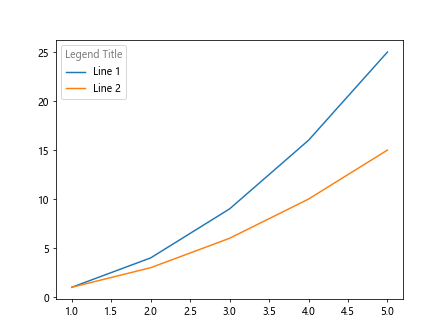
在上面的示例中,我们通过legend.get_title().set_alpha(0.5)将图例标题的透明度设置为0.5。
使用HTML格式的图例标题
在matplotlib中,我们还可以使用HTML格式的文本来设置图例标题。下面的示例代码演示了如何使用HTML格式的文本为图例标题添加颜色和大小:
import matplotlib.pyplot as plt

x = [1, 2, 3, 4, 5]
y1 = [1, 4, 9, 16, 25]
y2 = [1, 3, 6, 10, 15]

plt.plot(x, y1, label='Line 1')
plt.plot(x, y2, label='Line 2')
html_text = "<font color='blue' size='5'>Legend Title</font>"
plt.legend(title=html_text)

plt.show()
Output:
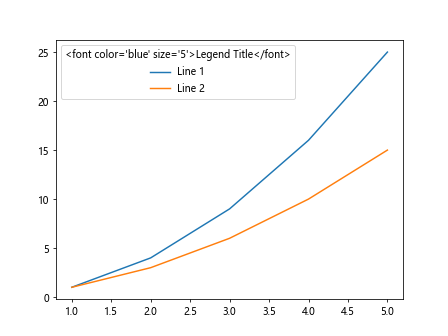
在上面的示例中,我们通过将HTML格式的文本"<font color='blue' size='5'>Legend Title</font>"传递给plt.legend来设置图例标题为蓝色并且字体大小为5。
使用LaTeX格式的图例标题
除了HTML格式,我们还可以使用LaTeX格式的文本来设置图例标题。下面的示例代码演示了如何使用LaTeX格式的文本为图例标题添加公式:
import matplotlib.pyplot as plt

x = [1, 2, 3, 4, 5]
y1 = [1, 4, 9, 16, 25]
y2 = [1, 3, 6, 10, 15]

plt.plot(x, y1, label='Line 1')
plt.plot(x, y2, label='Line 2')
latex_text = r"\frac{a}{b}"
plt.legend(title=latex_text)

plt.show()
Output:
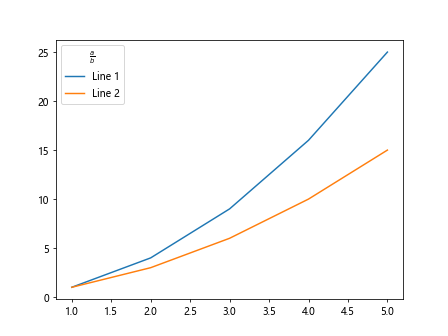
在上面的示例中,我们通过将LaTeX格式的文本r"\frac{a}{b}"传递给plt.legend来设置图例标题为分数公式。
设置图例标题的旋转角度
有时候我们需要将图例标题旋转一定角度,以适应图表。下面的示例代码演示了如何将图例标题旋转45度:
import matplotlib.pyplot as plt

x = [1, 2, 3, 4, 5]
y1 = [1, 4, 9, 16, 25]
y2 = [1, 3, 6, 10, 15]

plt.plot(x, y1, label='Line 1')
plt.plot(x, y2, label='Line 2')
legend = plt.legend(title='Legend Title')
legend.get_title().set_rotation(45)

plt.show()
Output:
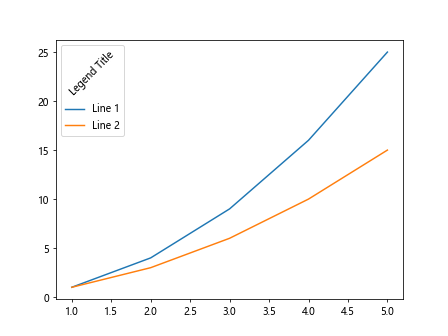
在上面的示例中,我们通过legend.get_title().set_rotation(45)将图例标题旋转了45度。
小结
本文介绍了如何在matplotlib中添加图例标题,包括添加文本标题、自定义样式、调整位置、修改文本内容、隐藏标题、设置边框、改变背景色、设置透明度、使用HTML和LaTeX格式的文本以及旋转标题角度等。
 极客笔记
极客笔记