Matplotlib 图例字体大小设置:全面指南与实用技巧
参考:matplotlib legend font size
Matplotlib 是 Python 中最流行的数据可视化库之一,它提供了丰富的绘图功能和自定义选项。在数据可视化中,图例(legend)是一个非常重要的元素,它帮助读者理解图表中不同数据系列的含义。而图例的字体大小直接影响了图表的可读性和美观度。本文将深入探讨如何在 Matplotlib 中设置和调整图例的字体大小,包括全局设置、局部设置以及各种高级技巧。
1. 图例字体大小的重要性
在数据可视化中,图例的字体大小看似是一个小细节,但实际上对整个图表的效果有着重要影响:
- 可读性:适当的字体大小确保图例文本清晰可读,特别是在打印或投影时。
- 美观性:与图表其他元素协调的字体大小可以提升整体视觉效果。
- 信息传递:合适的字体大小有助于突出重要信息,引导读者注意力。
- 空间利用:恰当的字体大小可以在不占用过多图表空间的情况下传递必要信息。
让我们通过一个简单的示例来看看图例字体大小的效果:
import matplotlib.pyplot as plt
import numpy as np

x = np.linspace(0, 10, 100)
plt.figure(figsize=(10, 6))
plt.plot(x, np.sin(x), label='Sin(x) - how2matplotlib.com')
plt.plot(x, np.cos(x), label='Cos(x) - how2matplotlib.com')
plt.legend(fontsize=12)
plt.title('Trigonometric Functions')
plt.xlabel('x')
plt.ylabel('y')
plt.show()
Output:
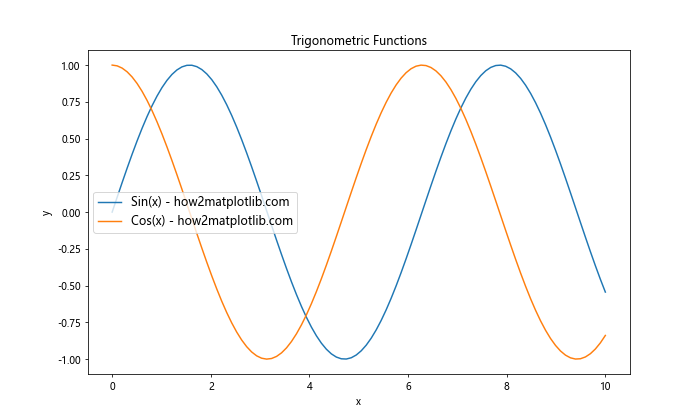
在这个例子中,我们设置了图例的字体大小为 12。这个大小通常适合大多数图表,但根据具体需求,我们可能需要调整这个值。
2. 全局设置图例字体大小
Matplotlib 允许我们通过 rcParams 全局设置图例字体大小,这样可以确保所有图表保持一致的样式。
import matplotlib.pyplot as plt
import numpy as np

plt.rcParams['legend.fontsize'] = 14

x = np.linspace(0, 10, 100)
plt.figure(figsize=(10, 6))
plt.plot(x, np.sin(x), label='Sin(x) - how2matplotlib.com')
plt.plot(x, np.cos(x), label='Cos(x) - how2matplotlib.com')
plt.legend()
plt.title('Trigonometric Functions with Global Legend Font Size')
plt.xlabel('x')
plt.ylabel('y')
plt.show()
Output:
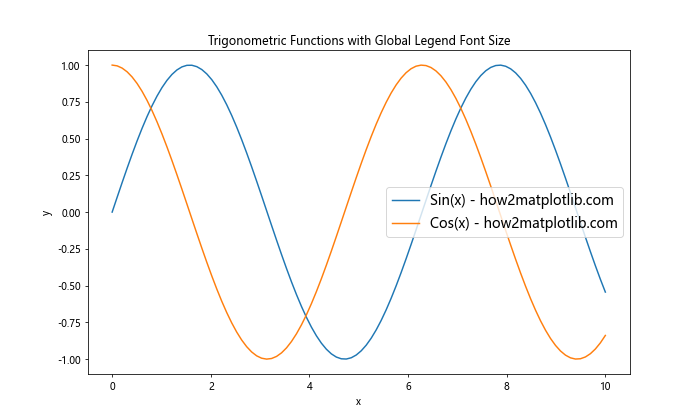
在这个例子中,我们通过 plt.rcParams['legend.fontsize'] = 14 全局设置了图例字体大小。这将影响之后创建的所有图表,除非在个别图表中进行局部覆盖。
3. 局部设置图例字体大小
有时我们可能只想为特定的图表设置不同的图例字体大小。Matplotlib 提供了多种方法来实现这一点:
3.1 使用 legend() 方法
import matplotlib.pyplot as plt
import numpy as np

x = np.linspace(0, 10, 100)
plt.figure(figsize=(10, 6))
plt.plot(x, np.sin(x), label='Sin(x) - how2matplotlib.com')
plt.plot(x, np.cos(x), label='Cos(x) - how2matplotlib.com')
plt.legend(fontsize=16)
plt.title('Trigonometric Functions with Local Legend Font Size')
plt.xlabel('x')
plt.ylabel('y')
plt.show()
Output:
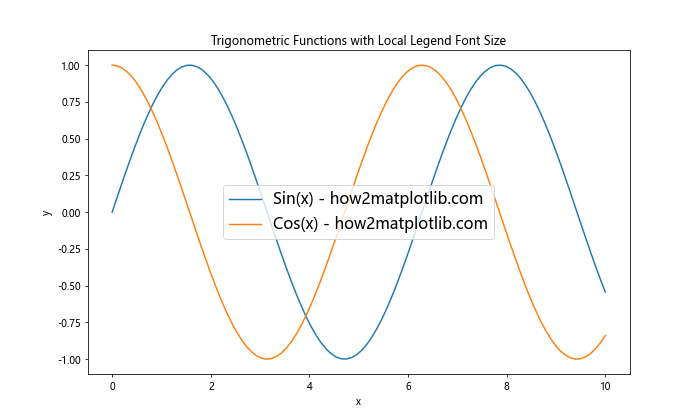
在这个例子中,我们直接在 legend() 方法中设置 fontsize 参数为 16,这只会影响当前图表的图例字体大小。
3.2 使用 prop 参数
legend() 方法还接受一个 prop 参数,它允许我们更精细地控制图例的字体属性:
import matplotlib.pyplot as plt
import numpy as np

x = np.linspace(0, 10, 100)
plt.figure(figsize=(10, 6))
plt.plot(x, np.sin(x), label='Sin(x) - how2matplotlib.com')
plt.plot(x, np.cos(x), label='Cos(x) - how2matplotlib.com')
plt.legend(prop={'family': 'serif', 'size': 18})
plt.title('Trigonometric Functions with Custom Legend Font')
plt.xlabel('x')
plt.ylabel('y')
plt.show()
Output:
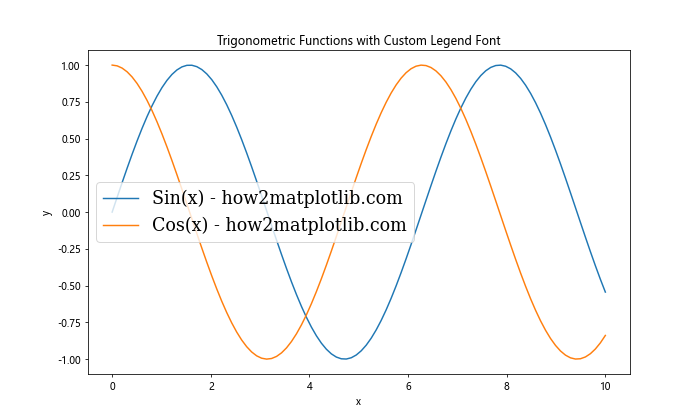
在这个例子中,我们不仅设置了字体大小为 18,还指定了字体系列为 serif。
4. 动态调整图例字体大小
有时我们可能需要根据图表的大小或其他因素动态调整图例的字体大小。以下是一个根据图表宽度调整字体大小的例子:
import matplotlib.pyplot as plt
import numpy as np

def adjust_legend_font_size(fig):
    width, height = fig.get_size_inches()
    font_size = max(8, min(14, int(width * 1.5)))
    return {'size': font_size}

x = np.linspace(0, 10, 100)
fig, ax = plt.subplots(figsize=(8, 6))
ax.plot(x, np.sin(x), label='Sin(x) - how2matplotlib.com')
ax.plot(x, np.cos(x), label='Cos(x) - how2matplotlib.com')
ax.legend(prop=adjust_legend_font_size(fig))
ax.set_title('Dynamic Legend Font Size')
ax.set_xlabel('x')
ax.set_ylabel('y')
plt.show()
Output:
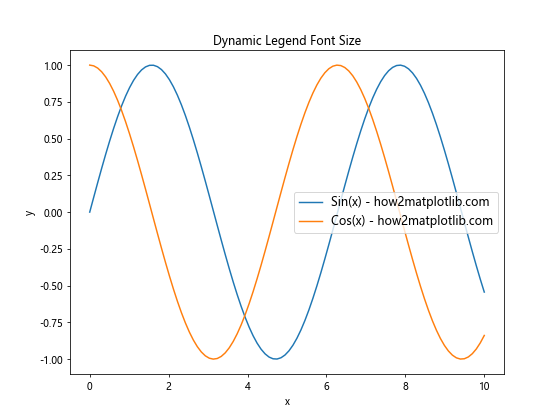
这个例子定义了一个 adjust_legend_font_size 函数,它根据图表的宽度计算合适的字体大小,确保字体大小在 8 到 14 之间。
5. 设置不同图例项的字体大小
有时我们可能想为图例中的不同项设置不同的字体大小,以突出某些特定的数据系列:
import matplotlib.pyplot as plt
import numpy as np

x = np.linspace(0, 10, 100)
fig, ax = plt.subplots(figsize=(10, 6))
line1, = ax.plot(x, np.sin(x), label='Sin(x) - how2matplotlib.com')
line2, = ax.plot(x, np.cos(x), label='Cos(x) - how2matplotlib.com')

legend = ax.legend()
legend.get_texts()[0].set_fontsize(14)
legend.get_texts()[1].set_fontsize(10)

ax.set_title('Different Font Sizes for Legend Items')
ax.set_xlabel('x')
ax.set_ylabel('y')
plt.show()
Output:
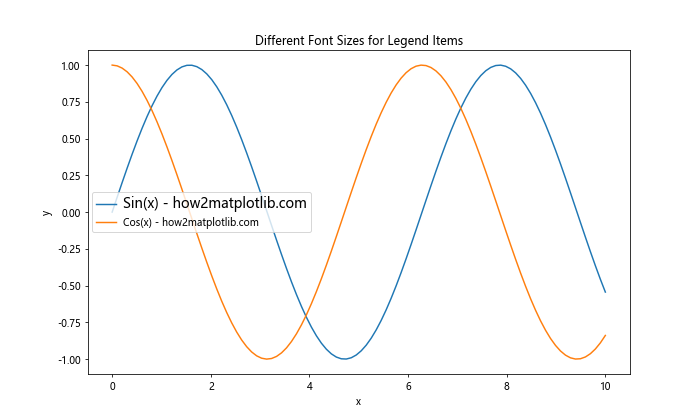
在这个例子中,我们首先创建图例,然后通过 get_texts() 方法获取图例中的文本对象,并分别设置它们的字体大小。
6. 使用字体大小单位
Matplotlib 支持多种字体大小单位,如点(pt)、像素(px)、英寸(in)等。以下是一个使用不同单位设置图例字体大小的例子:
import matplotlib.pyplot as plt
import numpy as np

x = np.linspace(0, 10, 100)
fig, (ax1, ax2, ax3) = plt.subplots(1, 3, figsize=(15, 5))

ax1.plot(x, np.sin(x), label='Sin(x) - how2matplotlib.com')
ax1.legend(fontsize='12pt')
ax1.set_title('Font Size in Points')

ax2.plot(x, np.cos(x), label='Cos(x) - how2matplotlib.com')
ax2.legend(fontsize='3mm')
ax2.set_title('Font Size in Millimeters')

ax3.plot(x, np.tan(x), label='Tan(x) - how2matplotlib.com')
ax3.legend(fontsize='small')
ax3.set_title('Font Size as String')

plt.tight_layout()
plt.show()
这个例子展示了如何使用不同的单位(点、毫米)和字符串描述符(’small’)来设置图例字体大小。
7. 根据图表尺寸自动调整字体大小
为了确保图例在不同大小的图表中都能保持良好的可读性,我们可以实现一个函数来根据图表尺寸自动调整字体大小:
import matplotlib.pyplot as plt
import numpy as np

def auto_legend_fontsize(fig):
    width, height = fig.get_size_inches()
    area = width * height
    base_size = 8
    max_size = 16
    size = base_size + (max_size - base_size) * (area - 30) / (100 - 30)
    return max(base_size, min(max_size, size))

x = np.linspace(0, 10, 100)
for size in [(6, 4), (10, 6), (12, 8)]:
    fig, ax = plt.subplots(figsize=size)
    ax.plot(x, np.sin(x), label='Sin(x) - how2matplotlib.com')
    ax.plot(x, np.cos(x), label='Cos(x) - how2matplotlib.com')
    fontsize = auto_legend_fontsize(fig)
    ax.legend(fontsize=fontsize)
    ax.set_title(f'Figure Size: {size}, Legend Font Size: {fontsize:.1f}')
    plt.show()
Output:
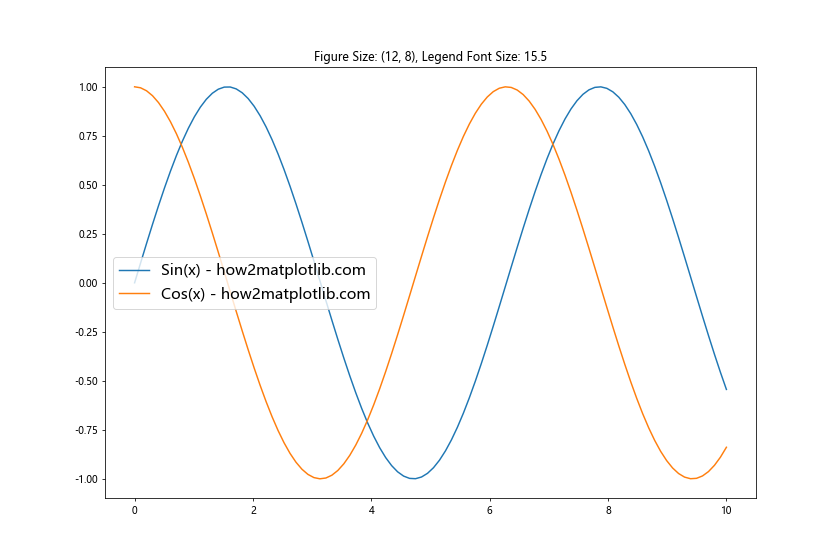
这个例子定义了一个 auto_legend_fontsize 函数,它根据图表的面积计算合适的字体大小。我们然后创建了三个不同大小的图表,并应用这个函数来设置图例字体大小。
8. 设置图例标题的字体大小
图例不仅可以包含数据系列的标签,还可以有一个标题。我们可以单独设置图例标题的字体大小:
import matplotlib.pyplot as plt
import numpy as np

x = np.linspace(0, 10, 100)
fig, ax = plt.subplots(figsize=(10, 6))
ax.plot(x, np.sin(x), label='Sin(x) - how2matplotlib.com')
ax.plot(x, np.cos(x), label='Cos(x) - how2matplotlib.com')

legend = ax.legend(title='Trigonometric Functions', fontsize=12)
legend.get_title().set_fontsize('14')

ax.set_title('Legend with Custom Title Font Size')
ax.set_xlabel('x')
ax.set_ylabel('y')
plt.show()
Output:
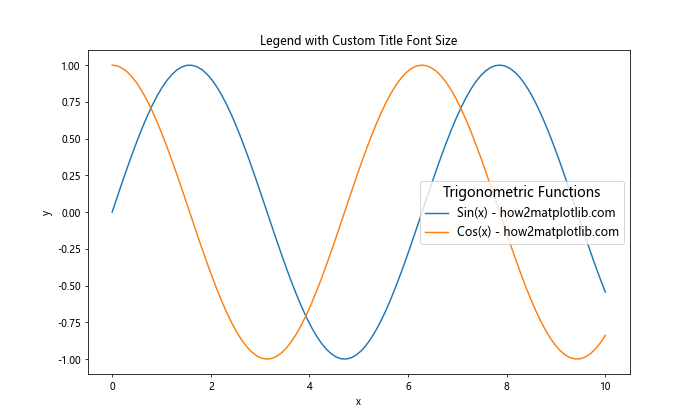
在这个例子中,我们设置了图例项的字体大小为 12,而图例标题的字体大小为 14。
9. 使用样式表设置图例字体大小
Matplotlib 的样式表功能允许我们预定义一组样式设置,包括图例字体大小。这对于保持多个图表的一致性非常有用:
import matplotlib.pyplot as plt
import numpy as np

style = {
    'legend.fontsize': 14,
    'figure.figsize': (10, 6),
    'axes.labelsize': 12,
    'axes.titlesize': 16
}

plt.style.use(style)

x = np.linspace(0, 10, 100)
plt.plot(x, np.sin(x), label='Sin(x) - how2matplotlib.com')
plt.plot(x, np.cos(x), label='Cos(x) - how2matplotlib.com')
plt.legend()
plt.title('Using Style Sheet for Legend Font Size')
plt.xlabel('x')
plt.ylabel('y')
plt.show()
Output:
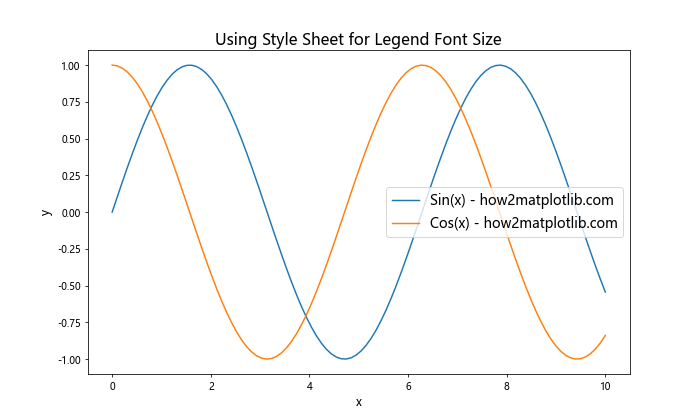
这个例子创建了一个自定义样式字典,其中包含了图例字体大小的设置,然后使用 plt.style.use() 应用这个样式。
10. 处理长标签的图例字体大小
当图例标签较长时,可能需要调整字体大小以确保所有文本都能显示:
import matplotlib.pyplot as plt
import numpy as np

def adjust_legend_fontsize(fig, labels):
    width = fig.get_figwidth()
    max_label_length = max(len(label) for label in labels)
    font_size = max(6, min(12, int(width * 120 / max_label_length)))
    return font_size

x = np.linspace(0, 10, 100)
fig, ax = plt.subplots(figsize=(8, 6))
ax.plot(x, np.sin(x), label='Sine function - how2matplotlib.com')
ax.plot(x, np.cos(x), label='Cosine function - how2matplotlib.com')
ax.plot(x, np.tan(x), label='Tangent function - how2matplotlib.com')

labels = [line.get_label() for line in ax.lines]
font_size = adjust_legend_fontsize(fig, labels)
ax.legend(fontsize=font_size)

ax.set_title('Adjusted Font Size for Long Labels')
ax.set_xlabel('x')
ax.set_ylabel('y')
plt.show()
Output:
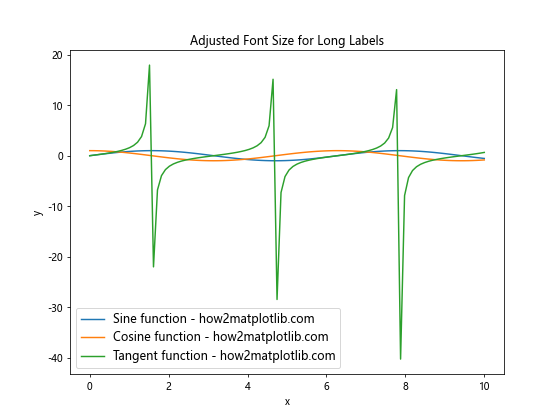
这个例子定义了一个 adjust_legend_fontsize 函数,它根据最长标签的长度和图表宽度来计算合适的字体大小。
11. 图例字体大小与其他文本元素的协调
为了使图表看起来协调一致,图例的字体大小应该与其他文本元素(如标题、轴标签)的大小相协调:
import matplotlib.pyplot as plt
import numpy as np

def set_coordinated_fontsizes(ax, base_size=10):
    ax.set_title('Coordinated Font Sizes', fontsize=base_size * 1.6)
    ax.set_xlabel('x', fontsize=base_size * 1.2)
    ax.set_ylabel('y', fontsize=basesize * 1.2)
    ax.tick_params(labelsize=base_size)
    return base_size * 1.1  # 图例字体大小略大于基础大小

x = np.linspace(0, 10, 100)
fig, ax = plt.subplots(figsize=(10, 6))
ax.plot(x, np.sin(x), label='Sin(x) - how2matplotlib.com')
ax.plot(x, np.cos(x), label='Cos(x) - how2matplotlib.com')

legend_fontsize = set_coordinated_fontsizes(ax)
ax.legend(fontsize=legend_fontsize)

plt.show()
这个例子定义了一个 set_coordinated_fontsizes 函数,它根据一个基础字体大小设置图表中各个文本元素的大小,并返回一个适合图例的字体大小。
12. 响应式图例字体大小
在交互式环境中,我们可能需要根据图表的实时大小调整图例字体大小。以下是一个使用 Matplotlib 的事件处理机制来实现这一功能的例子:
import matplotlib.pyplot as plt
import numpy as np

def on_resize(event):
    fig = event.canvas.figure
    w, h = fig.get_size_inches()
    fontsize = max(8, min(14, int(w * 1.5)))
    legend = ax.get_legend()
    if legend:
        for text in legend.get_texts():
            text.set_fontsize(fontsize)
    fig.canvas.draw_idle()

x = np.linspace(0, 10, 100)
fig, ax = plt.subplots(figsize=(8, 6))
ax.plot(x, np.sin(x), label='Sin(x) - how2matplotlib.com')
ax.plot(x, np.cos(x), label='Cos(x) - how2matplotlib.com')
ax.legend()

fig.canvas.mpl_connect('resize_event', on_resize)

plt.show()
Output:
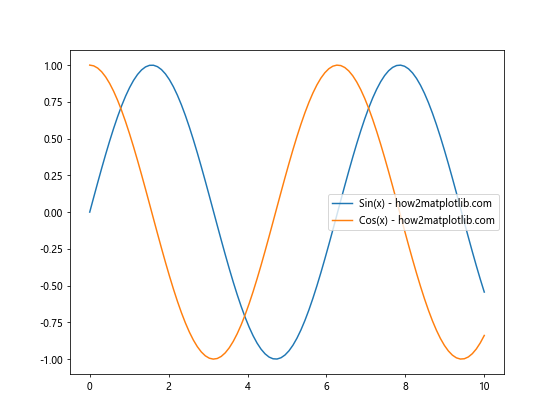
这个例子定义了一个 on_resize 函数,它在图表大小改变时被调用,并相应地调整图例字体大小。注意,这个功能在某些环境中可能不完全支持。
13. 多子图中的图例字体大小
当创建包含多个子图的复杂图表时,我们可能需要为不同的子图设置不同的图例字体大小:
import matplotlib.pyplot as plt
import numpy as np

def set_legend_fontsize(ax, size):
    legend = ax.get_legend()
    if legend:
        for text in legend.get_texts():
            text.set_fontsize(size)

x = np.linspace(0, 10, 100)
fig, (ax1, ax2) = plt.subplots(1, 2, figsize=(12, 5))

ax1.plot(x, np.sin(x), label='Sin(x) - how2matplotlib.com')
ax1.plot(x, np.cos(x), label='Cos(x) - how2matplotlib.com')
ax1.legend()
set_legend_fontsize(ax1, 10)
ax1.set_title('Subplot 1')

ax2.plot(x, np.tan(x), label='Tan(x) - how2matplotlib.com')
ax2.legend()
set_legend_fontsize(ax2, 8)
ax2.set_title('Subplot 2')

plt.tight_layout()
plt.show()
Output:
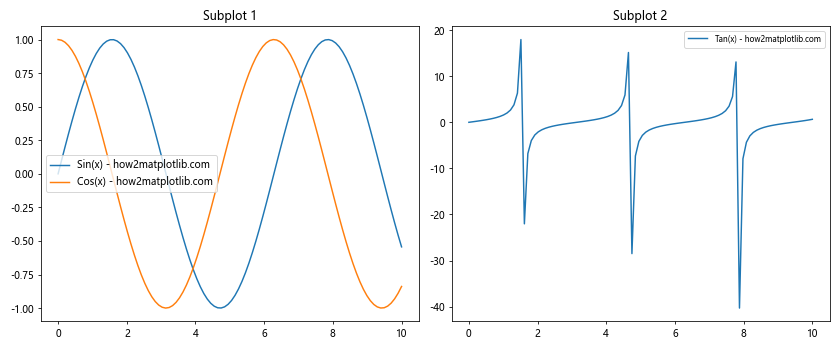
这个例子创建了两个子图,并为每个子图的图例设置了不同的字体大小。
14. 使用 LaTeX 渲染图例文本
对于需要数学公式的图例,我们可以使用 LaTeX 渲染,并调整其字体大小:
import matplotlib.pyplot as plt
import numpy as np

plt.rcParams['text.usetex'] = True
plt.rcParams['font.family'] = 'serif'

x = np.linspace(0, 2*np.pi, 100)
fig, ax = plt.subplots(figsize=(10, 6))
ax.plot(x, np.sin(x), label=r'\sin(x) - how2matplotlib.com')
ax.plot(x, np.cos(x), label=r'\cos(x) - how2matplotlib.com')

ax.legend(fontsize=14)
ax.set_title('LaTeX Rendered Legend', fontsize=16)
ax.set_xlabel('x', fontsize=12)
ax.set_ylabel('y', fontsize=12)

plt.show()
这个例子启用了 LaTeX 渲染,并使用 LaTeX 语法来表示图例标签中的数学公式。注意,使用 LaTeX 渲染需要系统安装相应的 LaTeX 引擎。
15. 图例字体大小的 A/B 测试
在设计数据可视化时,我们可能想比较不同图例字体大小的效果。以下是一个简单的 A/B 测试示例:
import matplotlib.pyplot as plt
import numpy as np

def create_plot(fontsize):
    x = np.linspace(0, 10, 100)
    fig, ax = plt.subplots(figsize=(8, 6))
    ax.plot(x, np.sin(x), label='Sin(x) - how2matplotlib.com')
    ax.plot(x, np.cos(x), label='Cos(x) - how2matplotlib.com')
    ax.legend(fontsize=fontsize)
    ax.set_title(f'Legend Font Size: {fontsize}')
    return fig

fig1 = create_plot(10)
fig2 = create_plot(14)

plt.show()
Output:
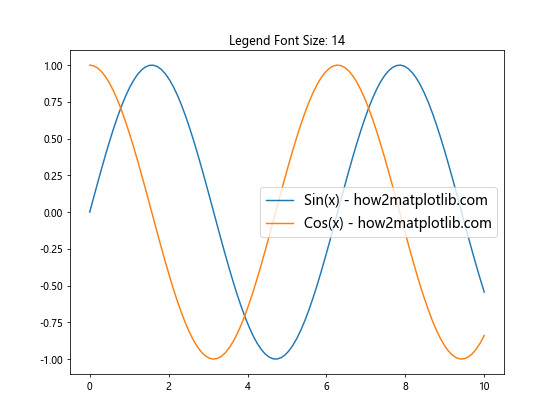
这个例子创建了两个相同的图表,但使用了不同的图例字体大小,便于直接比较效果。
16. 动态调整图例位置和字体大小
有时,我们可能需要根据图例的内容和位置动态调整其字体大小,以确保它不会与图表的其他部分重叠:
import matplotlib.pyplot as plt
import numpy as np

def adjust_legend(ax, padding=0.1):
    legend = ax.get_legend()
    if legend:
        bbox = legend.get_bbox_to_anchor().transformed(ax.transAxes.inverted())
        x, y = bbox.x0, bbox.y1
        if x < 0.5 and y < 0.5:  # 左下角
            legend._loc = 2  # 移到左上角
        elif x >= 0.5 and y < 0.5:  # 右下角
            legend._loc = 1  # 移到右上角
        ax.legend(fontsize=10, loc=legend._loc, bbox_to_anchor=(x, y), bbox_transform=ax.transAxes)

x = np.linspace(0, 10, 100)
fig, ax = plt.subplots(figsize=(8, 6))
ax.plot(x, np.sin(x), label='Sin(x) - how2matplotlib.com')
ax.plot(x, np.cos(x), label='Cos(x) - how2matplotlib.com')
ax.legend(loc='lower right')

adjust_legend(ax)
ax.set_title('Dynamic Legend Adjustment')
plt.tight_layout()
plt.show()
Output:
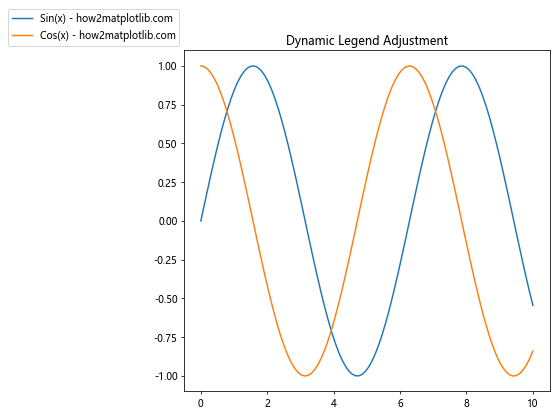
这个例子定义了一个 adjust_legend 函数,它检查图例的位置,并在必要时移动图例以避免与数据重叠。
17. 使用颜色映射自定义图例
对于包含多个数据系列的图表,我们可以使用颜色映射来区分不同的系列,并相应地调整图例:
import matplotlib.pyplot as plt
import numpy as np

x = np.linspace(0, 10, 100)
fig, ax = plt.subplots(figsize=(10, 6))

cmap = plt.get_cmap('viridis')
n_lines = 5

for i in range(n_lines):
    y = np.sin(x + i*np.pi/4)
    color = cmap(i / (n_lines - 1))
    ax.plot(x, y, color=color, label=f'Sin(x + {i}π/4) - how2matplotlib.com')

legend = ax.legend(fontsize=10, title='Phase Shifted Sine Waves', title_fontsize=12)
ax.set_title('Color Mapped Legend')
plt.tight_layout()
plt.show()
Output:
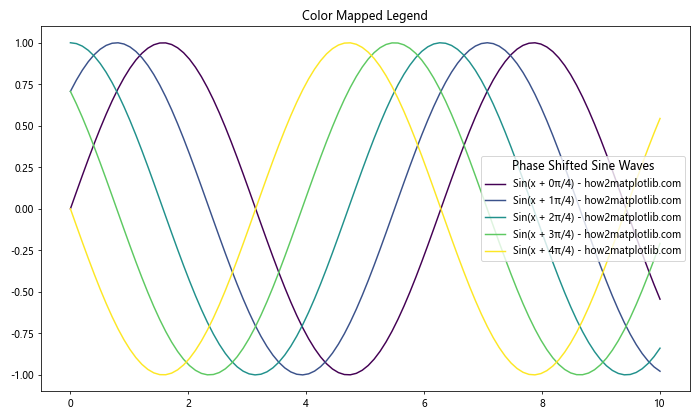
这个例子使用 ‘viridis’ 颜色映射创建了多个相位偏移的正弦波,并为图例设置了相应的颜色和标签。
18. 图例字体大小的动画效果
为了突出显示某些信息,我们可以创建一个图例字体大小变化的动画:
import matplotlib.pyplot as plt
import numpy as np
from matplotlib.animation import FuncAnimation

fig, ax = plt.subplots(figsize=(8, 6))
x = np.linspace(0, 10, 100)
line1, = ax.plot(x, np.sin(x), label='Sin(x) - how2matplotlib.com')
line2, = ax.plot(x, np.cos(x), label='Cos(x) - how2matplotlib.com')

legend = ax.legend(fontsize=10)

def update(frame):
    size = 10 + 5 * np.sin(frame / 10)
    for text in legend.get_texts():
        text.set_fontsize(size)
    return legend.get_texts()

ani = FuncAnimation(fig, update, frames=100, interval=50, blit=True)
plt.show()
Output:
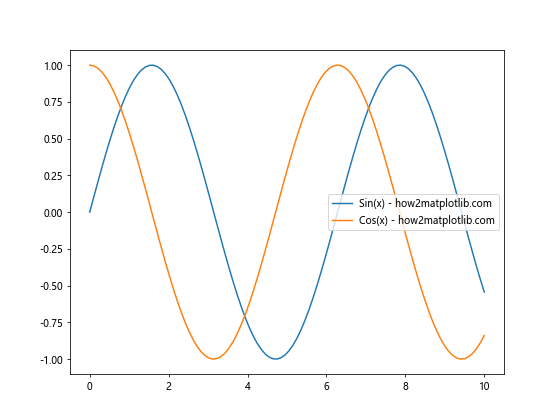
这个例子创建了一个动画,其中图例的字体大小随时间周期性变化。注意,动画效果在某些环境中可能无法正常显示。
结论
通过本文的详细探讨,我们了解了在 Matplotlib 中设置和调整图例字体大小的多种方法和技巧。从基本的全局和局部设置,到动态调整和高级定制,这些技巧可以帮助你创建更加清晰、美观和信息丰富的数据可视化图表。
记住,图例字体大小的选择应该考虑到整体图表的平衡、可读性和美观性。根据具体的使用场景和目标受众,灵活运用这些技巧,你可以创建出既专业又吸引人的数据可视化作品。
最后,建议在实际应用中多尝试不同的设置,并根据反馈不断调整,以找到最适合你的数据和受众的图例样式。随着经验的积累,你将能够更加自如地控制 Matplotlib 中的各种细节,创造出令人印象深刻的数据可视化作品。
 极客笔记
极客笔记