Matplotlib 图形尺寸设置:全面掌握 Figure Size 调整技巧
Matplotlib 是 Python 中最流行的数据可视化库之一,它提供了丰富的绘图功能和灵活的自定义选项。在使用 Matplotlib 创建图形时,控制图形尺寸是一个非常重要的方面。适当的图形尺寸不仅能够提高可视化效果,还能确保图形在不同场景下的适用性。本文将深入探讨 Matplotlib 中的图形尺寸设置,包括基本概念、常用方法、高级技巧以及实际应用案例。
1. 图形尺寸的基本概念
在 Matplotlib 中,图形尺寸主要通过 Figure 对象来控制。Figure 是整个图形的容器,包含了所有的绘图元素,如坐标轴、图例等。图形尺寸通常以英寸为单位,但也可以使用其他单位。
1.1 默认图形尺寸
Matplotlib 有一个默认的图形尺寸,通常是 6.4 x 4.8 英寸。这个默认尺寸适用于大多数简单的绘图需求,但在某些情况下,我们可能需要调整图形尺寸以适应特定的需求。
以下是一个使用默认尺寸创建图形的示例:
import matplotlib.pyplot as plt

plt.figure()
plt.plot([1, 2, 3, 4], [1, 4, 2, 3], label='how2matplotlib.com')
plt.title('Default Figure Size')
plt.legend()
plt.show()
Output:
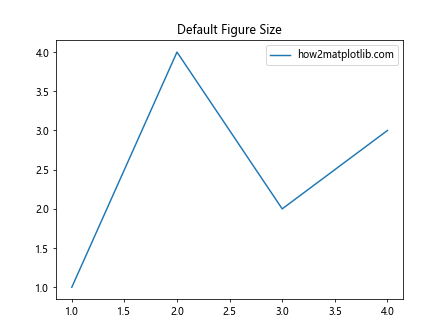
在这个示例中,我们没有指定图形尺寸,因此 Matplotlib 使用默认的 6.4 x 4.8 英寸尺寸。
1.2 DPI 与图形尺寸的关系
DPI(Dots Per Inch)是图形分辨率的一个重要指标,它表示每英寸包含的像素点数。在 Matplotlib 中,DPI 与图形尺寸密切相关。当我们设置图形尺寸时,实际上是在设置图形在显示设备上的物理尺寸。而 DPI 则决定了在这个物理尺寸内包含多少像素。
例如,如果我们设置图形尺寸为 6 x 4 英寸,DPI 为 100,那么最终生成的图像将有 600 x 400 像素。
以下是一个设置 DPI 的示例:
import matplotlib.pyplot as plt

plt.figure(dpi=100)
plt.plot([1, 2, 3, 4], [1, 4, 2, 3], label='how2matplotlib.com')
plt.title('Figure with Custom DPI')
plt.legend()
plt.show()
Output:
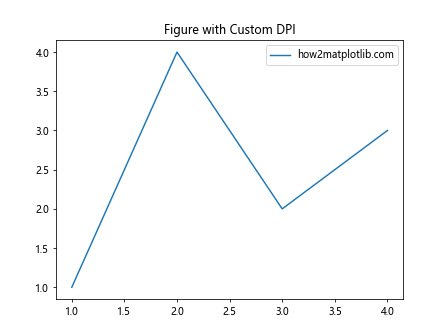
在这个示例中,我们将 DPI 设置为 100,这会影响图形的显示清晰度和保存时的文件大小。
2. 设置图形尺寸的常用方法
Matplotlib 提供了多种方法来设置图形尺寸,我们将逐一介绍这些方法。
2.1 使用 plt.figure() 设置尺寸
最直接的方法是在创建 Figure 对象时指定尺寸。这可以通过 plt.figure() 函数的 figsize 参数来实现。
import matplotlib.pyplot as plt

plt.figure(figsize=(8, 6))
plt.plot([1, 2, 3, 4], [1, 4, 2, 3], label='how2matplotlib.com')
plt.title('Custom Figure Size using plt.figure()')
plt.legend()
plt.show()
Output:
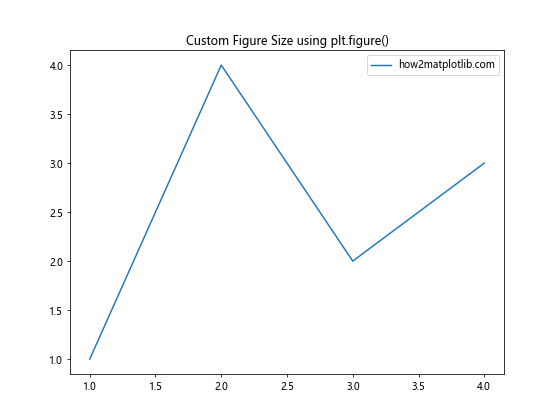
在这个示例中,我们创建了一个 8 x 6 英寸的图形。figsize 参数接受一个元组,其中第一个值是宽度,第二个值是高度。
2.2 使用 plt.rcParams 全局设置尺寸
如果你想在整个脚本或会话中使用相同的图形尺寸,可以通过修改 plt.rcParams 来实现全局设置。
import matplotlib.pyplot as plt

plt.rcParams['figure.figsize'] = [10, 8]

plt.plot([1, 2, 3, 4], [1, 4, 2, 3], label='how2matplotlib.com')
plt.title('Global Figure Size Setting')
plt.legend()
plt.show()
Output:
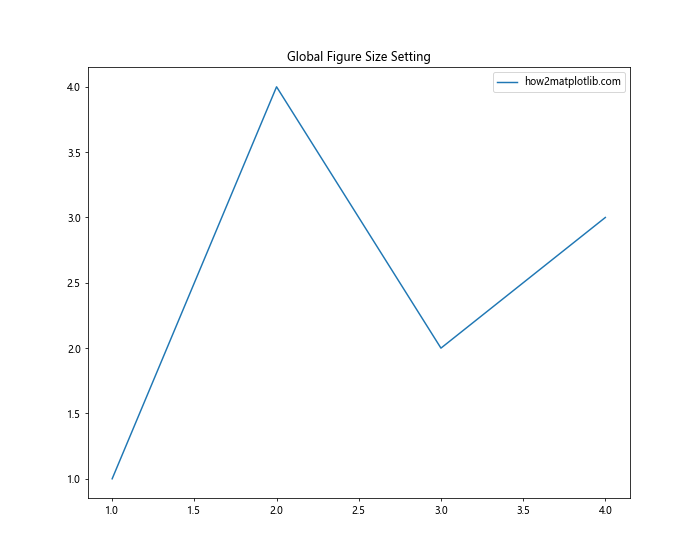
这个方法会影响之后创建的所有图形,除非你在创建特定图形时覆盖这个设置。
2.3 使用 Figure 对象的 set_size_inches() 方法
如果你已经创建了一个 Figure 对象,可以使用其 set_size_inches() 方法来调整尺寸。
import matplotlib.pyplot as plt

fig = plt.figure()
fig.set_size_inches(12, 9)

plt.plot([1, 2, 3, 4], [1, 4, 2, 3], label='how2matplotlib.com')
plt.title('Figure Size Set Using set_size_inches()')
plt.legend()
plt.show()
Output:
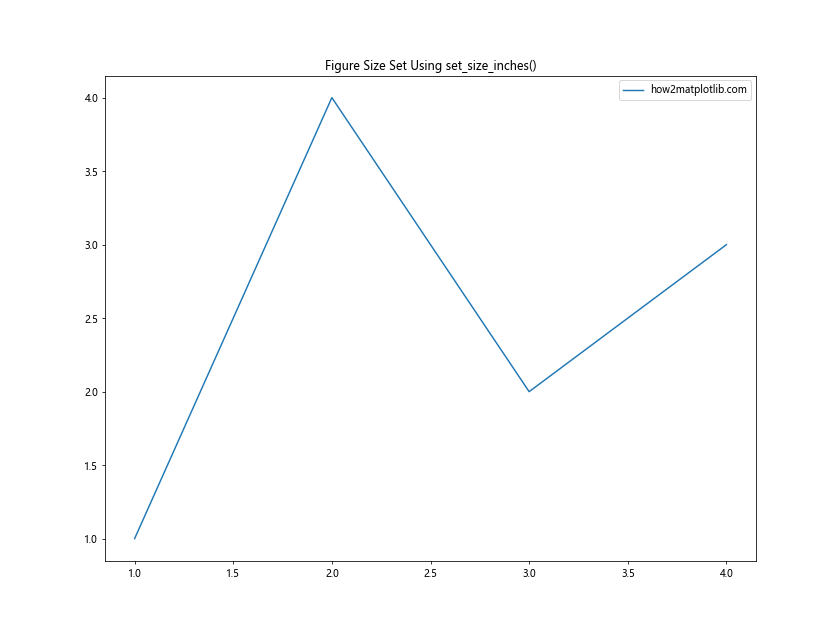
这个方法允许你在创建图形后动态调整其尺寸。
3. 高级图形尺寸设置技巧
除了基本的尺寸设置方法,Matplotlib 还提供了一些高级技巧来更精细地控制图形尺寸。
3.1 根据屏幕分辨率自动调整尺寸
在不同的显示设备上,相同的图形尺寸可能会有不同的显示效果。我们可以编写一个函数来根据屏幕分辨率自动调整图形尺寸。
import matplotlib.pyplot as plt
import tkinter as tk

def get_screen_resolution():
    root = tk.Tk()
    screen_width = root.winfo_screenwidth()
    screen_height = root.winfo_screenheight()
    root.destroy()
    return screen_width, screen_height

def adjust_figure_size():
    screen_width, screen_height = get_screen_resolution()
    fig_width = screen_width / 100  # 将屏幕宽度除以100作为图形宽度
    fig_height = fig_width * 0.75  # 保持4:3的宽高比
    return fig_width, fig_height

plt.figure(figsize=adjust_figure_size())
plt.plot([1, 2, 3, 4], [1, 4, 2, 3], label='how2matplotlib.com')
plt.title('Figure Size Adjusted to Screen Resolution')
plt.legend()
plt.show()
Output:
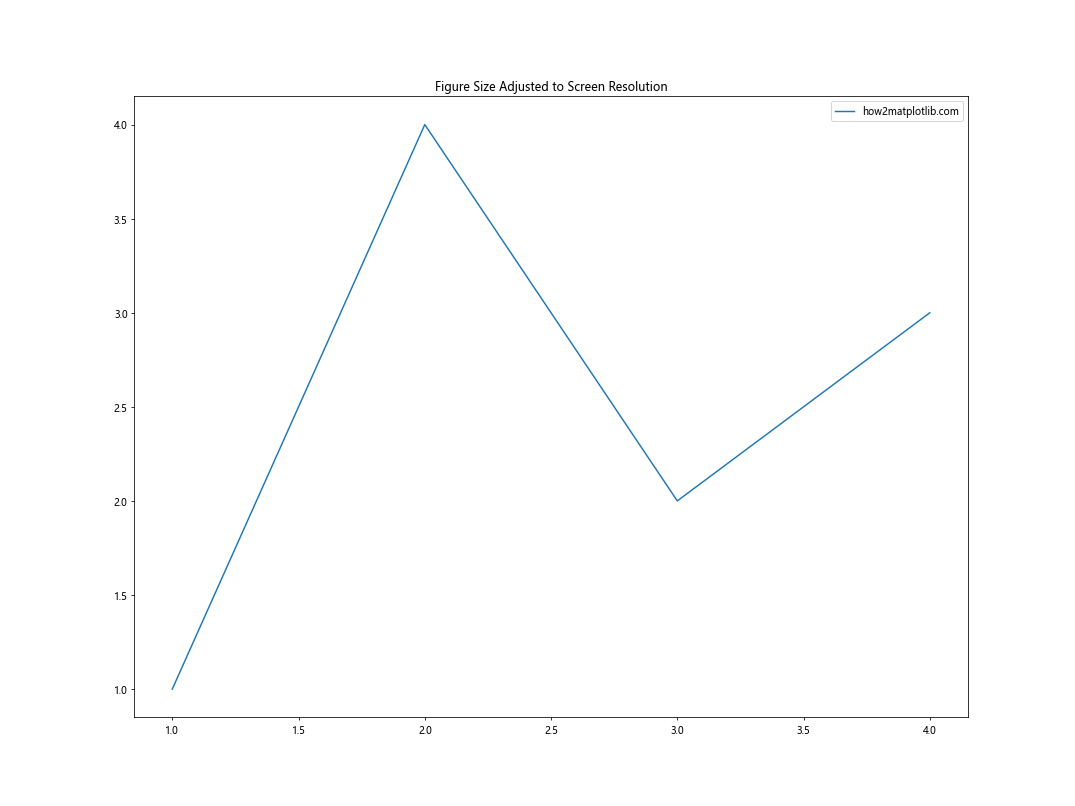
这个示例使用 tkinter 库获取屏幕分辨率,然后根据分辨率计算合适的图形尺寸。
3.2 使用相对尺寸
有时我们可能想要创建相对于默认尺寸的图形。我们可以通过获取当前的默认尺寸并进行缩放来实现这一点。
import matplotlib.pyplot as plt

default_size = plt.rcParams['figure.figsize']
plt.figure(figsize=(default_size[0] * 1.5, default_size[1] * 1.5))

plt.plot([1, 2, 3, 4], [1, 4, 2, 3], label='how2matplotlib.com')
plt.title('Figure Size 1.5 Times Default')
plt.legend()
plt.show()
Output:
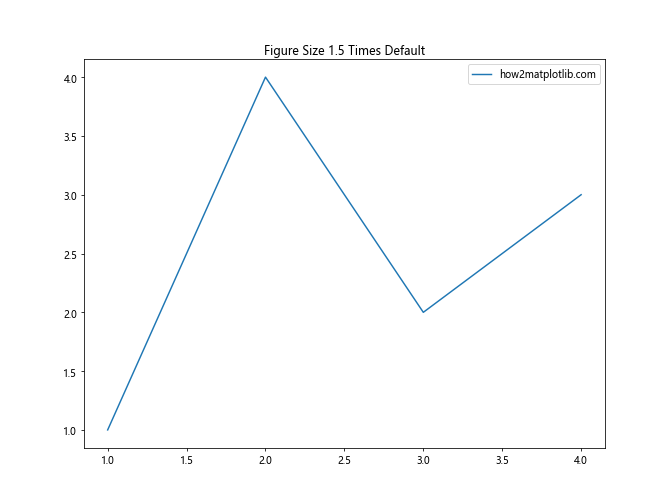
这个示例创建了一个比默认尺寸大 1.5 倍的图形。
3.3 根据内容自动调整尺寸
在某些情况下,我们可能希望图形尺寸能够根据内容自动调整。虽然 Matplotlib 没有直接提供这样的功能,但我们可以通过一些技巧来实现类似的效果。
import matplotlib.pyplot as plt

def auto_size_figure(data):
    data_range = max(data) - min(data)
    fig_width = max(6, data_range / 2)  # 最小宽度为6英寸
    fig_height = fig_width * 0.618  # 黄金比例
    return fig_width, fig_height

data = [1, 5, 3, 8, 4, 2, 7]
plt.figure(figsize=auto_size_figure(data))
plt.plot(data, label='how2matplotlib.com')
plt.title('Figure Size Adjusted to Data Range')
plt.legend()
plt.show()
Output:
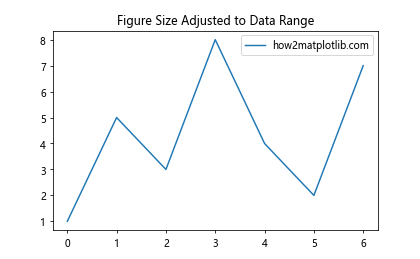
这个示例根据数据的范围来调整图形尺寸,确保数据能够合适地显示。
4. 子图和复杂布局中的尺寸设置
在创建包含多个子图或复杂布局的图形时,尺寸设置变得更加重要和复杂。
4.1 使用 subplots() 创建子图
当使用 plt.subplots() 创建子图时,我们可以直接指定整个图形的尺寸。
import matplotlib.pyplot as plt

fig, (ax1, ax2) = plt.subplots(1, 2, figsize=(12, 5))

ax1.plot([1, 2, 3, 4], [1, 4, 2, 3], label='how2matplotlib.com')
ax1.set_title('Subplot 1')
ax1.legend()

ax2.plot([1, 2, 3, 4], [3, 2, 4, 1], label='how2matplotlib.com')
ax2.set_title('Subplot 2')
ax2.legend()

plt.tight_layout()
plt.show()
Output:
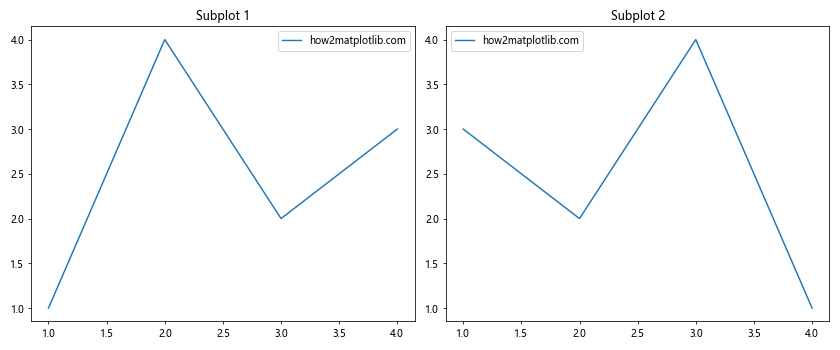
在这个示例中,我们创建了一个包含两个子图的图形,并设置整个图形的尺寸为 12 x 5 英寸。
4.2 使用 GridSpec 进行复杂布局
对于更复杂的布局,我们可以使用 GridSpec 来精确控制每个子图的位置和尺寸。
import matplotlib.pyplot as plt
import matplotlib.gridspec as gridspec

fig = plt.figure(figsize=(12, 8))
gs = gridspec.GridSpec(2, 2, width_ratios=[2, 1], height_ratios=[1, 2])

ax1 = fig.add_subplot(gs[0, 0])
ax2 = fig.add_subplot(gs[0, 1])
ax3 = fig.add_subplot(gs[1, :])

ax1.plot([1, 2, 3, 4], [1, 4, 2, 3], label='how2matplotlib.com')
ax1.set_title('Subplot 1')
ax1.legend()

ax2.plot([1, 2, 3, 4], [3, 2, 4, 1], label='how2matplotlib.com')
ax2.set_title('Subplot 2')
ax2.legend()

ax3.plot([1, 2, 3, 4, 5], [2, 4, 1, 3, 5], label='how2matplotlib.com')
ax3.set_title('Subplot 3')
ax3.legend()

plt.tight_layout()
plt.show()
Output:
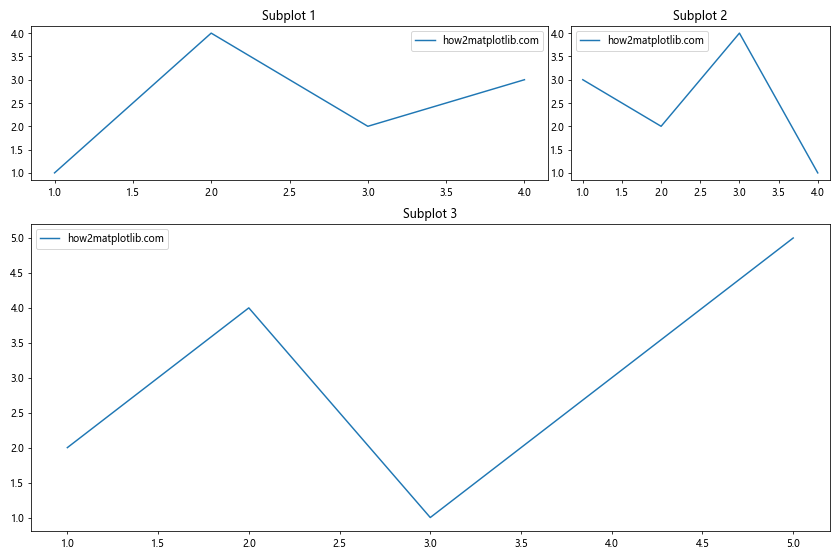
这个示例创建了一个复杂的布局,其中上半部分有两个子图,下半部分有一个跨越整个宽度的子图。
4.3 调整子图之间的间距
在处理多个子图时,调整子图之间的间距也是控制整体布局的重要部分。
import matplotlib.pyplot as plt

fig, axes = plt.subplots(2, 2, figsize=(10, 10))
fig.subplots_adjust(hspace=0.4, wspace=0.4)

for i, ax in enumerate(axes.flat):
    ax.plot([1, 2, 3, 4], [i+1, i+4, i+2, i+3], label='how2matplotlib.com')
    ax.set_title(f'Subplot {i+1}')
    ax.legend()

plt.show()
Output:
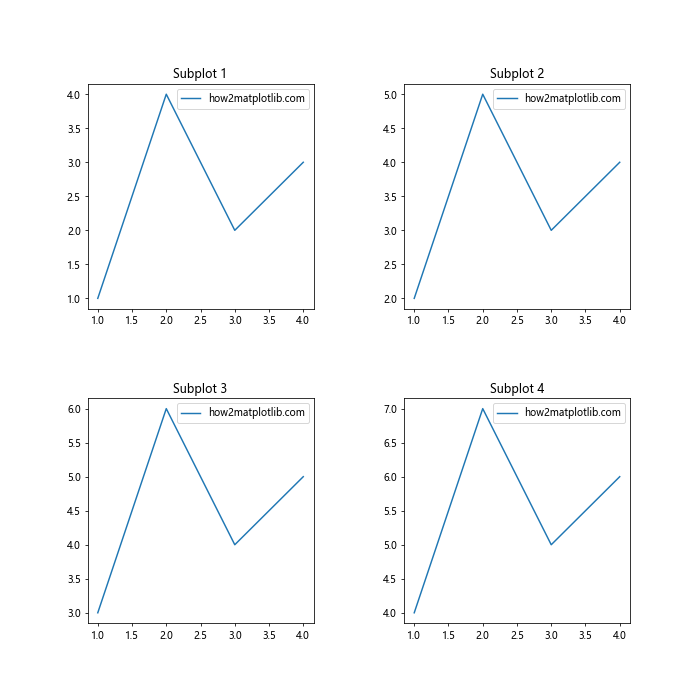
在这个示例中,我们使用 subplots_adjust() 方法来增加子图之间的水平和垂直间距。
5. 保存图形时的尺寸控制
当我们保存图形为图像文件时,图形尺寸的设置变得尤为重要,因为它直接影响输出文件的大小和质量。
5.1 保存时指定 DPI
在保存图形时,我们可以指定 DPI 来控制输出图像的分辨率。
import matplotlib.pyplot as plt

plt.figure(figsize=(8, 6))
plt.plot([1, 2, 3, 4], [1, 4, 2, 3], label='how2matplotlib.com')
plt.title('High Resolution Figure')
plt.legend()
plt.savefig('high_res_figure.png', dpi=300)
plt.close()
这个示例创建了一个 8 x 6 英寸的图形,并以 300 DPI 的分辨率保存,resulting in a high-quality image.
5.2 根据目标文件大小调整尺寸
有时我们可能需要控制输出文件的大小,特别是在网页或移动应用中使用图形时。以下是一个根据目标文件大小自动调整图形尺寸的示例:
import matplotlib.pyplot as plt
import io

def adjust_size_for_filesize(fig, target_size_kb, dpi=100, step=0.1):
    while True:
        buf = io.BytesIO()
        fig.savefig(buf, format='png', dpi=dpi)
        size_kb = buf.getbuffer().nbytes / 1024

        if size_kb <= target_size_kb:
            break

        current_size = fig.get_size_inches()
        fig.set_size_inches(current_size[0] * (1 - step), current_size[1] * (1 - step))

    return fig

fig = plt.figure(figsize=(10, 8))
plt.plot([1, 2, 3, 4], [1, 4, 2, 3], label='how2matplotlib.com')
plt.title('Figure Adjusted for Target File Size')
plt.legend()

adjusted_fig = adjust_size_for_filesize(fig, target_size_kb=100)
adjusted_fig.savefig('size_adjusted_figure.png')
plt.close()
这个示例定义了一个函数,通过迭代调整图形尺寸,直到生成的文件大小小于或等于目标大小。
6. 响应式图形尺寸
在某些情况下,我们可能需要创建能够适应不同显示环境的响应式图形。虽然 Matplotlib 本身不直接支持响应式设计,但我们可以通过一些技巧来实现类似的效果。
6.1 使用 %matplotlib widget 在 Jupyter Notebook 中创建响应式图形
在 Jupyter Notebook 中,我们可以使用 %matplotlib widget 魔法命令来创建可调整大小的交互式图形。
%matplotlib widget
import ipywidgets as widgets
import matplotlib.pyplot as plt

fig, ax = plt.subplots(figsize=(8, 6))
ax.plot([1, 2, 3, 4], [1, 4, 2, 3], label='how2matplotlib.com')
ax.set_title('Resizable Figure in Jupyter Notebook')
ax.legend()

width_slider = widgets.FloatSlider(value=8, min=4, max=12, step=0.1, description='Width:')
height_slider = widgets.FloatSlider(value=6, min=3, max=9, step=0.1, description='Height:')

def update_size(width, height):
    fig.set_size_inches(width, height)
    fig.canvas.draw()

widgets.interactive(update_size, width=width_slider, height=height_slider)
这个示例创建了一个可以通过滑块调整宽度和高度的交互式图形。
6.2 使用 FigureCanvasAgg 创建动态尺寸的图形
对于需要在程序运行时动态调整图形尺寸的情况,我们可以使用 FigureCanvasAgg。
import matplotlib.pyplot as plt
from matplotlib.backends.backend_agg import FigureCanvasAgg

def create_dynamic_figure(width, height):
    fig = plt.Figure(figsize=(width, height))
    canvas = FigureCanvasAgg(fig)
    ax = fig.add_subplot(111)
    ax.plot([1, 2, 3, 4], [1, 4, 2, 3], label='how2matplotlib.com')
    ax.set_title(f'Dynamic Figure ({width}x{height} inches)')
    ax.legend()
    return fig

# 创建不同尺寸的图形
fig1 = create_dynamic_figure(6, 4)
fig2 = create_dynamic_figure(8, 6)
fig3 = create_dynamic_figure(10, 8)

# 保存图形
fig1.savefig('dynamic_figure_small.png')
fig2.savefig('dynamic_figure_medium.png')
fig3.savefig('dynamic_figure_large.png')
这个示例展示了如何创建具有不同尺寸的动态图形。
7. 特殊图形类型的尺寸设置
某些特殊类型的图形可能需要特别注意尺寸设置,以确保最佳的视觉效果。
7.1 极坐标图的尺寸设置
极坐标图通常需要保持正方形的形状,以避免视觉扭曲。
import matplotlib.pyplot as plt
import numpy as np

fig = plt.figure(figsize=(8, 8))
ax = fig.add_subplot(111, projection='polar')

r = np.arange(0, 2, 0.01)
theta = 2 * np.pi * r

ax.plot(theta, r, label='how2matplotlib.com')
ax.set_title('Polar Plot with Square Aspect Ratio')
ax.legend()

plt.show()
Output:
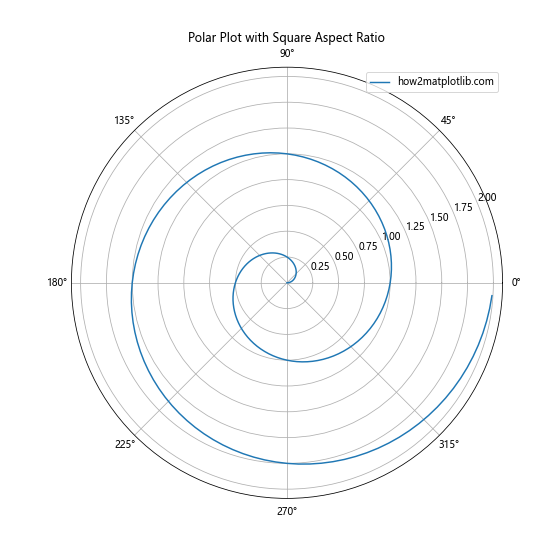
这个示例创建了一个 8×8 英寸的正方形极坐标图。
7.2 3D 图形的尺寸设置
3D 图形可能需要更大的尺寸来显示复杂的三维结构。
import matplotlib.pyplot as plt
import numpy as np
from mpl_toolkits.mplot3d import Axes3D

fig = plt.figure(figsize=(10, 8))
ax = fig.add_subplot(111, projection='3d')

x = np.linspace(-5, 5, 100)
y = np.linspace(-5, 5, 100)
X, Y = np.meshgrid(x, y)
Z = np.sin(np.sqrt(X**2 + Y**2))

surf = ax.plot_surface(X, Y, Z, cmap='viridis')
ax.set_title('3D Surface Plot')
fig.colorbar(surf, shrink=0.5, aspect=5)

plt.show()
Output:
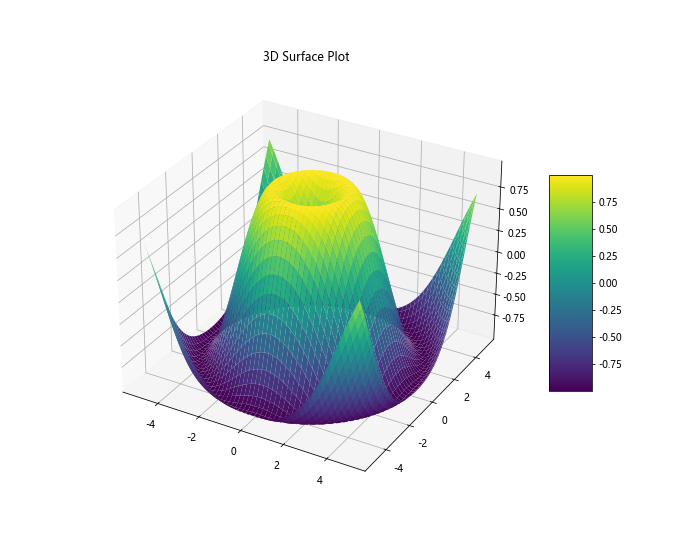
这个示例创建了一个较大尺寸的 3D 表面图,以便更好地展示三维结构。
8. 图形尺寸与性能考虑
在处理大型数据集或创建高分辨率图形时,图形尺寸可能会影响性能。
8.1 大数据集的图形尺寸优化
对于包含大量数据点的图形,可以通过调整图形尺寸和 DPI 来平衡详细度和性能。
import matplotlib.pyplot as plt
import numpy as np

def plot_large_dataset(n_points, figsize, dpi):
    plt.figure(figsize=figsize, dpi=dpi)
    x = np.random.rand(n_points)
    y = np.random.rand(n_points)
    plt.scatter(x, y, s=1, alpha=0.5)
    plt.title(f'Scatter Plot with {n_points} Points')
    plt.xlabel('X')
    plt.ylabel('Y')
    plt.text(0.5, 0.95, 'how2matplotlib.com', ha='center', va='center', transform=plt.gca().transAxes)
    plt.savefig(f'large_dataset_{n_points}_{figsize[0]}x{figsize[1]}_{dpi}dpi.png')
    plt.close()

# 不同配置
plot_large_dataset(100000, (8, 6), 100)
plot_large_dataset(100000, (12, 9), 150)
这个示例展示了如何为大型数据集调整图形尺寸和 DPI,以在文件大小和图形质量之间找到平衡。
8.2 矢量图形与位图的尺寸考虑
当需要可缩放的图形时,可以考虑使用矢量格式如 SVG,这种格式不受分辨率限制。
import matplotlib.pyplot as plt
import numpy as np

x = np.linspace(0, 10, 100)
y = np.sin(x)

plt.figure(figsize=(10, 6))
plt.plot(x, y, label='how2matplotlib.com')
plt.title('Vector vs Bitmap Comparison')
plt.legend()

# 保存为矢量图形
plt.savefig('vector_figure.svg')

# 保存为位图
plt.savefig('bitmap_figure.png', dpi=300)

plt.close()
这个示例同时保存了矢量格式和位图格式的图形,以便比较。
9. 图形尺寸的最佳实践
在实际应用中,选择合适的图形尺寸需要考虑多个因素。以下是一些最佳实践建议:
- 考虑目标媒介:根据图形将被使用的环境(如打印、屏幕显示、幻灯片等)来选择合适的尺寸。
-
保持一致性:在同一项目或报告中,尽量保持图形尺寸的一致性,除非有特殊需求。
-
考虑内容复杂度:复杂的图形可能需要更大的尺寸来清晰显示所有细节。
-
注意宽高比:某些类型的图形(如散点图)通常在正方形或接近正方形的形状下效果最佳。
-
测试不同设备:在不同的设备和分辨率下测试图形,确保在各种环境中都能正常显示。
-
使用相对尺寸:考虑使用相对于默认尺寸的比例,而不是固定的绝对尺寸。
-
平衡文件大小和质量:特别是在web应用中,需要在图形质量和文件大小之间找到平衡。
-
利用 Matplotlib 的布局工具:使用 tight_layout() 或 constrained_layout 来自动调整子图之间的间距。
-
考虑可访问性:确保图形尺寸足够大,使得文本和图例清晰可读。
-
适应不同的输出格式:根据输出格式(如 PDF、PNG、SVG 等)调整尺寸和 DPI 设置。
10. 结论
掌握 Matplotlib 中的图形尺寸设置是创建高质量数据可视化的关键技能之一。通过灵活运用本文介绍的各种技巧和方法,你可以创建出既美观又实用的图形,适应各种不同的应用场景。记住,图形尺寸的选择不仅影响视觉效果,还会影响性能和文件大小。因此,在实际应用中,需要根据具体需求和限制来权衡这些因素,找到最佳的设置。
随着数据可视化在各个领域的重要性日益增加,精通 Matplotlib 的图形尺寸控制将使你能够更好地传达数据洞察,无论是在科学研究、商业报告还是数据新闻等领域。继续探索和实践,你将能够创造出更加专业和有影响力的数据可视化作品。
 极客笔记
极客笔记