Matplotlib 图形尺寸和单位:全面掌握绘图大小控制
参考:matplotlib figure size units
Matplotlib 是 Python 中最流行的数据可视化库之一,它提供了强大而灵活的工具来创建各种类型的图表和绘图。在使用 Matplotlib 时,控制图形的尺寸和单位是一个非常重要的方面,因为它直接影响到图形的显示效果和可读性。本文将深入探讨 Matplotlib 中的图形尺寸和单位设置,帮助你全面掌握如何精确控制绘图的大小。
1. 理解 Matplotlib 中的 Figure 和 Axes
在开始讨论图形尺寸和单位之前,我们需要先了解 Matplotlib 中的两个核心概念:Figure 和 Axes。
- Figure:整个图形窗口,可以包含一个或多个 Axes。
- Axes:实际的绘图区域,包含数据、坐标轴等。
理解这两个概念对于正确设置图形尺寸至关重要。
示例代码:
import matplotlib.pyplot as plt

# 创建一个 Figure 和一个 Axes
fig, ax = plt.subplots()

# 在 Axes 上绘制一些数据
ax.plot([1, 2, 3, 4], [1, 4, 2, 3], label='Data from how2matplotlib.com')

# 添加标题和标签
ax.set_title('Simple Plot')
ax.set_xlabel('X-axis')
ax.set_ylabel('Y-axis')
ax.legend()

plt.show()
Output:
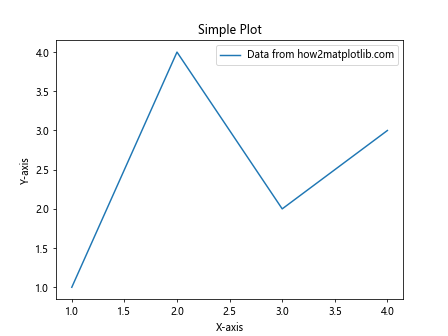
在这个例子中,我们创建了一个包含单个 Axes 的 Figure,并在其中绘制了一条简单的线。这个基本结构将贯穿本文的大部分示例。
2. 设置 Figure 的尺寸
2.1 使用 figsize 参数
最常用的设置 Figure 尺寸的方法是使用 figsize 参数。这个参数接受一个包含两个元素的元组,分别表示宽度和高度。
示例代码:
import matplotlib.pyplot as plt

# 创建一个 10x6 英寸的 Figure
fig, ax = plt.subplots(figsize=(10, 6))

ax.plot([1, 2, 3, 4], [1, 4, 2, 3], label='Data from how2matplotlib.com')
ax.set_title('Figure with Custom Size')
ax.set_xlabel('X-axis')
ax.set_ylabel('Y-axis')
ax.legend()

plt.show()
Output:
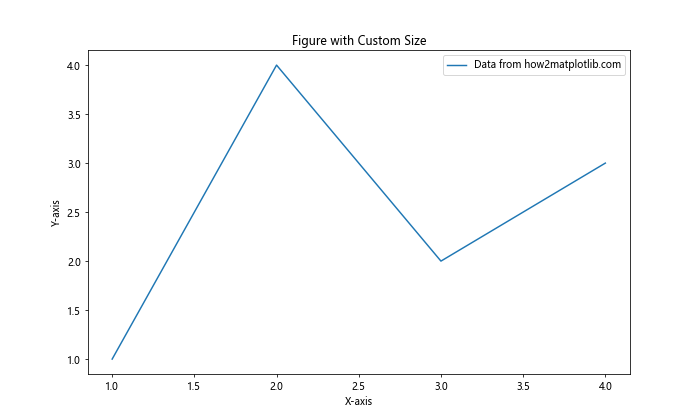
在这个例子中,我们创建了一个宽 10 英寸、高 6 英寸的 Figure。注意,figsize 的单位默认是英寸。
2.2 使用 plt.figure() 函数
另一种设置 Figure 尺寸的方法是使用 plt.figure() 函数。
示例代码:
import matplotlib.pyplot as plt

# 创建一个 8x5 英寸的 Figure
fig = plt.figure(figsize=(8, 5))

# 添加一个 Axes
ax = fig.add_subplot(111)

ax.plot([1, 2, 3, 4], [1, 4, 2, 3], label='Data from how2matplotlib.com')
ax.set_title('Figure Created with plt.figure()')
ax.set_xlabel('X-axis')
ax.set_ylabel('Y-axis')
ax.legend()

plt.show()
Output:
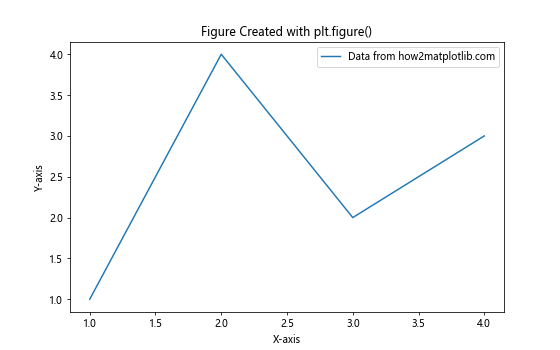
这个方法允许你先创建 Figure,然后再添加 Axes,给予更多的灵活性。
3. 理解和设置 DPI
DPI(Dots Per Inch)是另一个影响图形尺寸的重要因素。DPI 决定了每英寸包含多少像素。
3.1 设置 DPI
你可以在创建 Figure 时设置 DPI。
示例代码:
import matplotlib.pyplot as plt

# 创建一个 6x4 英寸、DPI 为 150 的 Figure
fig, ax = plt.subplots(figsize=(6, 4), dpi=150)

ax.plot([1, 2, 3, 4], [1, 4, 2, 3], label='Data from how2matplotlib.com')
ax.set_title('Figure with Custom DPI')
ax.set_xlabel('X-axis')
ax.set_ylabel('Y-axis')
ax.legend()

plt.show()
Output:
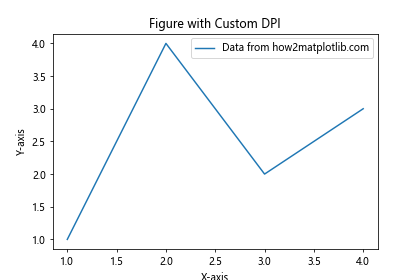
在这个例子中,我们创建了一个 6×4 英寸的 Figure,但将 DPI 设置为 150,这会使得图形在屏幕上看起来更大,因为它包含了更多的像素。
3.2 DPI 和文件大小的关系
当保存图形为图像文件时,DPI 会影响文件的大小和质量。
示例代码:
import matplotlib.pyplot as plt

fig, ax = plt.subplots(figsize=(6, 4))

ax.plot([1, 2, 3, 4], [1, 4, 2, 3], label='Data from how2matplotlib.com')
ax.set_title('Saving Figure with Different DPI')
ax.set_xlabel('X-axis')
ax.set_ylabel('Y-axis')
ax.legend()

# 保存为不同 DPI 的文件
plt.savefig('low_dpi.png', dpi=72)
plt.savefig('high_dpi.png', dpi=300)

plt.show()
Output:
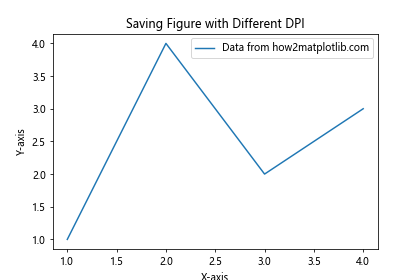
这个例子展示了如何将同一个图形保存为不同 DPI 的文件。高 DPI 的文件会有更好的质量,但文件大小也会更大。
4. 使用不同的单位
虽然 Matplotlib 默认使用英寸作为单位,但你也可以使用其他单位来设置图形尺寸。
4.1 使用厘米
你可以通过简单的换算来使用厘米作为单位。
示例代码:
import matplotlib.pyplot as plt

# 将厘米转换为英寸
cm = 1/2.54  # 1 英寸 = 2.54 厘米

# 创建一个 20x15 厘米的 Figure
fig, ax = plt.subplots(figsize=(20*cm, 15*cm))

ax.plot([1, 2, 3, 4], [1, 4, 2, 3], label='Data from how2matplotlib.com')
ax.set_title('Figure Size in Centimeters')
ax.set_xlabel('X-axis')
ax.set_ylabel('Y-axis')
ax.legend()

plt.show()
Output:
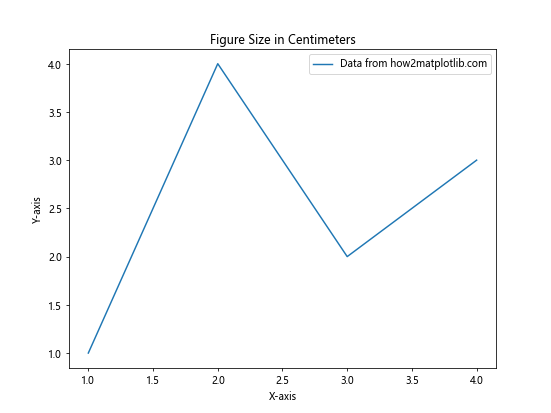
这个例子创建了一个 20×15 厘米的 Figure,通过将厘米转换为英寸来实现。
4.2 使用像素
如果你想直接指定像素大小,可以结合 DPI 设置来实现。
示例代码:
import matplotlib.pyplot as plt

# 设置目标像素大小
width_px = 800
height_px = 600
dpi = 100

# 计算 figsize
figsize = (width_px / dpi, height_px / dpi)

fig, ax = plt.subplots(figsize=figsize, dpi=dpi)

ax.plot([1, 2, 3, 4], [1, 4, 2, 3], label='Data from how2matplotlib.com')
ax.set_title('Figure Size in Pixels')
ax.set_xlabel('X-axis')
ax.set_ylabel('Y-axis')
ax.legend()

plt.show()
Output:
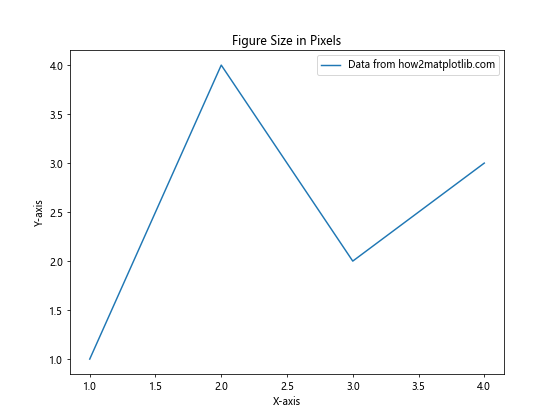
这个例子创建了一个 800×600 像素的 Figure,通过设置适当的 figsize 和 DPI 来实现。
5. 调整 Axes 的大小和位置
除了设置整个 Figure 的大小,你还可以精细地控制 Axes 的大小和位置。
5.1 使用 add_axes() 方法
add_axes() 方法允许你精确指定 Axes 在 Figure 中的位置和大小。
示例代码:
import matplotlib.pyplot as plt

fig = plt.figure(figsize=(8, 6))

# 添加一个自定义位置和大小的 Axes
ax = fig.add_axes([0.1, 0.1, 0.8, 0.8])  # [left, bottom, width, height]

ax.plot([1, 2, 3, 4], [1, 4, 2, 3], label='Data from how2matplotlib.com')
ax.set_title('Custom Axes Position')
ax.set_xlabel('X-axis')
ax.set_ylabel('Y-axis')
ax.legend()

plt.show()
Output:
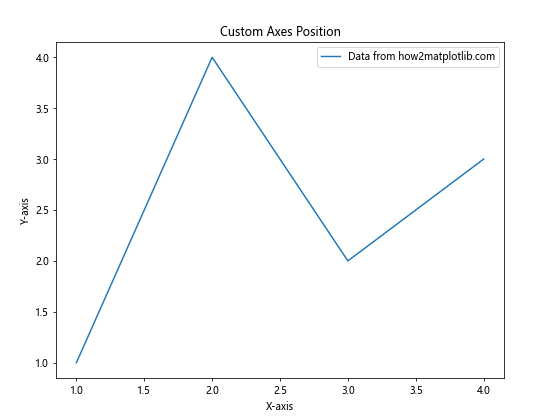
在这个例子中,我们创建了一个占据 Figure 大部分区域的 Axes。参数 [0.1, 0.1, 0.8, 0.8] 分别表示左边距、下边距、宽度和高度,都是相对于 Figure 大小的比例。
5.2 使用 tight_layout()
tight_layout() 函数可以自动调整子图之间的间距,以避免重叠。
示例代码:
import matplotlib.pyplot as plt

fig, (ax1, ax2) = plt.subplots(2, 1, figsize=(8, 8))

ax1.plot([1, 2, 3, 4], [1, 4, 2, 3], label='Data 1 from how2matplotlib.com')
ax1.set_title('Subplot 1')
ax1.legend()

ax2.plot([1, 2, 3, 4], [3, 1, 4, 2], label='Data 2 from how2matplotlib.com')
ax2.set_title('Subplot 2')
ax2.legend()

plt.tight_layout()
plt.show()
Output:
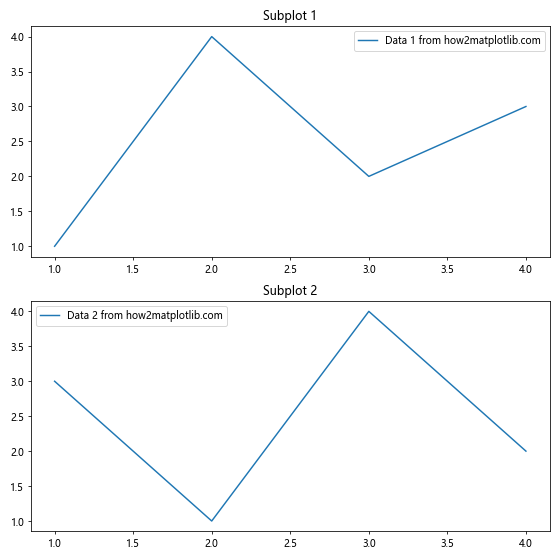
这个例子创建了两个子图,并使用 tight_layout() 来自动调整它们的布局。
6. 响应式图形尺寸
在某些情况下,你可能希望图形的尺寸能够根据显示环境自动调整。
6.1 使用 constrained_layout
constrained_layout 是一个更高级的布局管理器,它可以自动调整图形元素的大小和位置。
示例代码:
import matplotlib.pyplot as plt

fig, (ax1, ax2) = plt.subplots(1, 2, figsize=(10, 4), constrained_layout=True)

ax1.plot([1, 2, 3, 4], [1, 4, 2, 3], label='Data 1 from how2matplotlib.com')
ax1.set_title('Subplot 1')
ax1.legend()

ax2.plot([1, 2, 3, 4], [3, 1, 4, 2], label='Data 2 from how2matplotlib.com')
ax2.set_title('Subplot 2')
ax2.legend()

plt.show()
Output:
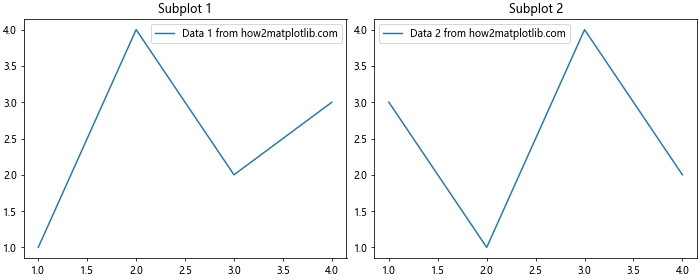
这个例子使用 constrained_layout=True 来自动调整两个子图的布局,确保它们能够适应 Figure 的大小。
6.2 使用 GridSpec
GridSpec 允许你创建更复杂的图形布局,并且可以与 constrained_layout 结合使用。
示例代码:
import matplotlib.pyplot as plt
from matplotlib.gridspec import GridSpec

fig = plt.figure(figsize=(12, 8), constrained_layout=True)
gs = GridSpec(2, 3, figure=fig)

ax1 = fig.add_subplot(gs[0, :2])
ax2 = fig.add_subplot(gs[0, 2])
ax3 = fig.add_subplot(gs[1, :])

ax1.plot([1, 2, 3, 4], [1, 4, 2, 3], label='Data 1 from how2matplotlib.com')
ax1.set_title('Subplot 1')
ax1.legend()

ax2.plot([1, 2, 3, 4], [3, 1, 4, 2], label='Data 2 from how2matplotlib.com')
ax2.set_title('Subplot 2')
ax2.legend()

ax3.plot([1, 2, 3, 4], [2, 3, 1, 4], label='Data 3 from how2matplotlib.com')
ax3.set_title('Subplot 3')
ax3.legend()

plt.show()
Output:
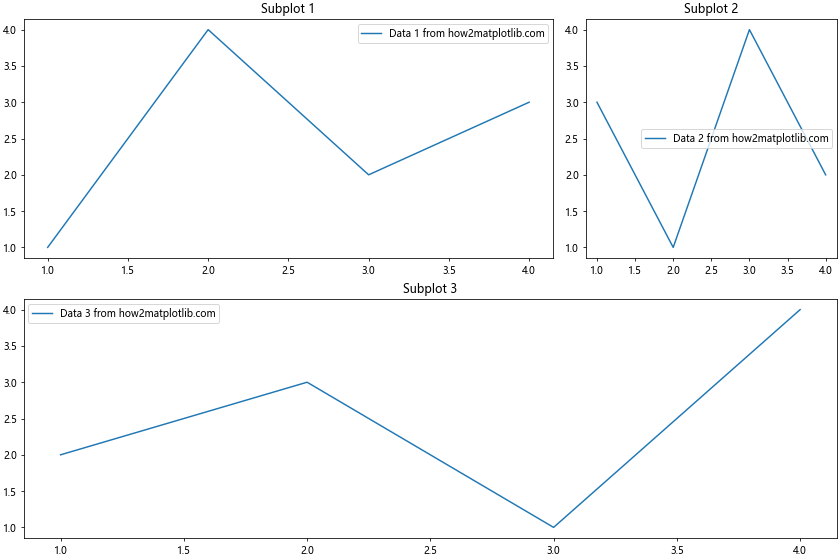
这个例子使用 GridSpec 创建了一个复杂的布局,包含三个不同大小的子图。
7. 保存图形
当你完成图形绘制后,通常需要将其保存为文件。Matplotlib 提供了多种保存图形的方式,可以控制文件格式、大小和质量。
7.1 基本保存
最简单的保存方法是使用 savefig() 函数。
示例代码:
import matplotlib.pyplot as plt

fig, ax = plt.subplots(figsize=(8, 6))

ax.plot([1, 2, 3, 4], [1, 4, 2, 3], label='Data from how2matplotlib.com')
ax.set_title('Saving Figure Example')
ax.set_xlabel('X-axis')
ax.set_ylabel('Y-axis')
ax.legend()

plt.savefig('my_plot.png')
plt.show()
Output:
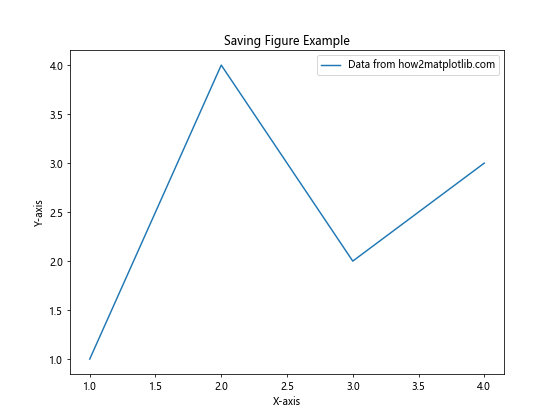
这个例子将图形保存为 PNG 文件。默认情况下,savefig() 会使用当前的 Figure 大小和 DPI 设置。
7.2 控制保存的质量和大小
你可以在保存时指定 DPI 和其他参数来控制输出文件的质量和大小。
示例代码:
import matplotlib.pyplot as plt

fig, ax = plt.subplots(figsize=(8, 6))

ax.plot([1, 2, 3, 4], [1, 4, 2, 3], label='Data from how2matplotlib.com')
ax.set_title('High Quality Figure')
ax.set_xlabel('X-axis')
ax.set_ylabel('Y-axis')
ax.legend()

plt.savefig('high_quality_plot.png', dpi=300, bbox_inches='tight', pad_inches=0.1)
plt.show()
Output:
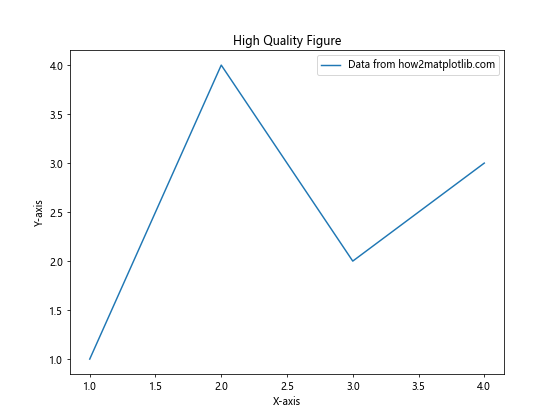
在这个例子中,我们设置了更高的 DPI 值(300),使用 bbox_inches='tight' 来裁剪多余的白边,并用 pad_inches=0.1 添加了一些内边距。
7.3 保存为不同格式
Matplotlib 支持多种图形格式,包括 PNG、JPG、SVG 和 PDF 等。
示例代码:
import matplotlib.pyplot as plt

fig, ax = plt.subplots(figsize=(8, 6))

ax.plot([1, 2, 3, 4], [1, 4, 2, 3], label='Data from how2matplotlib.com')
ax.set_title('Multi-format Saving')
ax.set_xlabel('X-axis')
ax.set_ylabel('Y-axis')
ax.legend()

# 保存为不同格式
plt.savefig('plot.png')
plt.savefig('plot.jpg')
plt.savefig('plot.svg')
plt.savefig('plot.pdf')

plt.show()
Output:
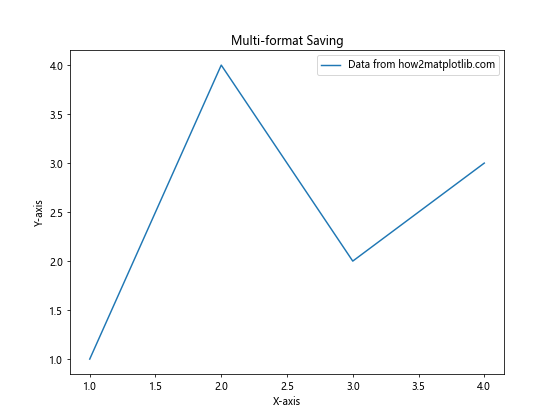
这个例子展示了如何将同一个图形保存为多种不同的文件格式。
8. 动态调整图形尺寸
有时,你可能需要在运行时动态调整图形的尺寸。Matplotlib 提供了一些方法来实现这一点。
8.1 使用 set_size_inches()
你可以使用 set_size_inches() 方法在创建图形后调整其大小。
示例代码:
import matplotlib.pyplot as plt

fig, ax = plt.subplots()

ax.plot([1, 2, 3, 4], [1, 4, 2, 3], label='Data from how2matplotlib.com')
ax.set_title('Dynamic Size Adjustment')
ax.set_xlabel('X-axis')
ax.set_ylabel('Y-axis')
ax.legend()

# 调整图形大小
fig.set_size_inches(10, 6)

plt.show()
Output:
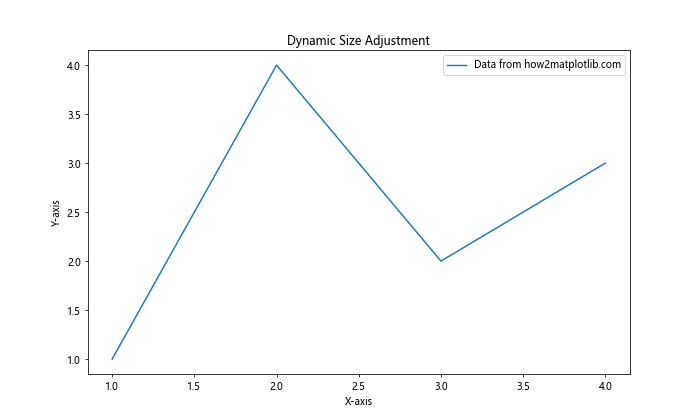
这个例子首先创建了一个默认大小的图形,然后使用 set_size_inches() 将其调整为 10×6 英寸。
8.2 响应窗口大小变化
在交互式环境中,你可能希望图形能够响应窗口大小的变化。
示例代码:
import matplotlib.pyplot as plt

def on_resize(event):
    fig = event.canvas.figure
    scale = 1.5  # 缩放因子
    fig.set_size_inches(event.width/fig.dpi/scale, event.height/fig.dpi/scale)
    fig.tight_layout()
    fig.canvas.draw()

fig, ax = plt.subplots()

ax.plot([1, 2, 3, 4], [1, 4, 2, 3], label='Data from how2matplotlib.com')
ax.set_title('Responsive Figure')
ax.set_xlabel('X-axis')
ax.set_ylabel('Y-axis')
ax.legend()

fig.canvas.mpl_connect('resize_event', on_resize)

plt.show()
Output:
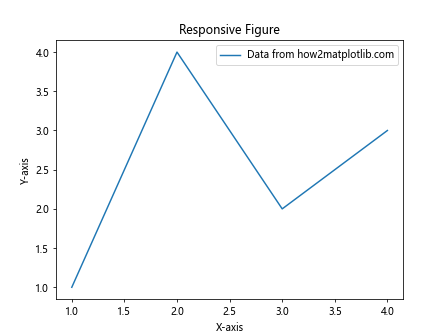
这个例子定义了一个 on_resize 函数,它会在窗口大小改变时被调用,从而动态调整图形的大小。
9. 处理高 DPI 显示器
随着高 DPI 显示器的普及,确保你的图形在这些设备上正确显示变得越来越重要。
9.1 使用 rcParams 设置
你可以使用 Matplotlib 的 rcParams 来全局设置高 DPI 支持。
示例代码:
import matplotlib.pyplot as plt
plt.rcParams['figure.dpi'] = 150
plt.rcParams['savefig.dpi'] = 300

fig, ax = plt.subplots(figsize=(8, 6))

ax.plot([1, 2, 3, 4], [1, 4, 2, 3], label='Data from how2matplotlib.com')
ax.set_title('High DPI Figure')
ax.set_xlabel('X-axis')
ax.set_ylabel('Y-axis')
ax.legend()

plt.show()
Output:
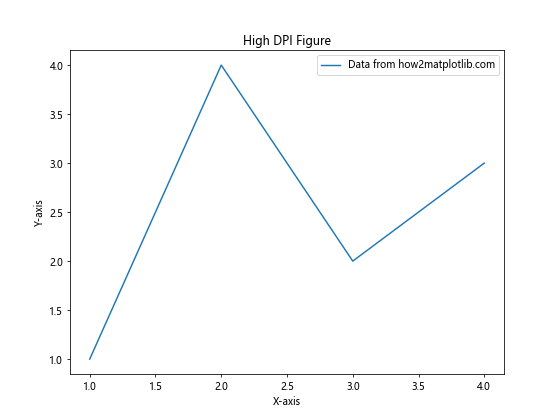
这个例子设置了更高的 DPI 值,使图形在高 DPI 显示器上看起来更清晰。
9.2 使用 bbox_inches 参数
当保存图形时,使用 bbox_inches='tight' 可以确保图形在高 DPI 显示器上正确显示,不会被裁剪。
示例代码:
import matplotlib.pyplot as plt

fig, ax = plt.subplots(figsize=(8, 6))

ax.plot([1, 2, 3, 4], [1, 4, 2, 3], label='Data from how2matplotlib.com')
ax.set_title('High DPI Saving')
ax.set_xlabel('X-axis')
ax.set_ylabel('Y-axis')
ax.legend()

plt.savefig('high_dpi_plot.png', dpi=300, bbox_inches='tight')
plt.show()
Output:
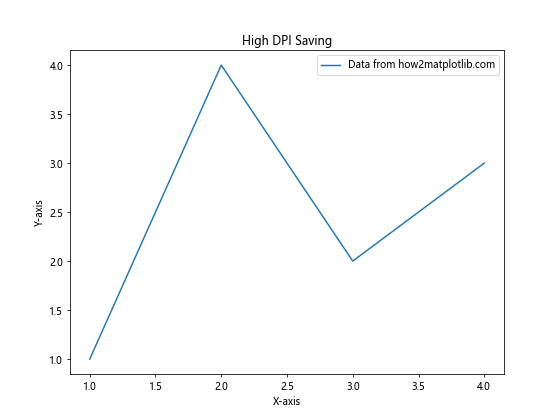
这个例子在保存图形时使用了 bbox_inches='tight',确保图形在高 DPI 设备上显示正确。
10. 结合其他库使用
Matplotlib 经常与其他数据处理和可视化库结合使用,如 NumPy 和 Pandas。在这些情况下,正确设置图形尺寸和单位尤为重要。
10.1 与 Pandas 结合使用
当使用 Pandas 绘制数据时,你可能需要调整图形大小以适应数据的复杂性。
示例代码:
import matplotlib.pyplot as plt
import pandas as pd
import numpy as np

# 创建示例数据
dates = pd.date_range('20230101', periods=100)
df = pd.DataFrame(np.random.randn(100, 4), index=dates, columns=list('ABCD'))

# 设置更大的图形尺寸
plt.figure(figsize=(12, 8))

# 绘制数据
df.plot()

plt.title('Pandas Data Visualization')
plt.xlabel('Date')
plt.ylabel('Value')
plt.legend(title='Columns from how2matplotlib.com')

plt.tight_layout()
plt.show()
Output:
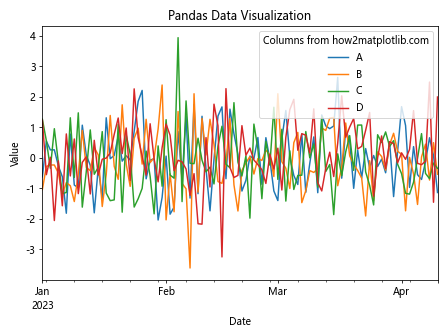
这个例子展示了如何在使用 Pandas 绘图时设置更大的图形尺寸,以便更好地展示复杂的数据。
10.2 与 Seaborn 结合使用
Seaborn 是建立在 Matplotlib 之上的统计数据可视化库。当使用 Seaborn 时,你仍然可以控制底层的 Matplotlib 图形尺寸。
示例代码:
import matplotlib.pyplot as plt
import seaborn as sns
import numpy as np

# 设置 Seaborn 样式
sns.set_style("whitegrid")

# 创建数据
x = np.linspace(0, 10, 100)
y = np.sin(x)

# 设置图形大小
plt.figure(figsize=(10, 6))

# 使用 Seaborn 绘图
sns.lineplot(x=x, y=y)

plt.title('Seaborn Plot with Custom Size')
plt.xlabel('X-axis')
plt.ylabel('Y-axis')
plt.text(5, 0, 'Data from how2matplotlib.com', ha='center')

plt.tight_layout()
plt.show()
Output:
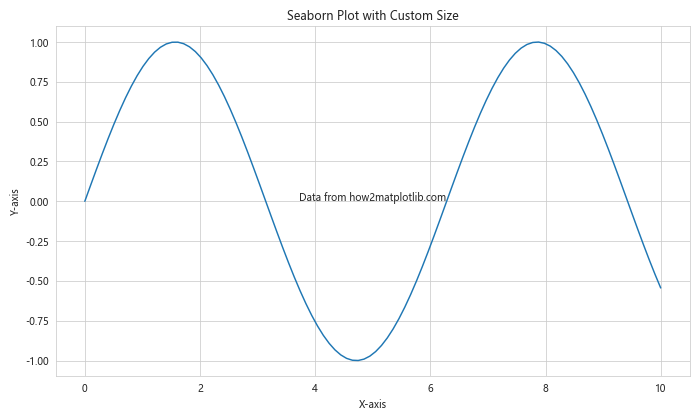
这个例子展示了如何在使用 Seaborn 绘图时设置 Matplotlib 的图形大小。
结论
掌握 Matplotlib 中的图形尺寸和单位设置是创建高质量数据可视化的关键。通过本文介绍的各种技术,你可以精确控制图形的大小、分辨率和布局,以适应不同的显示环境和输出需求。从基本的 figsize 设置到高级的响应式布局,从 DPI 调整到多格式保存,这些知识将帮助你创建既美观又实用的数据可视化作品。
记住,图形的尺寸和单位设置不仅影响视觉效果,还会影响文件大小、打印质量和在不同设备上的显示效果。因此,根据具体需求选择合适的设置至关重要。通过实践和经验,你将能够熟练运用这些技巧,创造出专业水准的数据可视化图表。
最后,随着技术的发展,特别是高 DPI 显示器的普及,保持对新趋势的关注并相应地调整你的 Matplotlib 使用策略也很重要。不断学习和实验将帮助你在数据可视化领域保持领先地位。
 极客笔记
极客笔记