Matplotlib中使用Figure.set_edgecolor()设置图形边框颜色
参考:Matplotlib.figure.Figure.set_edgecolor() in Python
Matplotlib是Python中最流行的数据可视化库之一,它提供了丰富的绘图功能和自定义选项。在Matplotlib中,Figure对象代表整个图形窗口,而set_edgecolor()方法则是用于设置Figure边框颜色的重要函数。本文将深入探讨Figure.set_edgecolor()方法的使用,包括其语法、参数、应用场景以及与其他相关函数的配合使用。
1. Figure.set_edgecolor()方法简介
Figure.set_edgecolor()方法是Matplotlib库中Figure类的一个成员函数,用于设置整个图形窗口的边框颜色。这个方法可以帮助我们自定义图形的外观,使其更加美观或者更符合特定的设计需求。
1.1 基本语法
import matplotlib.pyplot as plt

fig = plt.figure()
fig.set_edgecolor('red')
plt.plot([1, 2, 3, 4], [1, 4, 2, 3])
plt.title('How to use set_edgecolor() - how2matplotlib.com')
plt.show()
Output:
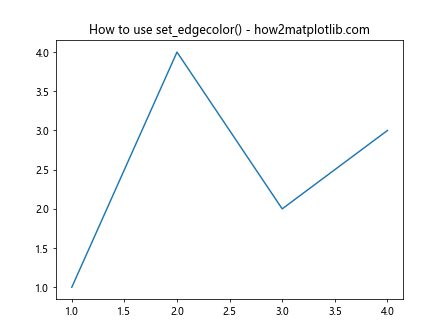
在这个例子中,我们创建了一个Figure对象,然后使用set_edgecolor()方法将其边框颜色设置为红色。这个简单的示例展示了set_edgecolor()的基本用法。
1.2 参数说明
set_edgecolor()方法接受一个参数,用于指定边框的颜色。这个参数可以是以下几种形式:
- 颜色名称字符串,如’red’、’blue’、’green’等。
- 十六进制颜色代码,如’#FF0000’表示红色。
- RGB元组,如(1, 0, 0)表示红色。
- RGBA元组,如(1, 0, 0, 1)表示不透明的红色。
2. 使用不同颜色格式
2.1 使用颜色名称
import matplotlib.pyplot as plt

fig = plt.figure()
fig.set_edgecolor('navy')
plt.plot([1, 2, 3, 4], [1, 4, 2, 3])
plt.title('Using color name - how2matplotlib.com')
plt.show()
Output:
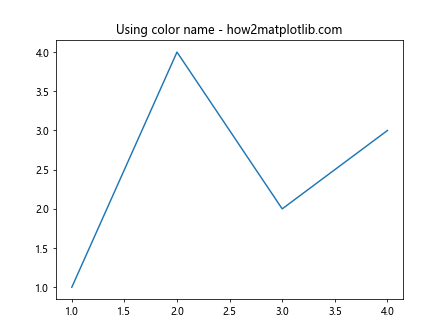
在这个例子中,我们使用颜色名称’navy’来设置Figure的边框颜色。Matplotlib支持多种标准颜色名称,使用起来非常直观。
2.2 使用十六进制颜色代码
import matplotlib.pyplot as plt

fig = plt.figure()
fig.set_edgecolor('#FF1493')
plt.plot([1, 2, 3, 4], [1, 4, 2, 3])
plt.title('Using hex color code - how2matplotlib.com')
plt.show()
Output:
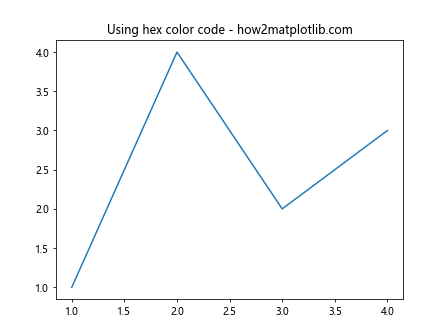
这个例子展示了如何使用十六进制颜色代码来设置边框颜色。’#FF1493’代表深粉红色。
2.3 使用RGB元组
import matplotlib.pyplot as plt

fig = plt.figure()
fig.set_edgecolor((0.5, 0.8, 0.2))
plt.plot([1, 2, 3, 4], [1, 4, 2, 3])
plt.title('Using RGB tuple - how2matplotlib.com')
plt.show()
Output:
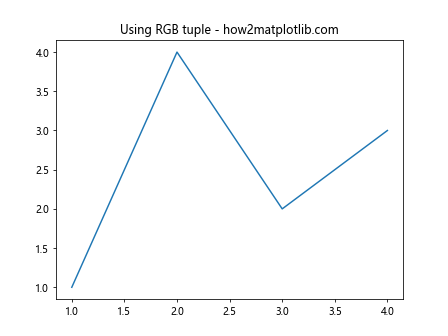
在这个例子中,我们使用RGB元组(0.5, 0.8, 0.2)来设置边框颜色。每个值都在0到1之间,分别代表红、绿、蓝三种颜色的强度。
2.4 使用RGBA元组
import matplotlib.pyplot as plt

fig = plt.figure()
fig.set_edgecolor((1, 0, 0, 0.5))
plt.plot([1, 2, 3, 4], [1, 4, 2, 3])
plt.title('Using RGBA tuple - how2matplotlib.com')
plt.show()
Output:
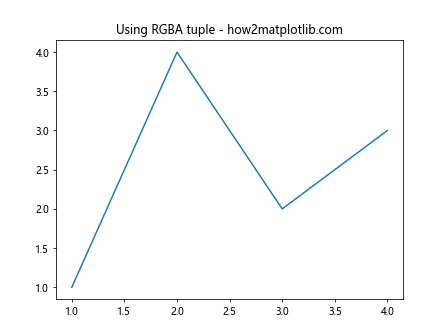
这个例子展示了如何使用RGBA元组来设置边框颜色。(1, 0, 0, 0.5)表示半透明的红色,其中最后一个值0.5表示50%的不透明度。
3. 结合其他Figure属性
3.1 设置边框宽度
import matplotlib.pyplot as plt

fig = plt.figure()
fig.set_edgecolor('purple')
fig.set_linewidth(5)
plt.plot([1, 2, 3, 4], [1, 4, 2, 3])
plt.title('Setting edge color and width - how2matplotlib.com')
plt.show()
Output:
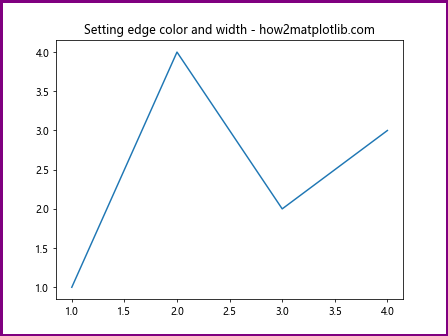
在这个例子中,我们不仅设置了边框颜色,还使用set_linewidth()方法设置了边框宽度。这样可以使边框更加明显。
3.2 设置背景颜色
import matplotlib.pyplot as plt

fig = plt.figure()
fig.set_edgecolor('black')
fig.set_facecolor('lightgray')
plt.plot([1, 2, 3, 4], [1, 4, 2, 3])
plt.title('Setting edge and face color - how2matplotlib.com')
plt.show()
Output:
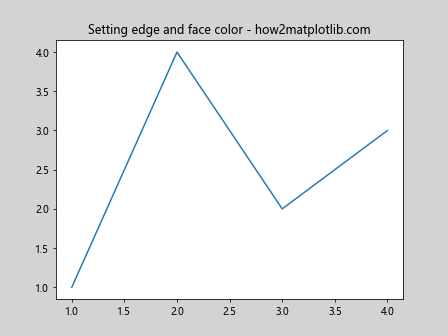
这个例子展示了如何同时设置边框颜色和背景颜色。set_facecolor()方法用于设置Figure的背景颜色。
4. 在子图中使用set_edgecolor()
4.1 单个子图
import matplotlib.pyplot as plt

fig, ax = plt.subplots()
fig.set_edgecolor('green')
fig.set_linewidth(3)
ax.plot([1, 2, 3, 4], [1, 4, 2, 3])
ax.set_title('Single subplot with edge color - how2matplotlib.com')
plt.show()
Output:
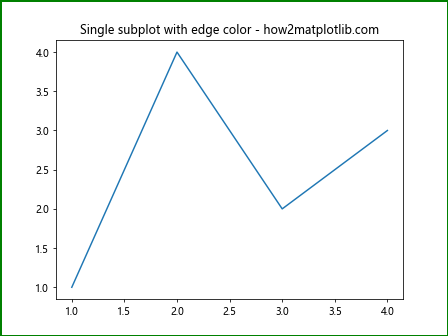
这个例子展示了如何在创建单个子图的同时设置Figure的边框颜色。
4.2 多个子图
import matplotlib.pyplot as plt

fig, (ax1, ax2) = plt.subplots(1, 2, figsize=(10, 4))
fig.set_edgecolor('orange')
fig.set_linewidth(2)
ax1.plot([1, 2, 3, 4], [1, 4, 2, 3])
ax2.plot([1, 2, 3, 4], [3, 2, 4, 1])
ax1.set_title('Subplot 1 - how2matplotlib.com')
ax2.set_title('Subplot 2 - how2matplotlib.com')
plt.tight_layout()
plt.show()
Output:
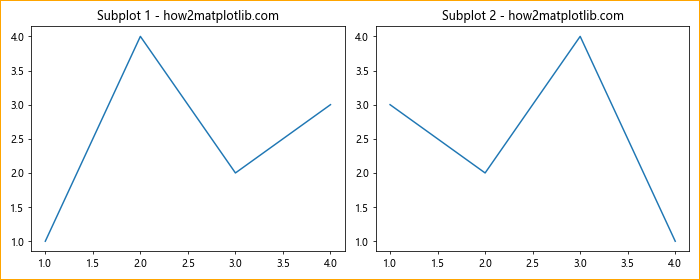
这个例子展示了如何在包含多个子图的Figure中设置边框颜色。注意,set_edgecolor()方法作用于整个Figure,而不是单个子图。
5. 动态更改边框颜色
5.1 使用循环更改颜色
import matplotlib.pyplot as plt
import time

fig, ax = plt.subplots()
colors = ['red', 'green', 'blue', 'yellow']
line, = ax.plot([1, 2, 3, 4], [1, 4, 2, 3])
ax.set_title('Dynamic edge color change - how2matplotlib.com')

for color in colors:
    fig.set_edgecolor(color)
    plt.pause(1)

plt.show()
Output:

这个例子展示了如何使用循环动态更改Figure的边框颜色。每隔一秒,边框颜色就会改变一次。
5.2 使用动画效果
import matplotlib.pyplot as plt
import matplotlib.animation as animation
import numpy as np

fig, ax = plt.subplots()
ax.set_xlim(0, 2*np.pi)
ax.set_ylim(-1, 1)
line, = ax.plot([], [])
ax.set_title('Animated plot with changing edge color - how2matplotlib.com')

def init():
    line.set_data([], [])
    return line,

def animate(i):
    x = np.linspace(0, 2*np.pi, 100)
    y = np.sin(x + i/10.0)
    line.set_data(x, y)
    fig.set_edgecolor(plt.cm.viridis(i/100))
    return line,

anim = animation.FuncAnimation(fig, animate, init_func=init, frames=100, interval=50, blit=True)
plt.show()
Output:
这个例子展示了如何使用动画效果来改变Figure的边框颜色。随着正弦波的变化,边框颜色也会随之改变。
6. 结合其他Matplotlib功能
6.1 使用样式表
import matplotlib.pyplot as plt

plt.style.use('seaborn')
fig, ax = plt.subplots()
fig.set_edgecolor('red')
fig.set_linewidth(3)
ax.plot([1, 2, 3, 4], [1, 4, 2, 3])
ax.set_title('Using style sheet with custom edge color - how2matplotlib.com')
plt.show()
这个例子展示了如何在使用Matplotlib样式表的同时自定义Figure的边框颜色。
6.2 结合图例使用
import matplotlib.pyplot as plt

fig, ax = plt.subplots()
fig.set_edgecolor('purple')
fig.set_linewidth(2)
ax.plot([1, 2, 3, 4], [1, 4, 2, 3], label='Line 1')
ax.plot([1, 2, 3, 4], [3, 2, 4, 1], label='Line 2')
ax.legend()
ax.set_title('Plot with legend and custom edge color - how2matplotlib.com')
plt.show()
Output:
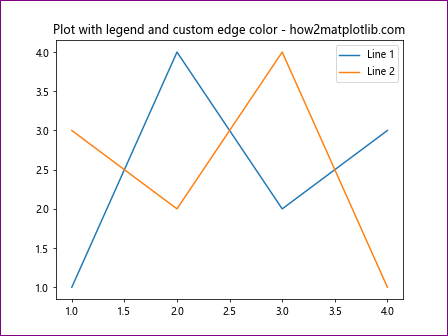
这个例子展示了如何在包含图例的图表中设置Figure的边框颜色。
7. 高级应用
7.1 使用颜色映射
import matplotlib.pyplot as plt
import numpy as np

fig, ax = plt.subplots()
x = np.linspace(0, 10, 100)
y = np.sin(x)
scatter = ax.scatter(x, y, c=y, cmap='viridis')
fig.colorbar(scatter)
fig.set_edgecolor(plt.cm.viridis(0.5))
fig.set_linewidth(3)
ax.set_title('Scatter plot with colormap and matching edge color - how2matplotlib.com')
plt.show()
Output:
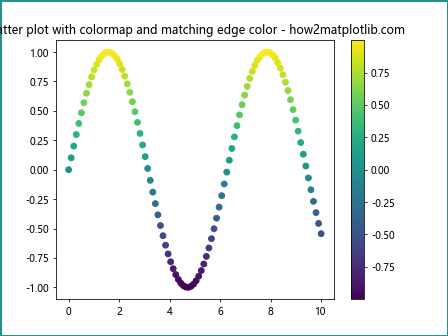
这个例子展示了如何使用颜色映射来设置散点图的颜色,并将Figure的边框颜色设置为与颜色映射相匹配的颜色。
7.2 自定义颜色函数
import matplotlib.pyplot as plt
import numpy as np

def custom_color(x):
    return (np.sin(x) + 1) / 2, (np.cos(x) + 1) / 2, 0.5

fig, ax = plt.subplots()
x = np.linspace(0, 2*np.pi, 100)
y = np.sin(x)
ax.plot(x, y)
fig.set_edgecolor(custom_color(np.pi/4))
fig.set_linewidth(3)
ax.set_title('Plot with custom color function - how2matplotlib.com')
plt.show()
Output:
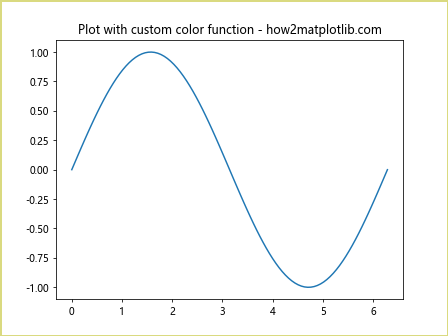
这个例子展示了如何使用自定义的颜色函数来设置Figure的边框颜色。
8. 常见问题和解决方案
8.1 边框颜色不显示
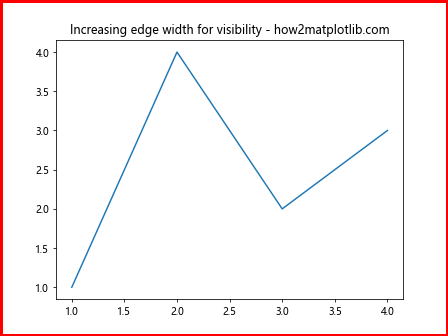
如果设置了边框颜色但没有显示,可能是因为边框宽度太小或者被其他元素覆盖了。可以尝试增加边框宽度:
import matplotlib.pyplot as plt

fig, ax = plt.subplots()
fig.set_edgecolor('red')
fig.set_linewidth(5)  # 增加边框宽度
ax.plot([1, 2, 3, 4], [1, 4, 2, 3])
ax.set_title('Increasing edge width for visibility - how2matplotlib.com')
plt.show()
Output:
8.2 边框颜色与背景冲突
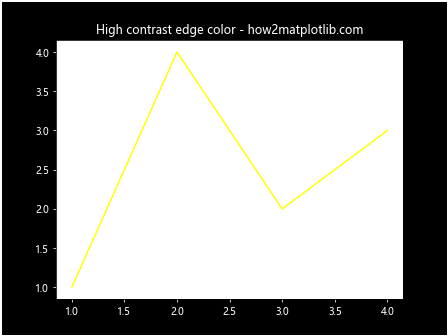
如果边框颜色与背景颜色太相似,可能难以分辨。可以尝试使用对比度更高的颜色:
import matplotlib.pyplot as plt

fig, ax = plt.subplots()
fig.set_facecolor('black')
fig.set_edgecolor('white')
fig.set_linewidth(3)
ax.plot([1, 2, 3, 4], [1, 4, 2, 3], color='yellow')
ax.set_title('High contrast edge color - how2matplotlib.com', color='white')
ax.tick_params(colors='white')
plt.show()
Output:
9. 总结
Figure.set_edgecolor()方法是Matplotlib中一个强大而灵活的工具,用于自定义图形的外观。通过本文的详细介绍和丰富的示例,我们了解了如何使用不同的颜色格式、如何结合其他Figure属性、如何在子图中应用、如何实现动态效果以及如何处理常见问题。掌握这些技巧将帮助你创建更加美观和专业的数据可视化图表。
在实际应用中,合理使用set_edgecolor()可以增强图表的视觉效果,突出重要信息,或者使图表更好地融入特定的设计主题。无论是制作学术论文的插图,还是创建商业报告的图表,灵活运用这个方法都能让你的作品更加出色。
最后,建议读者在实践中多尝试不同的颜色组合和设置,以找到最适合自己需求的方案。同时,也要注意颜色的选择对色盲读者的影响,尽量使用对比度高且易于区分的颜色组合。通过不断的练习和实验,你将能够充分发挥Matplotlib的潜力,创造出既美观又有效的数据可视化作品。
 极客笔记
极客笔记