Matplotlib中Figure.sca()方法的全面指南:如何切换和管理当前坐标轴
参考:Matplotlib.figure.Figure.sca() in Python
Matplotlib是Python中最流行的数据可视化库之一,它提供了丰富的绘图功能和灵活的API。在Matplotlib中,Figure对象是整个图形的容器,而Axes对象则代表了实际的绘图区域。在复杂的可视化任务中,我们经常需要在同一个Figure中创建多个子图,并在这些子图之间切换。这就是Figure.sca()方法发挥作用的地方。本文将深入探讨Figure.sca()方法的用法、特性和最佳实践,帮助你更好地管理和操作Matplotlib中的坐标轴。
1. Figure.sca()方法简介
Figure.sca()是Matplotlib中Figure类的一个重要方法,其全称为”set current axes”(设置当前坐标轴)。这个方法允许我们指定一个Axes对象作为当前活动的坐标轴,这意味着后续的绘图命令将作用于这个指定的坐标轴上。
1.1 基本语法
Figure.sca()方法的基本语法如下:
fig.sca(ax)
其中,fig是一个Figure对象,ax是要设置为当前坐标轴的Axes对象。
让我们看一个简单的例子:
import matplotlib.pyplot as plt

fig, (ax1, ax2) = plt.subplots(1, 2, figsize=(10, 4))
ax1.plot([1, 2, 3], [4, 5, 6], label='Line 1')
ax1.set_title('Subplot 1 - how2matplotlib.com')

fig.sca(ax2)
plt.plot([1, 2, 3], [1, 4, 9], label='Line 2')
plt.title('Subplot 2 - how2matplotlib.com')

plt.tight_layout()
plt.show()
Output:
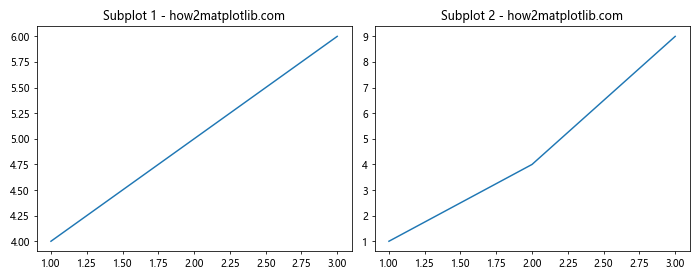
在这个例子中,我们创建了一个包含两个子图的Figure。首先,我们在ax1上绘制了一条线。然后,我们使用fig.sca(ax2)将当前坐标轴切换到ax2,并在其上绘制另一条线。注意,在切换到ax2后,我们可以直接使用plt.plot()和plt.title()等函数,它们会自动作用于当前活动的坐标轴。
2. Figure.sca()的工作原理
为了更好地理解Figure.sca()的工作原理,我们需要了解Matplotlib中的绘图状态管理机制。
2.1 当前Figure和当前Axes
Matplotlib维护了两个重要的状态:当前Figure和当前Axes。当我们调用绘图函数时,如果没有明确指定目标Figure或Axes,这些函数会默认作用于当前的Figure和Axes。
Figure.sca()方法的作用就是更新这个状态,将指定的Axes设置为当前活动的坐标轴。这样,后续的绘图命令就会自动应用到这个新设置的当前Axes上。
2.2 与pyplot接口的关系
虽然Figure.sca()是一个面向对象API的方法,但它与Matplotlib的pyplot接口有着密切的关系。当我们调用fig.sca(ax)时,它实际上也会更新pyplot接口的当前Axes状态。这就是为什么在使用fig.sca(ax)后,我们可以直接使用plt.plot()等函数而不需要显式指定Axes对象。
让我们通过一个例子来说明这一点:
import matplotlib.pyplot as plt

fig, (ax1, ax2) = plt.subplots(1, 2, figsize=(10, 4))

ax1.plot([1, 2, 3], [4, 5, 6], label='Line 1')
ax1.set_title('Subplot 1 - how2matplotlib.com')

fig.sca(ax2)
plt.plot([1, 2, 3], [1, 4, 9], label='Line 2')
plt.title('Subplot 2 - how2matplotlib.com')

print(plt.gca() == ax2)  # 输出: True

plt.tight_layout()
plt.show()
Output:
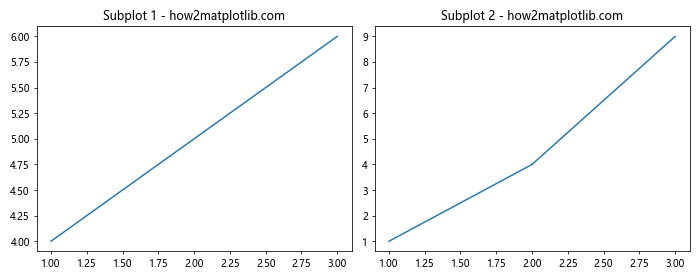
在这个例子中,我们使用fig.sca(ax2)将当前Axes设置为ax2。然后,我们使用plt.gca()(get current axes)来获取当前的Axes对象,并验证它确实是ax2。这证明了Figure.sca()方法不仅影响了Figure对象的状态,也影响了pyplot接口的状态。
3. Figure.sca()的实际应用场景
Figure.sca()方法在许多实际应用场景中都非常有用。让我们探讨一些常见的使用情况。
3.1 在多子图之间切换
最常见的应用场景是在包含多个子图的Figure中进行绘图。使用Figure.sca()可以方便地在不同的子图之间切换,而不需要每次都显式地指定目标Axes。
import matplotlib.pyplot as plt
import numpy as np

fig, (ax1, ax2, ax3) = plt.subplots(1, 3, figsize=(15, 5))

x = np.linspace(0, 10, 100)

fig.sca(ax1)
plt.plot(x, np.sin(x), label='sin(x)')
plt.title('Sine Wave - how2matplotlib.com')

fig.sca(ax2)
plt.plot(x, np.cos(x), label='cos(x)')
plt.title('Cosine Wave - how2matplotlib.com')

fig.sca(ax3)
plt.plot(x, np.tan(x), label='tan(x)')
plt.title('Tangent Wave - how2matplotlib.com')

for ax in (ax1, ax2, ax3):
    ax.legend()
    ax.grid(True)

plt.tight_layout()
plt.show()
Output:
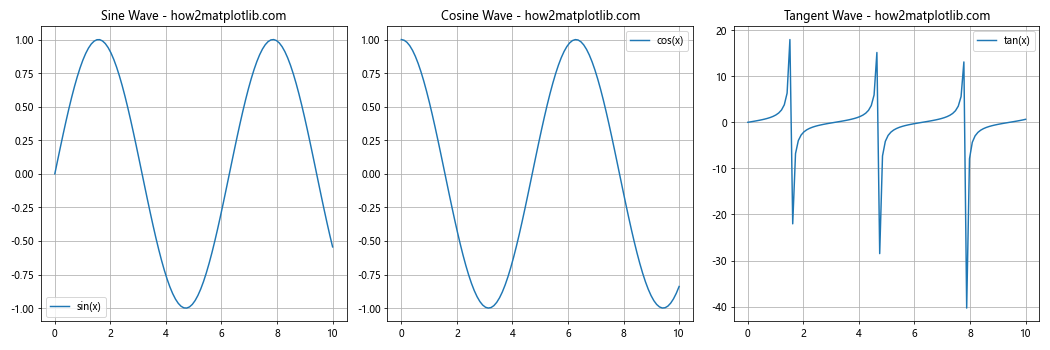
在这个例子中,我们创建了一个包含三个子图的Figure,并使用fig.sca()在它们之间切换。这使得我们可以使用pyplot接口的函数(如plt.plot()和plt.title())来绘制每个子图,而不需要显式地指定Axes对象。
3.2 在复杂布局中导航
当处理复杂的图形布局时,Figure.sca()可以帮助我们更容易地在不同的坐标轴之间导航。例如,当使用GridSpec创建不规则的子图布局时:
import matplotlib.pyplot as plt
import matplotlib.gridspec as gridspec

fig = plt.figure(figsize=(12, 8))
gs = gridspec.GridSpec(3, 3)

ax1 = fig.add_subplot(gs[0, :])
ax2 = fig.add_subplot(gs[1, :-1])
ax3 = fig.add_subplot(gs[1:, -1])
ax4 = fig.add_subplot(gs[-1, 0])
ax5 = fig.add_subplot(gs[-1, -2])

axes = [ax1, ax2, ax3, ax4, ax5]

for i, ax in enumerate(axes, 1):
    fig.sca(ax)
    plt.text(0.5, 0.5, f'Subplot {i}\nhow2matplotlib.com',
             ha='center', va='center', fontsize=12)
    plt.title(f'Title {i}')

plt.tight_layout()
plt.show()
Output:
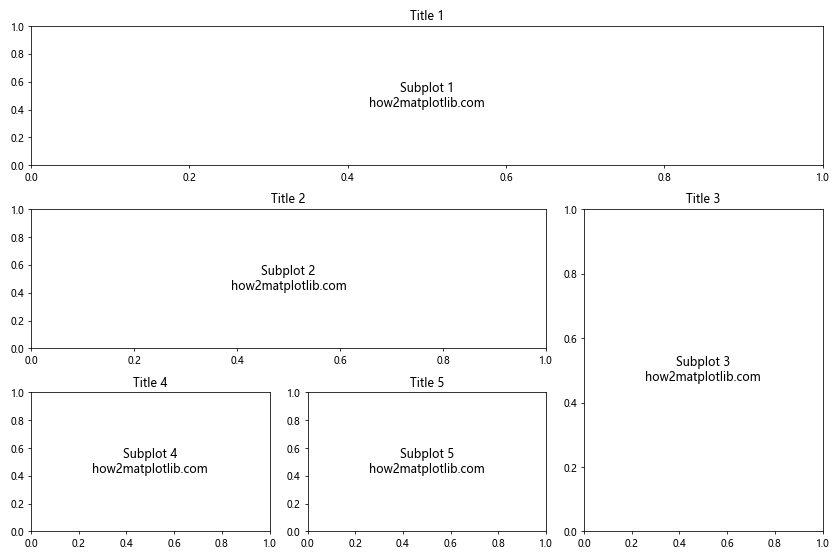
在这个例子中,我们使用GridSpec创建了一个复杂的子图布局。通过使用fig.sca(),我们可以轻松地在这些不规则排列的子图之间切换,并为每个子图添加文本和标题。
3.3 动态更新图形
Figure.sca()在创建动态更新的图形时也非常有用。例如,当我们需要在一个循环中更新多个子图时:
import matplotlib.pyplot as plt
import numpy as np

fig, (ax1, ax2) = plt.subplots(1, 2, figsize=(10, 4))

x = np.linspace(0, 10, 100)

for i in range(5):
    fig.sca(ax1)
    plt.cla()  # 清除当前坐标轴
    plt.plot(x, np.sin(x + i), label=f'sin(x + {i})')
    plt.title(f'Sine Wave {i+1} - how2matplotlib.com')
    plt.legend()

    fig.sca(ax2)
    plt.cla()  # 清除当前坐标轴
    plt.plot(x, np.cos(x + i), label=f'cos(x + {i})')
    plt.title(f'Cosine Wave {i+1} - how2matplotlib.com')
    plt.legend()

    plt.pause(0.5)  # 暂停0.5秒

plt.tight_layout()
plt.show()
Output:
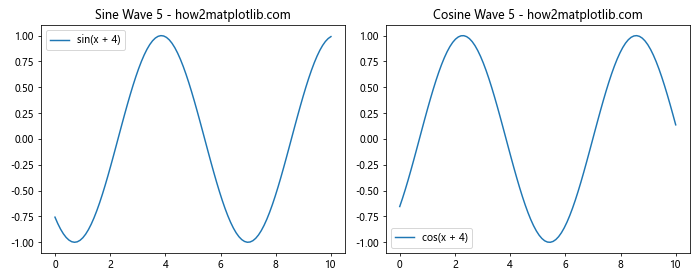
在这个例子中,我们创建了一个包含两个子图的Figure,并在一个循环中动态更新这两个子图。通过使用fig.sca(),我们可以在每次迭代中轻松地在两个子图之间切换,清除旧的内容并绘制新的内容。
4. Figure.sca()与其他相关方法的比较
为了更全面地理解Figure.sca(),我们需要将它与Matplotlib中的其他相关方法进行比较。
4.1 Figure.sca() vs plt.sca()
plt.sca()是Figure.sca()的pyplot接口版本。它们的功能基本相同,但使用方式略有不同:
import matplotlib.pyplot as plt

fig, (ax1, ax2) = plt.subplots(1, 2, figsize=(10, 4))

# 使用Figure.sca()
fig.sca(ax1)
plt.plot([1, 2, 3], [4, 5, 6], label='Line 1')
plt.title('Subplot 1 (Figure.sca) - how2matplotlib.com')

# 使用plt.sca()
plt.sca(ax2)
plt.plot([1, 2, 3], [1, 4, 9], label='Line 2')
plt.title('Subplot 2 (plt.sca) - how2matplotlib.com')

plt.tight_layout()
plt.show()
Output:
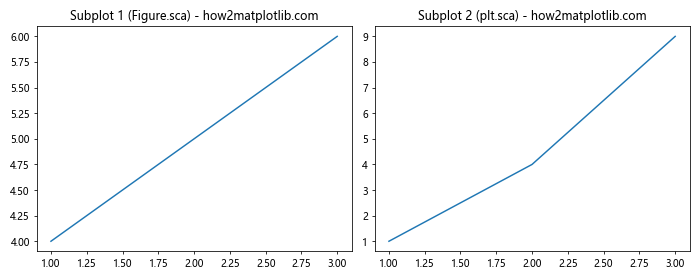
这两种方法的主要区别在于:
– Figure.sca()是面向对象风格的方法,需要先有一个Figure对象。
– plt.sca()是pyplot接口的一部分,可以直接使用,不需要显式的Figure对象。
4.2 Figure.sca() vs plt.subplot()
plt.subplot()用于创建新的子图并将其设置为当前坐标轴,而Figure.sca()用于切换到已存在的坐标轴:
import matplotlib.pyplot as plt

fig = plt.figure(figsize=(12, 4))

# 使用plt.subplot()创建并激活子图
plt.subplot(131)
plt.plot([1, 2, 3], [4, 5, 6])
plt.title('Subplot 1 (plt.subplot) - how2matplotlib.com')

plt.subplot(132)
plt.plot([1, 2, 3], [1, 4, 9])
plt.title('Subplot 2 (plt.subplot) - how2matplotlib.com')

# 创建第三个子图,但不立即使用它
ax3 = fig.add_subplot(133)

# 使用Figure.sca()切换到第三个子图
fig.sca(ax3)
plt.plot([1, 2, 3], [1, 8, 27])
plt.title('Subplot 3 (Figure.sca) - how2matplotlib.com')

plt.tight_layout()
plt.show()
Output:
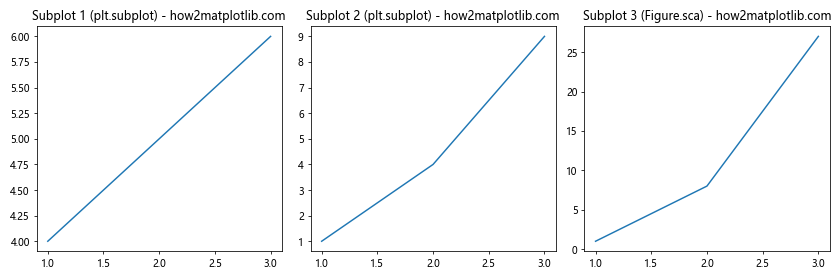
这个例子展示了plt.subplot()和Figure.sca()的不同用途:
– plt.subplot()用于创建新的子图并立即将其设置为当前坐标轴。
– Figure.sca()用于切换到已经存在的子图,使其成为当前活动的坐标轴。
4.3 Figure.sca() vs plt.axes()
plt.axes()用于在Figure中创建一个新的Axes对象,而Figure.sca()用于切换到已存在的Axes:
import matplotlib.pyplot as plt

fig = plt.figure(figsize=(12, 4))

# 使用plt.axes()创建新的Axes
ax1 = plt.axes([0.1, 0.1, 0.25, 0.8])
ax1.plot([1, 2, 3], [4, 5, 6])
ax1.set_title('Axes 1 (plt.axes) - how2matplotlib.com')

ax2 = plt.axes([0.4, 0.1, 0.25, 0.8])
ax2.plot([1, 2, 3], [1, 4, 9])
ax2.set_title('Axes 2 (plt.axes) - how2matplotlib.com')

# 创建第三个Axes,但不立即使用它
ax3 = fig.add_axes([0.7, 0.1, 0.25, 0.8])

# 使用Figure.sca()切换到第三个Axes
fig.sca(ax3)
plt.plot([1, 2, 3], [1, 8, 27])
plt.title('Axes 3 (Figure.sca) - how2matplotlib.com')

plt.show()
Output:
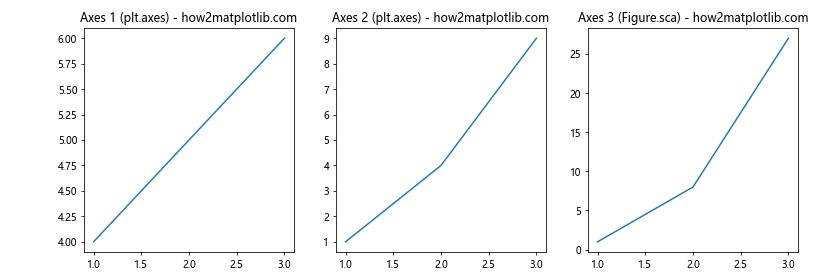
这个例子说明:
– plt.axes()用于在Figure中创建新的Axes对象,并可以指定其位置和大小。
– Figure.sca()用于切换到已经存在的Axes对象,使其成为当前活动的坐标轴。
5. Figure.sca()的高级用法
除了基本的用法外,Figure.sca()还有一些高级应用场景,可以帮助我们更灵活地管理复杂的图形。
5.1 与自定义Axes类结合使用
Matplotlib允许我们创建自定义的Axes类,以实现特殊的绘图功能。Figure.sca()可以与这些自定义Axes无缝配合:
import matplotlib.pyplot as plt
from matplotlib.axes import Axes

class MyCustomAxes(Axes):
    name = 'MyCustomAxes'

    def plot(self, *args, **kwargs):
        kwargs['linestyle'] = kwargs.get('linestyle', '--')
        return super().plot(*args, **kwargs)

fig = plt.figure(figsize=(10, 4))
ax1 = fig.add_subplot(121, projection='MyCustomAxes')
ax2 = fig.add_subplot(122)

fig.sca(ax1)
plt.plot([1, 2, 3], [4, 5, 6], label='Custom Axes')
plt.title('Custom Axes - how2matplotlib.com')

fig.sca(ax2)
plt.plot([1, 2, 3], [1, 4, 9], label='Standard Axes')
plt.title('Standard Axes - how2matplotlib.com')

plt.legend()
plt.tight_layout()
plt.show()
在这个例子中,我们创建了一个自定义的Axes类MyCustomAxes,它会将所有线条的样式设置为虚线。通过Figure.sca(),我们可以轻松地在自定义Axes和标准Axes之间切换。
5.2 在动画中使用Figure.sca()
Figure.sca()在创建动画时也非常有用,特别是当我们需要在动画的每一帧中更新多个子图时:
import matplotlib.pyplot as plt
import matplotlib.animation as animation
import numpy as np

fig, (ax1, ax2) = plt.subplots(1, 2, figsize=(10, 4))

x = np.linspace(0, 2*np.pi, 100)
line1, = ax1.plot([], [])
line2, = ax2.plot([], [])

def init():
    line1.set_data([], [])
    line2.set_data([], [])
    return line1, line2

def animate(i):
    fig.sca(ax1)
    plt.title(f'Sin Wave Frame {i} - how2matplotlib.com')
    line1.set_data(x, np.sin(x + i/10))

    fig.sca(ax2)
    plt.title(f'Cos Wave Frame {i} - how2matplotlib.com')
    line2.set_data(x, np.cos(x + i/10))

    return line1, line2

anim = animation.FuncAnimation(fig, animate, init_func=init,
                               frames=200, interval=50, blit=True)

plt.tight_layout()
plt.show()
Output:
在这个动画例子中,我们使用Figure.sca()在每一帧中切换between两个子图,分别更新正弦波和余弦波的图形。
5.3 在交互式环境中使用Figure.sca()
在Jupyter Notebook或IPython等交互式环境中,Figure.sca()可以帮助我们更方便地管理多个图形:
import matplotlib.pyplot as plt
import numpy as np

# 创建两个Figure对象
fig1, ax1 = plt.subplots()
fig2, ax2 = plt.subplots()

x = np.linspace(0, 10, 100)

# 在第一个Figure中绘图
fig1.sca(ax1)
plt.plot(x, np.sin(x))
plt.title('Sin Wave - how2matplotlib.com')

# 切换到第二个Figure并绘图
fig2.sca(ax2)
plt.plot(x, np.cos(x))
plt.title('Cos Wave - how2matplotlib.com')

# 再次切换回第一个Figure并添加新内容
fig1.sca(ax1)
plt.plot(x, np.sin(2*x), 'r--')
plt.legend(['sin(x)', 'sin(2x)'])

plt.show()
Output:
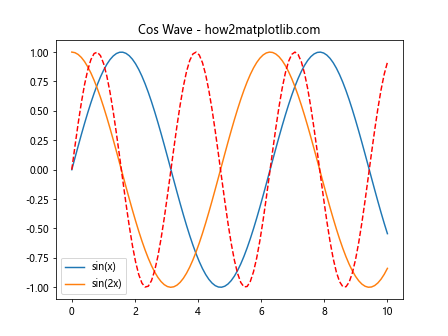
这个例子展示了如何在交互式环境中使用Figure.sca()在不同的Figure对象之间切换,并在每个Figure中进行绘图操作。
6. Figure.sca()的注意事项和最佳实践
虽然Figure.sca()是一个强大的工具,但在使用时也需要注意一些事项,并遵循一些最佳实践。
6.1 避免过度使用
虽然Figure.sca()提供了一种便捷的方式来切换当前坐标轴,但过度使用可能会导致代码难以理解和维护。在许多情况下,直接使用Axes对象的方法(如ax.plot())可能更清晰:
import matplotlib.pyplot as plt
import numpy as np

fig, (ax1, ax2) = plt.subplots(1, 2, figsize=(10, 4))

x = np.linspace(0, 10, 100)

# 使用Figure.sca()
fig.sca(ax1)
plt.plot(x, np.sin(x))
plt.title('Sin Wave (using sca) - how2matplotlib.com')

# 直接使用Axes对象
ax2.plot(x, np.cos(x))
ax2.set_title('Cos Wave (direct) - how2matplotlib.com')

plt.tight_layout()
plt.show()
Output:
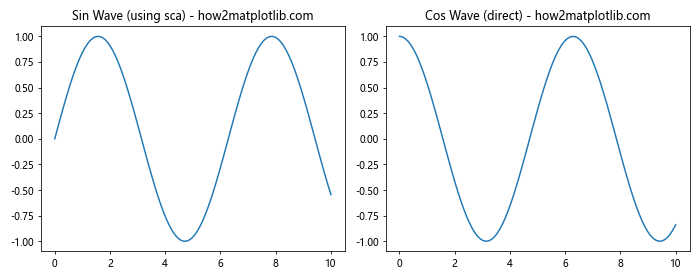
在这个例子中,两种方法都能达到相同的效果,但直接使用Axes对象的方法可能更直观。
6.2 注意状态管理
使用Figure.sca()时,要注意Matplotlib的状态管理。切换当前坐标轴后,所有的pyplot命令都会作用于新的当前坐标轴,这可能会导致意外的结果:
import matplotlib.pyplot as plt
import numpy as np

fig, (ax1, ax2) = plt.subplots(1, 2, figsize=(10, 4))

x = np.linspace(0, 10, 100)

fig.sca(ax1)
plt.plot(x, np.sin(x))
plt.title('Sin Wave - how2matplotlib.com')

fig.sca(ax2)
plt.plot(x, np.cos(x))
plt.title('Cos Wave - how2matplotlib.com')

# 这会影响ax2,而不是ax1
plt.xlabel('X axis')

plt.tight_layout()
plt.show()
Output:
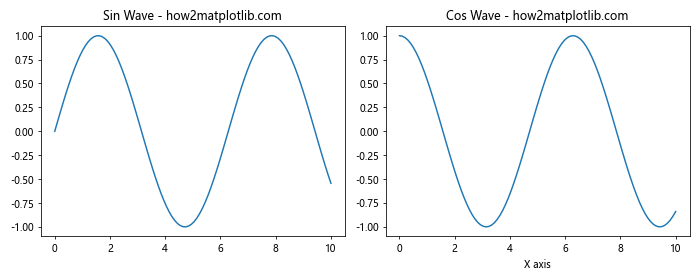
在这个例子中,最后的plt.xlabel()命令会作用于ax2,而不是ax1,因为ax2是当前活动的坐标轴。
6.3 与面向对象API结合使用
虽然Figure.sca()允许我们使用pyplot接口的函数,但在复杂的项目中,将其与面向对象的API结合使用可能会更加清晰和可维护:
import matplotlib.pyplot as plt
import numpy as np

fig, (ax1, ax2) = plt.subplots(1, 2, figsize=(10, 4))

x = np.linspace(0, 10, 100)

fig.sca(ax1)
ax1.plot(x, np.sin(x))
ax1.set_title('Sin Wave - how2matplotlib.com')
ax1.set_xlabel('X axis')
ax1.set_ylabel('Sin(x)')

fig.sca(ax2)
ax2.plot(x, np.cos(x))
ax2.set_title('Cos Wave - how2matplotlib.com')
ax2.set_xlabel('X axis')
ax2.set_ylabel('Cos(x)')

plt.tight_layout()
plt.show()
Output:
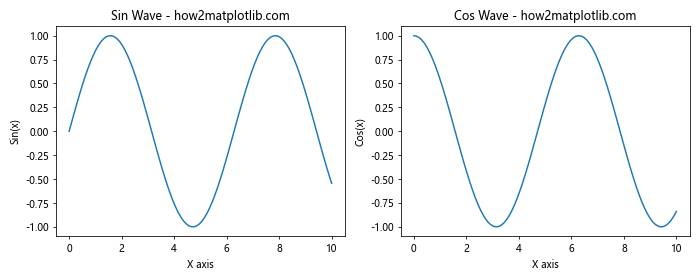
在这个例子中,我们使用Figure.sca()来切换当前坐标轴,但仍然使用Axes对象的方法来设置标题、标签等。这种混合使用的方式可以在保持代码清晰的同时,利用Figure.sca()的便利性。
7. 总结
Figure.sca()是Matplotlib中一个强大而灵活的方法,它允许我们在复杂的图形中轻松地管理和切换当前活动的坐标轴。通过本文的详细介绍,我们了解了Figure.sca()的基本用法、工作原理、实际应用场景,以及与其他相关方法的比较。
关键要点包括:
Figure.sca()用于设置当前活动的坐标轴,使后续的pyplot命令作用于指定的Axes对象。- 它在处理多子图、复杂布局和动态更新图形时特别有用。
Figure.sca()与pyplot接口和面向对象API都能很好地配合使用。- 在使用时需要注意状态管理,避免过度使用,并考虑与面向对象API结合使用以提高代码的清晰度和可维护性。
通过掌握Figure.sca()的使用,我们可以更灵活地控制Matplotlib中的图形绘制过程,创建出更复杂、更动态的数据可视化效果。无论是在科学计算、数据分析还是机器学习领域,这都是一个非常有价值的工具。
最后,建议读者在实际项目中尝试使用Figure.sca(),并结合本文提供的示例和最佳实践,以充分发挥这个方法的潜力,创造出更加丰富和专业的数据可视化作品。
 极客笔记
极客笔记