Matplotlib等高线图与图例:绘制精美地形图的完整指南
Matplotlib是Python中最流行的数据可视化库之一,它提供了强大的工具来创建各种类型的图表和可视化效果。在本文中,我们将深入探讨Matplotlib中的等高线图(contour)和图例(legend)功能,这两个功能对于绘制地形图、热力图和其他科学可视化非常有用。我们将通过详细的解释和丰富的示例代码,帮助你掌握这些技术,以创建引人注目的数据可视化作品。
1. Matplotlib等高线图基础
等高线图是一种用于表示三维表面的二维图形。它通过在平面上绘制连接相等高度点的曲线来展示三维数据。在Matplotlib中,我们可以使用contour()和contourf()函数来创建等高线图。
让我们从一个简单的例子开始:
import numpy as np
import matplotlib.pyplot as plt

# 创建数据
x = np.linspace(-5, 5, 100)
y = np.linspace(-5, 5, 100)
X, Y = np.meshgrid(x, y)
Z = np.sin(np.sqrt(X**2 + Y**2))

# 创建等高线图
plt.figure(figsize=(10, 8))
contour = plt.contour(X, Y, Z, levels=20)
plt.title('How2matplotlib.com - Simple Contour Plot')
plt.xlabel('X-axis')
plt.ylabel('Y-axis')
plt.show()
Output:
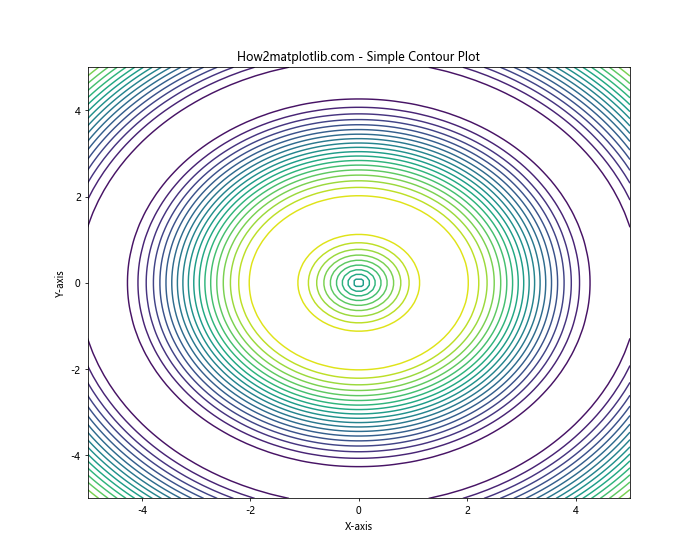
在这个例子中,我们首先创建了一个二维网格和对应的Z值。然后使用plt.contour()函数绘制等高线图。levels参数指定了等高线的数量。
2. 填充等高线图
除了线条等高线,我们还可以创建填充的等高线图,这对于表示连续的数据分布非常有用。我们可以使用contourf()函数来实现这一点:
import numpy as np
import matplotlib.pyplot as plt

x = np.linspace(-5, 5, 100)
y = np.linspace(-5, 5, 100)
X, Y = np.meshgrid(x, y)
Z = np.sin(np.sqrt(X**2 + Y**2))

plt.figure(figsize=(10, 8))
contourf = plt.contourf(X, Y, Z, levels=20, cmap='viridis')
plt.title('How2matplotlib.com - Filled Contour Plot')
plt.xlabel('X-axis')
plt.ylabel('Y-axis')
plt.colorbar(label='Z-value')
plt.show()
Output:
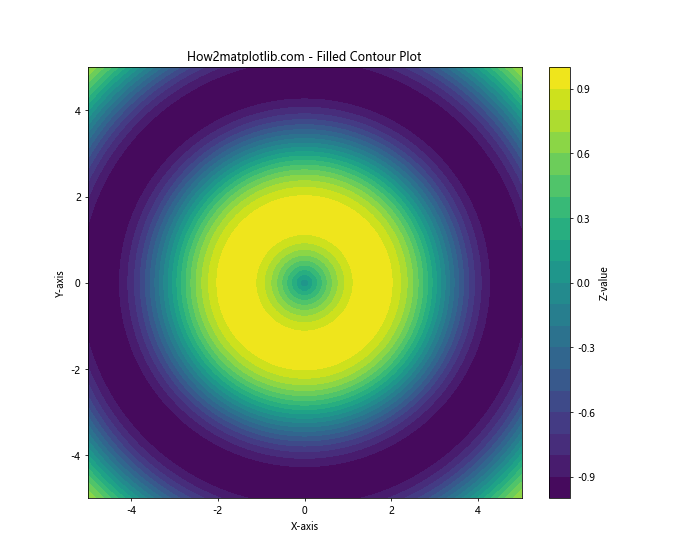
这个例子使用了contourf()函数来创建填充的等高线图。我们还添加了一个颜色条来显示Z值的范围。cmap参数用于指定颜色映射。
3. 自定义等高线级别
我们可以通过指定具体的级别值来自定义等高线:
import numpy as np
import matplotlib.pyplot as plt

x = np.linspace(-5, 5, 100)
y = np.linspace(-5, 5, 100)
X, Y = np.meshgrid(x, y)
Z = np.sin(np.sqrt(X**2 + Y**2))

plt.figure(figsize=(10, 8))
levels = [-0.5, -0.2, 0, 0.2, 0.5, 0.8]
contour = plt.contour(X, Y, Z, levels=levels)
plt.clabel(contour, inline=True, fontsize=8)
plt.title('How2matplotlib.com - Custom Contour Levels')
plt.xlabel('X-axis')
plt.ylabel('Y-axis')
plt.show()
Output:
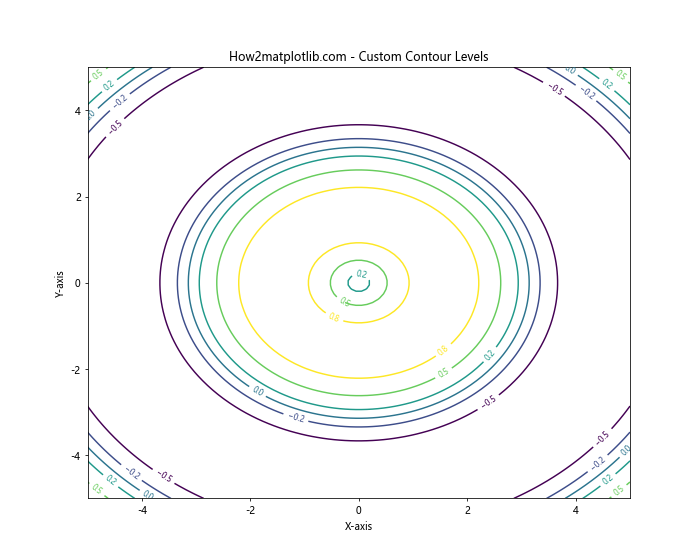
在这个例子中,我们通过levels参数指定了具体的等高线级别。plt.clabel()函数用于在等高线上添加标签。
4. 等高线图的颜色映射
颜色映射可以帮助我们更好地理解数据的分布。以下是一个使用自定义颜色映射的例子:
import numpy as np
import matplotlib.pyplot as plt

x = np.linspace(-5, 5, 100)
y = np.linspace(-5, 5, 100)
X, Y = np.meshgrid(x, y)
Z = np.sin(np.sqrt(X**2 + Y**2))

plt.figure(figsize=(10, 8))
contourf = plt.contourf(X, Y, Z, levels=20, cmap='coolwarm')
plt.title('How2matplotlib.com - Custom Color Map')
plt.xlabel('X-axis')
plt.ylabel('Y-axis')
plt.colorbar(label='Z-value')
plt.show()
Output:
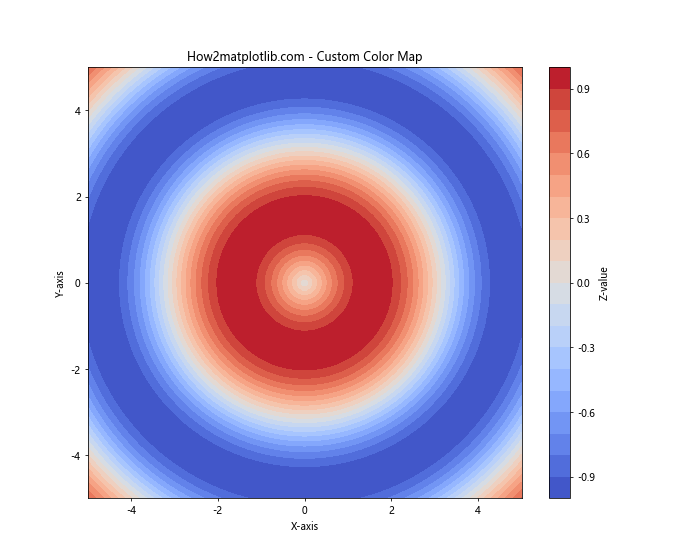
这个例子使用了’coolwarm’颜色映射,它在蓝色和红色之间过渡,非常适合表示正负值的分布。
5. 等高线图与散点图的结合
我们可以将等高线图与其他类型的图表结合,例如散点图:
import numpy as np
import matplotlib.pyplot as plt

x = np.linspace(-5, 5, 100)
y = np.linspace(-5, 5, 100)
X, Y = np.meshgrid(x, y)
Z = np.sin(np.sqrt(X**2 + Y**2))

plt.figure(figsize=(10, 8))
contour = plt.contour(X, Y, Z, levels=20, colors='k', alpha=0.5)
scatter = plt.scatter(X[::5, ::5], Y[::5, ::5], c=Z[::5, ::5], cmap='viridis')
plt.title('How2matplotlib.com - Contour with Scatter Plot')
plt.xlabel('X-axis')
plt.ylabel('Y-axis')
plt.colorbar(scatter, label='Z-value')
plt.show()
Output:
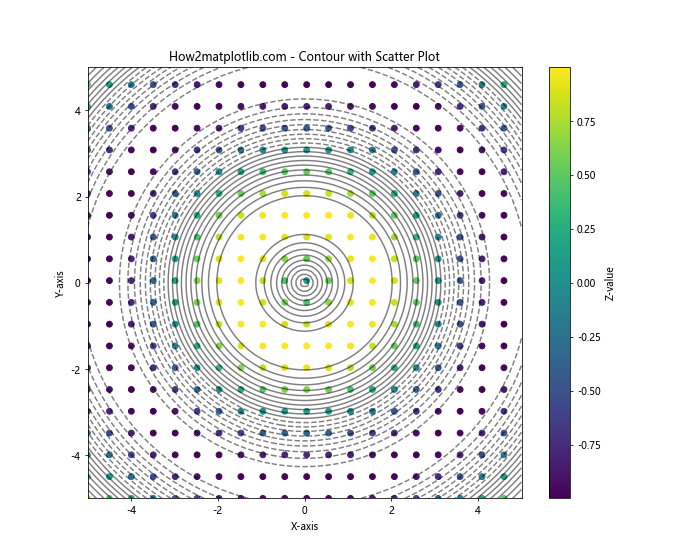
这个例子展示了如何将等高线图与散点图结合。等高线使用黑色(’k’)绘制,透明度设置为0.5。散点图使用与Z值对应的颜色。
6. 3D等高线图
Matplotlib还支持创建3D等高线图:
import numpy as np
import matplotlib.pyplot as plt
from mpl_toolkits.mplot3d import Axes3D

x = np.linspace(-5, 5, 100)
y = np.linspace(-5, 5, 100)
X, Y = np.meshgrid(x, y)
Z = np.sin(np.sqrt(X**2 + Y**2))

fig = plt.figure(figsize=(12, 8))
ax = fig.add_subplot(111, projection='3d')
contour = ax.contour(X, Y, Z, levels=20, cmap='viridis')
ax.set_title('How2matplotlib.com - 3D Contour Plot')
ax.set_xlabel('X-axis')
ax.set_ylabel('Y-axis')
ax.set_zlabel('Z-axis')
plt.show()
Output:
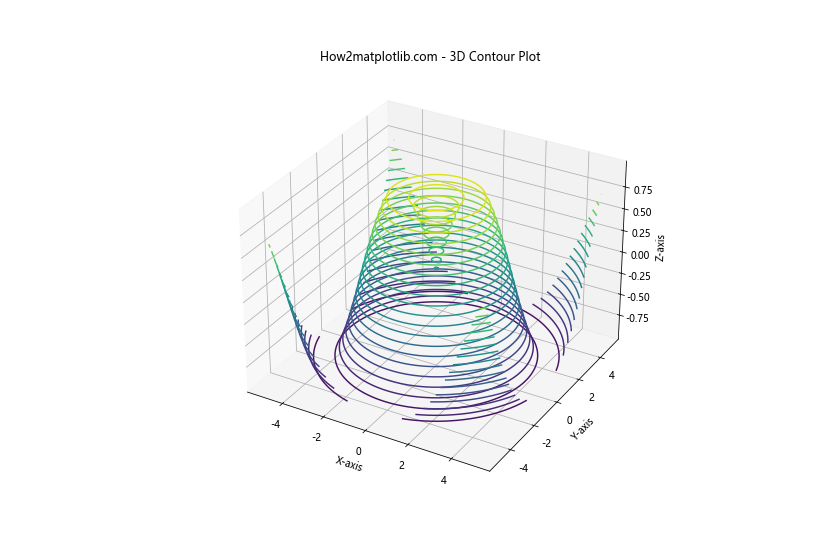
这个例子使用了mpl_toolkits.mplot3d模块来创建3D等高线图。我们使用projection='3d'参数来创建3D坐标系。
7. 图例基础
图例是解释图表中不同元素含义的重要组成部分。在Matplotlib中,我们可以使用legend()函数来添加图例:
import numpy as np
import matplotlib.pyplot as plt

x = np.linspace(0, 10, 100)
y1 = np.sin(x)
y2 = np.cos(x)

plt.figure(figsize=(10, 6))
plt.plot(x, y1, label='How2matplotlib.com - Sin')
plt.plot(x, y2, label='How2matplotlib.com - Cos')
plt.title('Trigonometric Functions')
plt.xlabel('X-axis')
plt.ylabel('Y-axis')
plt.legend()
plt.show()
Output:
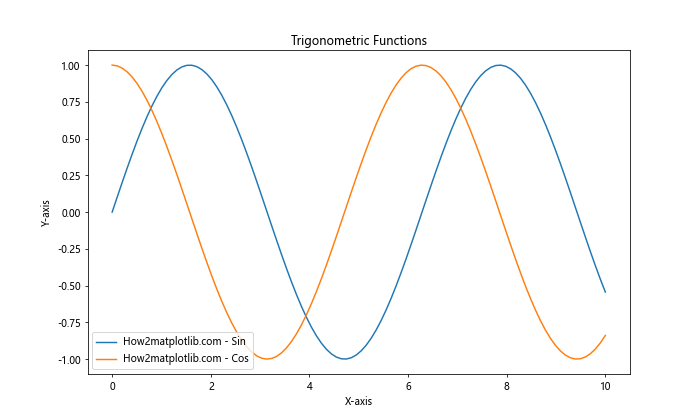
在这个例子中,我们为每条线添加了标签,然后调用plt.legend()来显示图例。
8. 自定义图例位置
我们可以通过loc参数来自定义图例的位置:
import numpy as np
import matplotlib.pyplot as plt

x = np.linspace(0, 10, 100)
y1 = np.sin(x)
y2 = np.cos(x)

plt.figure(figsize=(10, 6))
plt.plot(x, y1, label='How2matplotlib.com - Sin')
plt.plot(x, y2, label='How2matplotlib.com - Cos')
plt.title('Trigonometric Functions')
plt.xlabel('X-axis')
plt.ylabel('Y-axis')
plt.legend(loc='lower left')
plt.show()
Output:
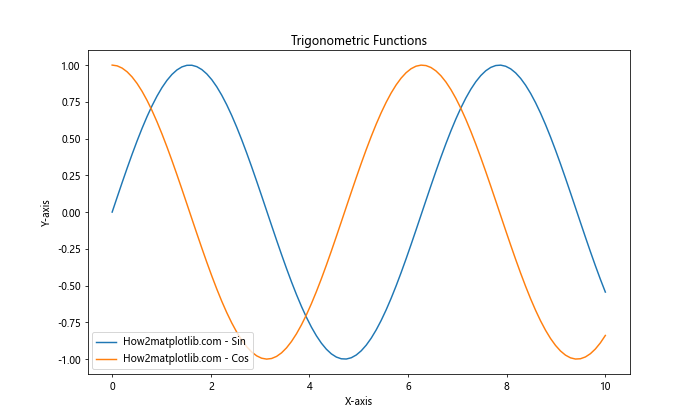
这个例子将图例放置在左下角。你可以尝试其他位置,如’upper right’、’center’等。
9. 图例样式自定义
我们可以自定义图例的样式,包括字体大小、边框颜色等:
import numpy as np
import matplotlib.pyplot as plt

x = np.linspace(0, 10, 100)
y1 = np.sin(x)
y2 = np.cos(x)

plt.figure(figsize=(10, 6))
plt.plot(x, y1, label='How2matplotlib.com - Sin')
plt.plot(x, y2, label='How2matplotlib.com - Cos')
plt.title('Trigonometric Functions')
plt.xlabel('X-axis')
plt.ylabel('Y-axis')
plt.legend(fontsize=12, frameon=True, facecolor='lightgray', edgecolor='black')
plt.show()
Output:
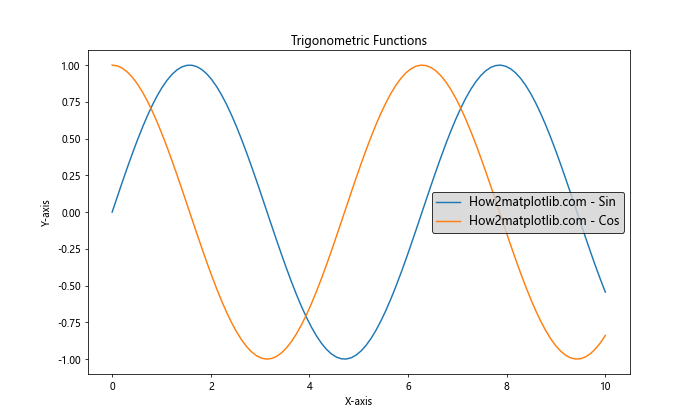
这个例子设置了图例的字体大小、背景颜色和边框颜色。
10. 等高线图的图例
对于等高线图,我们可以为不同的等高线级别添加图例:
import numpy as np
import matplotlib.pyplot as plt

x = np.linspace(-5, 5, 100)
y = np.linspace(-5, 5, 100)
X, Y = np.meshgrid(x, y)
Z = np.sin(np.sqrt(X**2 + Y**2))

plt.figure(figsize=(10, 8))
levels = [-0.5, 0, 0.5]
contour = plt.contour(X, Y, Z, levels=levels)
plt.clabel(contour, inline=True, fontsize=8)
plt.title('How2matplotlib.com - Contour Plot with Legend')
plt.xlabel('X-axis')
plt.ylabel('Y-axis')
plt.colorbar(contour, label='Z-value')
plt.legend(contour.collections, ['Low', 'Medium', 'High'], loc='lower right')
plt.show()
Output:
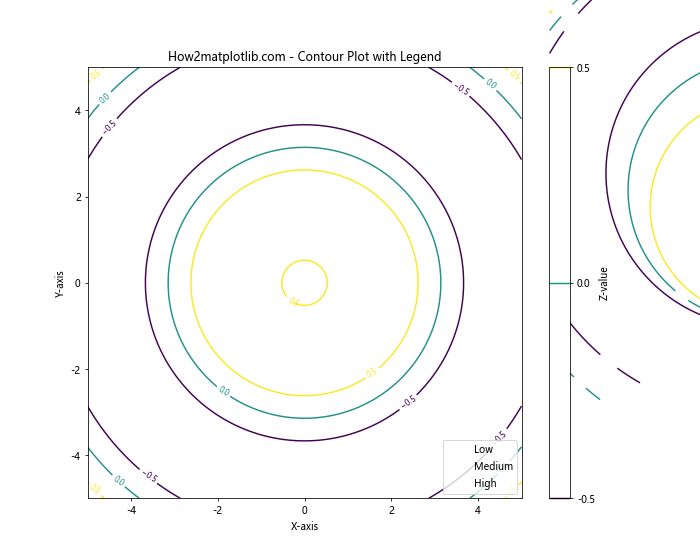
这个例子为三个不同的等高线级别添加了图例。
11. 多图例
有时我们需要在一个图表中显示多个图例:
import numpy as np
import matplotlib.pyplot as plt

x = np.linspace(0, 10, 100)
y1 = np.sin(x)
y2 = np.cos(x)
y3 = np.tan(x)

fig, ax = plt.subplots(figsize=(10, 6))
line1, = ax.plot(x, y1, label='How2matplotlib.com - Sin')
line2, = ax.plot(x, y2, label='How2matplotlib.com - Cos')
line3, = ax.plot(x, y3, label='How2matplotlib.com - Tan')

first_legend = ax.legend(handles=[line1, line2], loc='upper left')
ax.add_artist(first_legend)
ax.legend(handles=[line3], loc='lower right')

plt.title('Trigonometric Functions')
plt.xlabel('X-axis')
plt.ylabel('Y-axis')
plt.show()
Output:
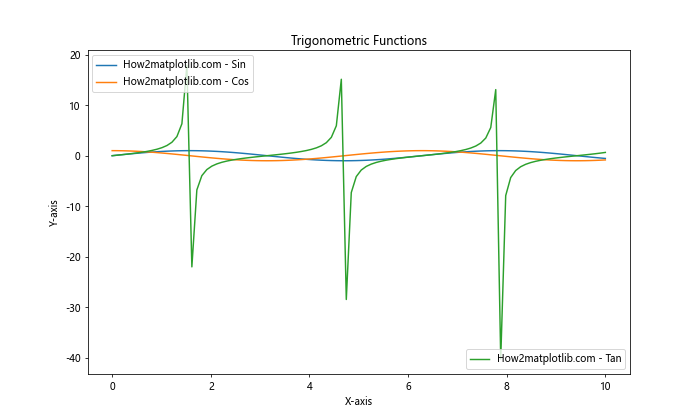
这个例子展示了如何在图表的不同位置添加多个图例。
12. 等高线图与散点图的组合图例
当我们将等高线图与散点图结合时,可能需要为两种图表元素添加图例:
import numpy as np
import matplotlib.pyplot as plt

x = np.linspace(-5, 5, 100)
y = np.linspace(-5, 5, 100)
X, Y = np.meshgrid(x, y)
Z = np.sin(np.sqrt(X**2 + Y**2))

fig, ax = plt.subplots(figsize=(10, 8))
contour = ax.contour(X, Y, Z, levels=[-0.5, 0, 0.5], colors=['blue', 'green', 'red'])
scatter = ax.scatter(X[::10, ::10], Y[::10, ::10], c=Z[::10, ::10], cmap='viridis', s=20)

ax.set_title('How2matplotlib.com - Contour and Scatter Plot')
ax.set_xlabel('X-axis')
ax.set_ylabel('Y-axis')

contour_legend = ax.legend(contour.collections, ['Low', 'Medium', 'High'], loc='lower left')
ax.add_artist(contour_legend)
scatter_legend = ax.legend(*scatter.legend_elements(), loc='lower right', title="Z values")

plt.show()
Output:
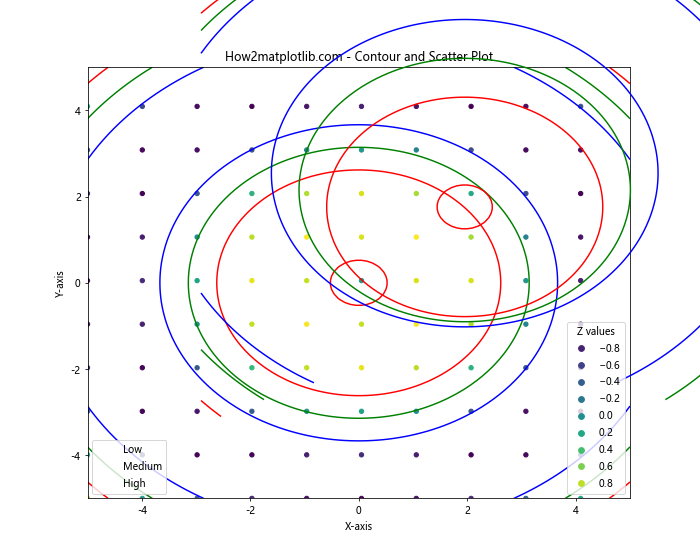
这个例子展示了如何为等高线和散点图分别添加图例。
13. 自定义图例标记
我们可以自定义图例中的标记样式:
import numpy as np
import matplotlib.pyplot as plt

x = np.linspace(0, 10, 100)
y1 = np.sin(x)
y2 = np.cos(x)

fig, ax = plt.subplots(figsize=(10, 6))
ax.plot(x, y1, label='How2matplotlib.com - Sin')
ax.plot(x, y2, label='How2matplotlib.com - Cos')

legend = ax.legend()
legend.get_frame().set_facecolor('lightgray')
for text in legend.get_texts():
    text.set_fontweight('bold')

plt.title('Trigonometric Functions')
plt.xlabel('X-axis')
plt.ylabel('Y-axis')
plt.show()
Output:
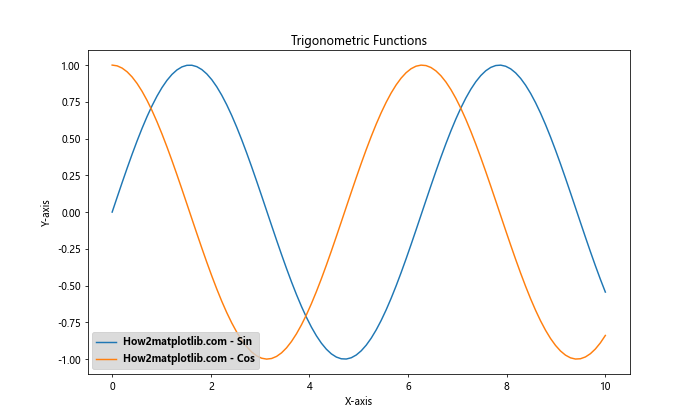
这个例子展示了如何更改图例的背景颜色和文本样式。
14. 图例中添加自定义元素
有时我们可能需要在图例中添加一些自定义元素:
import numpy as np
import matplotlib.pyplot as plt
from matplotlib.patches import Rectangle

x = np.linspace(0, 10, 100)
y1 = np.sin(x)
y2 = np.cos(x)

fig, ax = plt.subplots(figsize=(10, 6))
ax.plot(x, y1, label='How2matplotlib.com - Sin')
ax.plot(x, y2, label='How2matplotlib.com - Cos')

extra = Rectangle((0, 0), 1, 1, fc="w", fill=False, edgecolor='none', linewidth=0)
ax.legend([extra, extra], ("Extra Label 1", "Extra Label 2"), loc="center right")

plt.title('Trigonometric Functions with Extra Labels')
plt.xlabel('X-axis')
plt.ylabel('Y-axis')
plt.show()
Output:
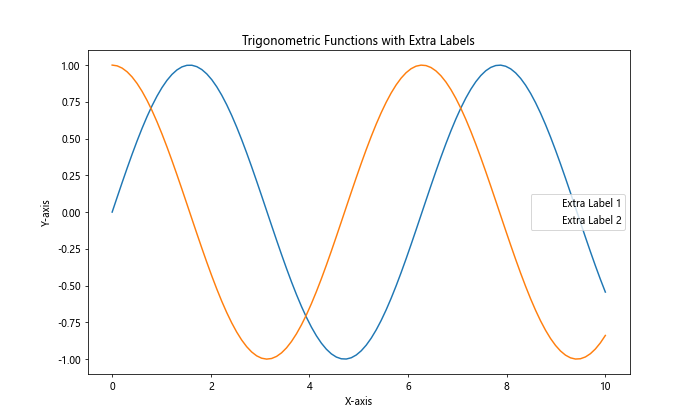
这个例子展示了如何在图例中添加额外的标签,而不需要对应的图形元素。
15. 等高线图的颜色条作为图例
对于等高线图,我们可以使用颜色条作为图例:
import numpy as np
import matplotlib.pyplot as plt

x = np.linspace(-5, 5, 100)
y = np.linspace(-5, 5, 100)
X, Y = np.meshgrid(x, y)
Z = np.sin(np.sqrt(X**2 + Y**2))

plt.figure(figsize=(10, 8))
contourf = plt.contourf(X, Y, Z, levels=20, cmap='viridis')
plt.title('How2matplotlib.com - Contour Plot with Colorbar')
plt.xlabel('X-axis')
plt.ylabel('Y-axis')
cbar = plt.colorbar(label='Z-value')
cbar.set_ticks([-1, -0.5, 0, 0.5, 1])
cbar.set_ticklabels(['Very Low', 'Low', 'Medium', 'High', 'Very High'])
plt.show()
Output:
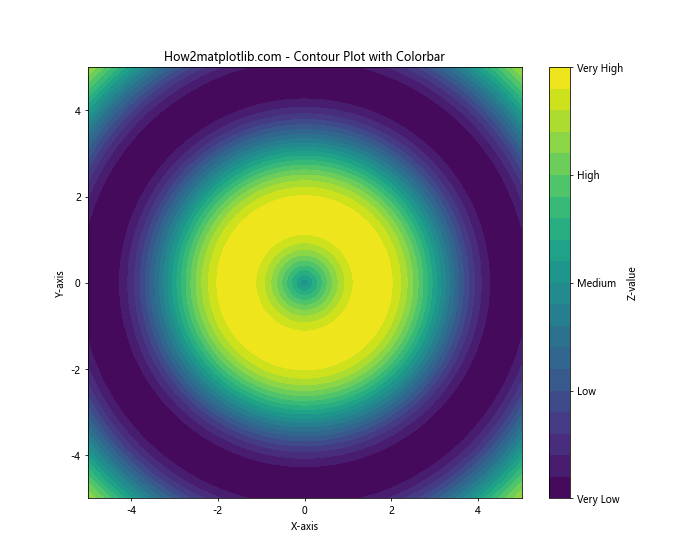
这个例子展示了如何自定义颜色条的刻度和标签,使其成为一个有意义的图例。
16. 图例中显示误差范围
在某些情况下,我们可能需要在图例中显示误差范围:
import numpy as np
import matplotlib.pyplot as plt

x = np.linspace(0, 10, 50)
y = np.sin(x)
yerr = 0.1 + 0.2 * np.random.rand(len(x))

fig, ax = plt.subplots(figsize=(10, 6))
ax.errorbar(x, y, yerr=yerr, fmt='o', label='How2matplotlib.com - Data')
ax.plot(x, y, 'r-', label='How2matplotlib.com - Fit')

ax.legend()
ax.set_title('Data with Error Bars')
ax.set_xlabel('X-axis')
ax.set_ylabel('Y-axis')

plt.show()
Output:
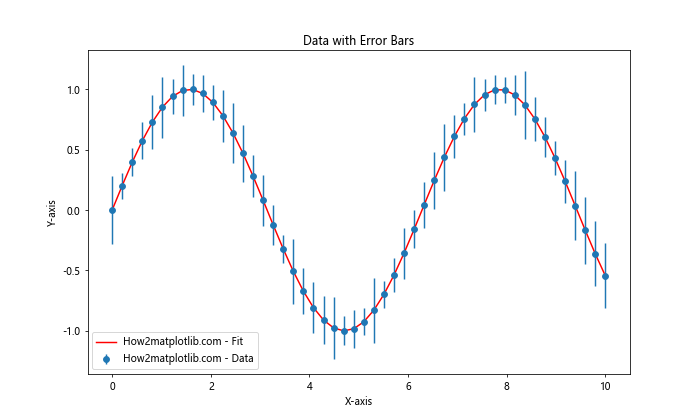
这个例子展示了如何在图例中包含带有误差棒的数据点。
17. 图例框架的自定义
我们可以进一步自定义图例的框架样式:
import numpy as np
import matplotlib.pyplot as plt

x = np.linspace(0, 10, 100)
y1 = np.sin(x)
y2 = np.cos(x)

fig, ax = plt.subplots(figsize=(10, 6))
ax.plot(x, y1, label='How2matplotlib.com - Sin')
ax.plot(x, y2, label='How2matplotlib.com - Cos')

legend = ax.legend(fancybox=True, shadow=True, borderpad=1)
frame = legend.get_frame()
frame.set_facecolor('lightgray')
frame.set_edgecolor('black')

plt.title('Trigonometric Functions with Fancy Legend')
plt.xlabel('X-axis')
plt.ylabel('Y-axis')
plt.show()
Output:
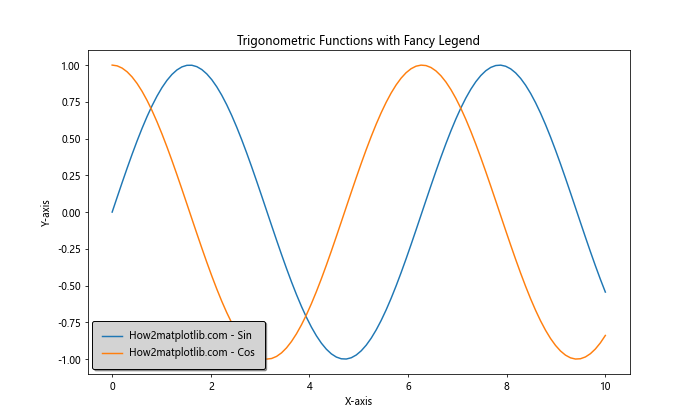
这个例子展示了如何创建一个带有阴影和自定义边框的”花哨”图例。
18. 等高线图与热力图的结合
我们可以将等高线图与热力图结合,并为两者添加图例:
import numpy as np
import matplotlib.pyplot as plt

x = np.linspace(-5, 5, 100)
y = np.linspace(-5, 5, 100)
X, Y = np.meshgrid(x, y)
Z = np.sin(np.sqrt(X**2 + Y**2))

fig, ax = plt.subplots(figsize=(10, 8))
im = ax.imshow(Z, extent=[-5, 5, -5, 5], origin='lower', cmap='viridis')
cs = ax.contour(X, Y, Z, colors='white', alpha=0.5)
ax.clabel(cs, inline=True, fontsize=8)

plt.title('How2matplotlib.com - Contour Plot with Heatmap')
plt.xlabel('X-axis')
plt.ylabel('Y-axis')

cbar = plt.colorbar(im, label='Z-value')
ax.legend([cs.collections[0]], ['Contour Lines'], loc='lower right')

plt.show()
这个例子展示了如何将等高线图叠加在热力图上,并为两者添加图例。
19. 动态图例
在某些情况下,我们可能需要动态更新图例:
import numpy as np
import matplotlib.pyplot as plt

x = np.linspace(0, 10, 100)
y1 = np.sin(x)
y2 = np.cos(x)

fig, ax = plt.subplots(figsize=(10, 6))
line1, = ax.plot(x, y1, label='How2matplotlib.com - Sin')
line2, = ax.plot(x, y2, label='How2matplotlib.com - Cos')

leg = ax.legend(loc='upper right')

def update(frame):
    line1.set_ydata(np.sin(x + frame/10))
    line2.set_ydata(np.cos(x + frame/10))
    leg.get_texts()[0].set_text(f'How2matplotlib.com - Sin (Phase: {frame/10:.2f})')
    leg.get_texts()[1].set_text(f'How2matplotlib.com - Cos (Phase: {frame/10:.2f})')
    return line1, line2

from matplotlib.animation import FuncAnimation
ani = FuncAnimation(fig, update, frames=np.linspace(0, 20*np.pi, 200),
                    interval=50, blit=True)

plt.title('Dynamic Legend Example')
plt.xlabel('X-axis')
plt.ylabel('Y-axis')
plt.show()
Output:
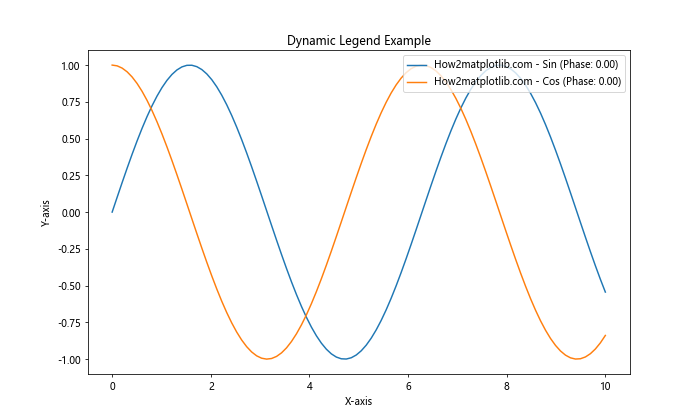
这个例子展示了如何创建一个动画,其中图例的文本会随着图形的更新而变化。
20. 多子图的图例
当我们有多个子图时,可能需要为每个子图添加单独的图例:
import numpy as np
import matplotlib.pyplot as plt

x = np.linspace(0, 10, 100)
y1 = np.sin(x)
y2 = np.cos(x)
y3 = np.tan(x)

fig, (ax1, ax2, ax3) = plt.subplots(3, 1, figsize=(10, 15))

ax1.plot(x, y1, label='How2matplotlib.com - Sin')
ax1.legend()
ax1.set_title('Sine Function')

ax2.plot(x, y2, label='How2matplotlib.com - Cos')
ax2.legend()
ax2.set_title('Cosine Function')

ax3.plot(x, y3, label='How2matplotlib.com - Tan')
ax3.legend()
ax3.set_title('Tangent Function')

plt.tight_layout()
plt.show()
Output:
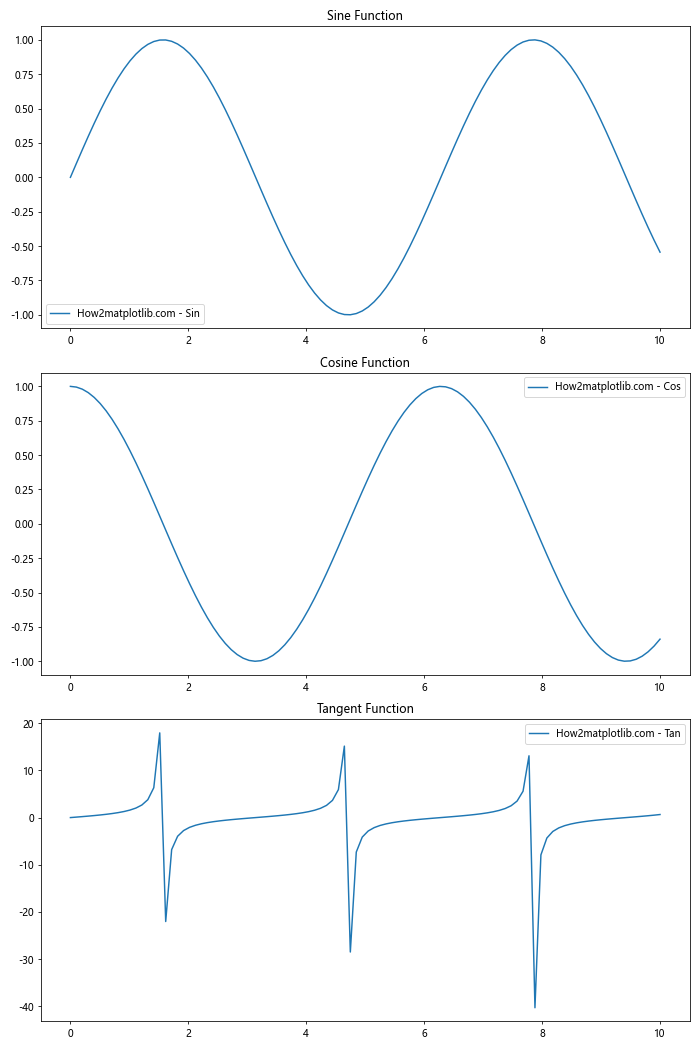
这个例子展示了如何为多个子图分别添加图例。
总结:
在这篇详细的指南中,我们深入探讨了Matplotlib中等高线图和图例的各种用法。我们学习了如何创建基本的等高线图,如何自定义等高线的级别和颜色,以及如何将等高线图与其他类型的图表结合。我们还探讨了图例的各种用法,包括基本的图例添加、位置和样式自定义、多图例的使用,以及在特殊情况下(如等高线图和动态图表)的图例应用。
通过掌握这些技术,你将能够创建更加丰富和信息量大的数据可视化作品。记住,实践是提高数据可视化技能的关键。尝试将这些技术应用到你自己的数据集中,并继续探索Matplotlib提供的其他功能。随着经验的积累,你将能够创建出既美观又富有洞察力的数据可视化作品。
 极客笔记
极客笔记