Matplotlib 技巧速查
1. 导入 Matplotlib
在使用 Matplotlib 之前,我们需要先导入相应的库:
import matplotlib.pyplot as plt
2. 绘制简单的折线图
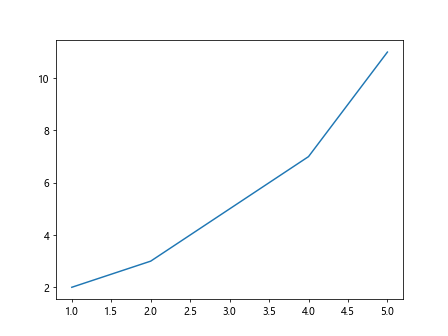
下面是一个简单的折线图示例,展示了一条线在 x 轴和 y 轴上的值:
import matplotlib.pyplot as plt

x = [1, 2, 3, 4, 5]
y = [2, 3, 5, 7, 11]

plt.plot(x, y)
plt.show()
Output:
3. 绘制多条线
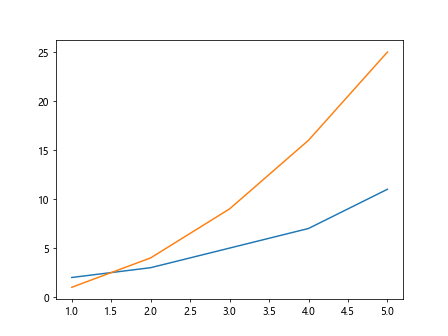
除了一条线之外,我们也可以绘制多个线在同一个图中:
import matplotlib.pyplot as plt

x = [1, 2, 3, 4, 5]
y1 = [2, 3, 5, 7, 11]
y2 = [1, 4, 9, 16, 25]

plt.plot(x, y1)
plt.plot(x, y2)
plt.show()
Output:
4. 自定义线的样式
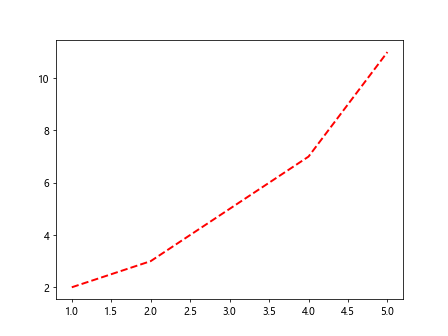
不同的线条可以使用不同的样式,比如颜色、线型、线条宽度等:
import matplotlib.pyplot as plt

x = [1, 2, 3, 4, 5]
y = [2, 3, 5, 7, 11]

plt.plot(x, y, color='red', linestyle='--', linewidth=2)
plt.show()
Output:
5. 添加标题和标签
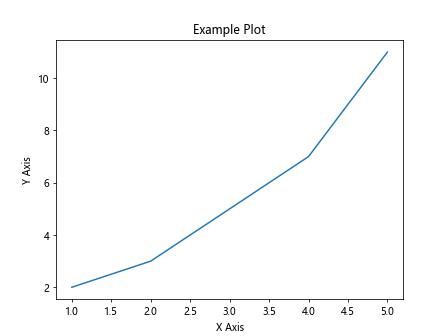
我们可以为图像添加标题和标签,使得图像更加清晰和易于理解:
import matplotlib.pyplot as plt

x = [1, 2, 3, 4, 5]
y = [2, 3, 5, 7, 11]

plt.plot(x, y)
plt.title('Example Plot')
plt.xlabel('X Axis')
plt.ylabel('Y Axis')
plt.show()
Output:
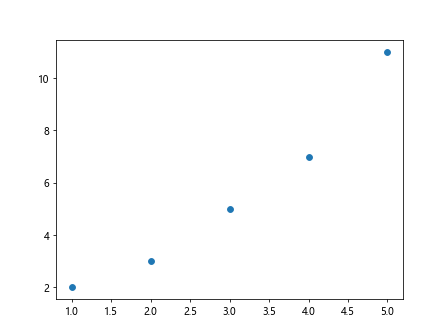
6. 绘制散点图
散点图可以展示数据的分布情况,下面是一个简单的散点图示例:
import matplotlib.pyplot as plt

x = [1, 2, 3, 4, 5]
y = [2, 3, 5, 7, 11]

plt.scatter(x, y)
plt.show()
Output:
7. 绘制柱状图
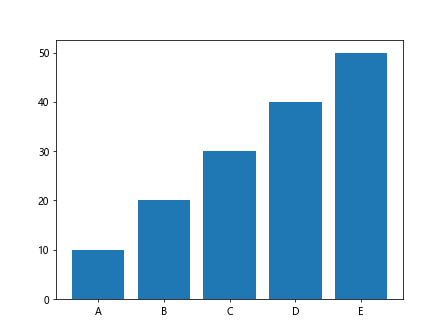
柱状图可以用来展示不同类别之间的比较情况,如下所示:
import matplotlib.pyplot as plt

x = ['A', 'B', 'C', 'D', 'E']
y = [10, 20, 30, 40, 50]

plt.bar(x, y)
plt.show()
Output:
8. 添加图例
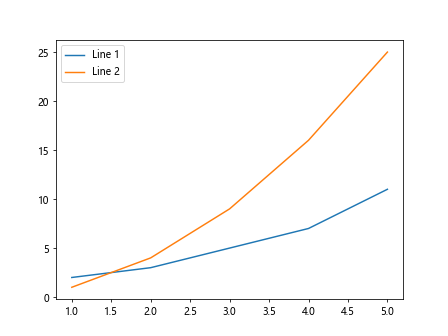
如果图中包含多个数据集,我们可以为每个数据集添加图例:
import matplotlib.pyplot as plt

x = [1, 2, 3, 4, 5]
y1 = [2, 3, 5, 7, 11]
y2 = [1, 4, 9, 16, 25]

plt.plot(x, y1, label='Line 1')
plt.plot(x, y2, label='Line 2')
plt.legend()
plt.show()
Output:
9. 修改坐标轴范围
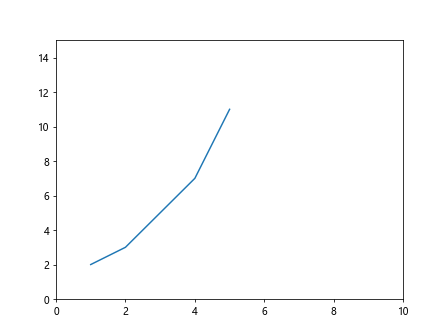
有时候我们想要调整坐标轴的范围,可以使用 xlim 和 ylim 方法:
import matplotlib.pyplot as plt

x = [1, 2, 3, 4, 5]
y = [2, 3, 5, 7, 11]

plt.plot(x, y)
plt.xlim(0, 10)
plt.ylim(0, 15)
plt.show()
Output:
10. 添加网格线
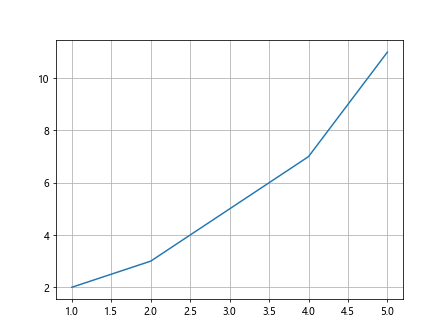
网格线可以帮助我们更好地理解数据点的位置,可以通过添加 grid 方法来显示网格:
import matplotlib.pyplot as plt

x = [1, 2, 3, 4, 5]
y = [2, 3, 5, 7, 11]

plt.plot(x, y)
plt.grid(True)
plt.show()
Output:
11. 自定义坐标轴标签
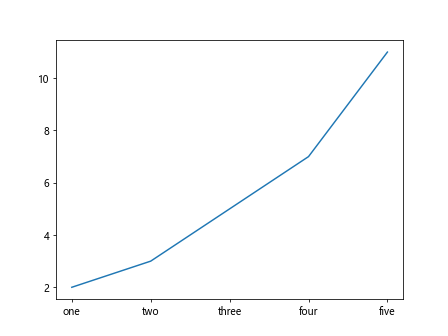
我们可以自定义坐标轴的标签,使得图像更具可读性:
import matplotlib.pyplot as plt
x = [1, 2, 3, 4, 5]
y = [2, 3, 5, 7, 11]

plt.plot(x, y)
plt.xticks([1, 2, 3, 4, 5], ['one', 'two', 'three', 'four', 'five'])
plt.show()
Output:
12. 保存图像
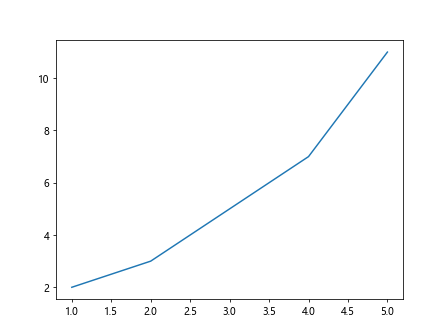
如果我们想要保存生成的图像,可以使用 savefig 方法来保存:
import matplotlib.pyplot as plt

x = [1, 2, 3, 4, 5]
y = [2, 3, 5, 7, 11]

plt.plot(x, y)
plt.savefig('plot.png')
plt.show()
Output:
13. 绘制子图
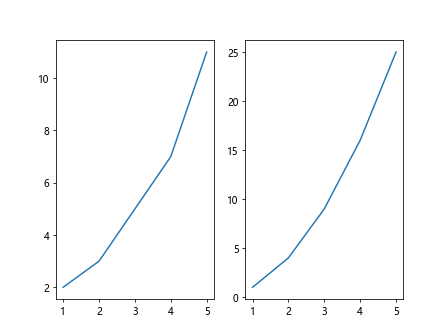
有时候我们想要在同一个画布上绘制多个子图,可以使用 subplot 方法:
import matplotlib.pyplot as plt

x = [1, 2, 3, 4, 5]
y1 = [2, 3, 5, 7, 11]
y2 = [1, 4, 9, 16, 25]

plt.subplot(1, 2, 1)
plt.plot(x, y1)

plt.subplot(1, 2, 2)
plt.plot(x, y2)

plt.show()
Output:
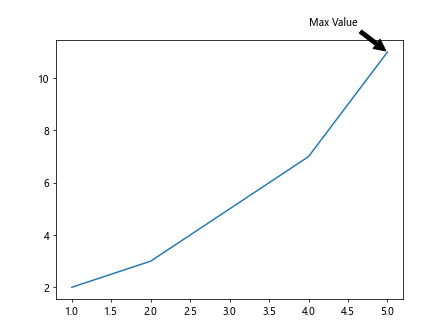
14. 添加注释
我们可以在图像上添加注释来帮助解释数据,如下所示:
import matplotlib.pyplot as plt

x = [1, 2, 3, 4, 5]
y = [2, 3, 5, 7, 11]

plt.plot(x, y)
plt.annotate('Max Value', xy=(5, 11), xytext=(4, 12),
             arrowprops=dict(facecolor='black', shrink=0.05))
plt.show()
Output:
15. 使用不同的图形
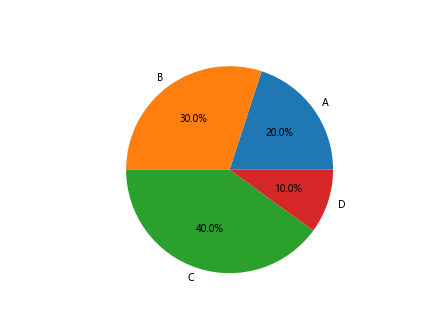
除了折线图和散点图外,我们还可以使用其他类型的图形如条形图和饼图:
import matplotlib.pyplot as plt

sizes = [20, 30, 40, 10]
labels = ['A', 'B', 'C', 'D']

plt.pie(sizes, labels=labels, autopct='%1.1f%%')
plt.show()
Output:
16. 添加颜色映射
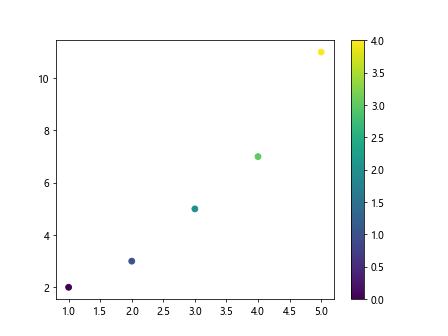
有时候我们希望在图中应用颜色映射来突出显示数据的不同部分:
import matplotlib.pyplot as plt

x = [1, 2, 3, 4, 5]
y = [2, 3, 5, 7, 11]
colors = [0, 1, 2, 3, 4]

plt.scatter(x, y, c=colors, cmap='viridis')
plt.colorbar()
plt.show()
Output:
17. 保存为 PDF
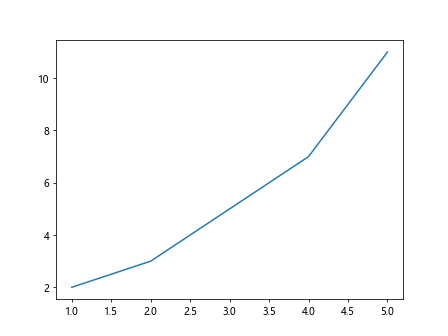
除了保存为图片外,我们还可以将图像保存为 PDF 格式:
import matplotlib.pyplot as plt

x = [1, 2, 3, 4, 5]
y = [2, 3, 5, 7, 11]

plt.plot(x, y)
plt.savefig('plot.pdf')
plt.show()
Output:
18. 绘制直方图
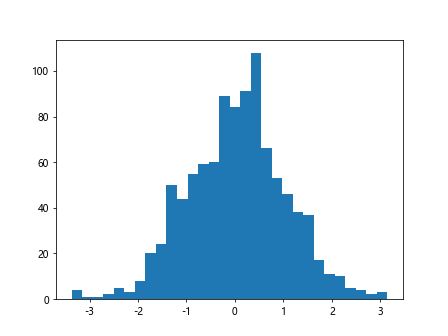
直方图可以用来展示数据的分布情况,如下所示:
import matplotlib.pyplot as plt
import numpy as np

data = np.random.randn(1000)
plt.hist(data, bins=30)
plt.show()
Output:
19. 添加背景色
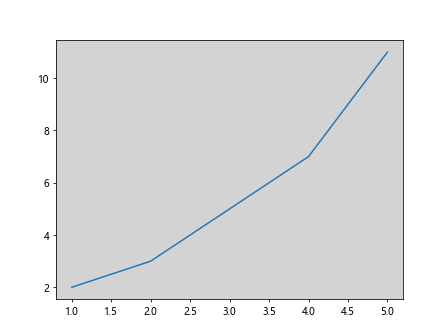
我们可以为图像添加背景色,让图像更具吸引力和专业性:
import matplotlib.pyplot as plt

x = [1, 2, 3, 4, 5]
y = [2, 3, 5, 7, 11]

plt.plot(x, y)
plt.gca().set_facecolor('lightgrey')
plt.show()
Output:
20. 添加文本标注
除了使用注释外,我们还可以添加文本标注来说明数据的特点:
import matplotlib.pyplot as plt

x = [1, 2, 3, 4, 5]
y = [2, 3, 5, 7, 11]

plt.plot(x, y)
plt.text(3, 5, 'Max Value', fontsize=12, color='red')
plt.show()
Output:

 极客笔记
极客笔记