matplotlib capsize
在使用matplotlib绘制图表时,我们经常需要在柱状图或者散点图中添加误差线,以展示数据的可靠性和准确性。而capsize参数则可以用来控制误差线的帽子大小。本文将详细介绍如何使用matplotlib中的capsize参数来调整误差线的帽子大小。
1. 添加误差线
在绘制图表时,我们使用errorbar方法来添加误差线。首先,创建一组数据和误差范围:
import matplotlib.pyplot as plt

x = [1, 2, 3, 4, 5]
y = [2, 3, 5, 7, 6]
errors = [0.5, 0.3, 0.2, 0.4, 0.6]
然后,绘制柱状图并添加误差线:
import matplotlib.pyplot as plt

x = [1, 2, 3, 4, 5]
y = [2, 3, 5, 7, 6]
errors = [0.5, 0.3, 0.2, 0.4, 0.6]

plt.bar(x, y, yerr=errors, capsize=5)
plt.show()
Output:
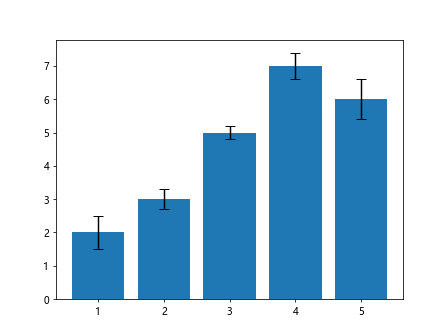
在上面的代码中,yerr参数用来指定误差范围,capsize参数则用来设置误差线的帽子大小。
2. 调整帽子大小
capsize参数的值越大,误差线的帽子就会越大;反之,值越小,帽子就会越小。下面是一个示例,将capsize设置为10:
import matplotlib.pyplot as plt

x = [1, 2, 3, 4, 5]
y = [2, 3, 5, 7, 6]
errors = [0.5, 0.3, 0.2, 0.4, 0.6]

plt.bar(x, y, yerr=errors, capsize=10)
plt.show()
Output:
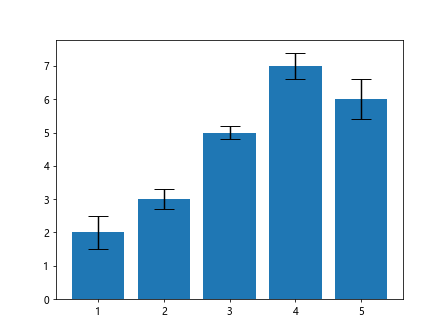
通过不同的capsize数值,可以调整误差线的帽子大小,使图表更易于阅读。
3. 大帽子效果
当capsize设置为一个较大的值时,误差线的帽子将非常显眼,突出展示数据的可靠性。比如将capsize设置为15:
import matplotlib.pyplot as plt

x = [1, 2, 3, 4, 5]
y = [2, 3, 5, 7, 6]
errors = [0.5, 0.3, 0.2, 0.4, 0.6]

plt.bar(x, y, yerr=errors, capsize=15)
plt.show()
Output:
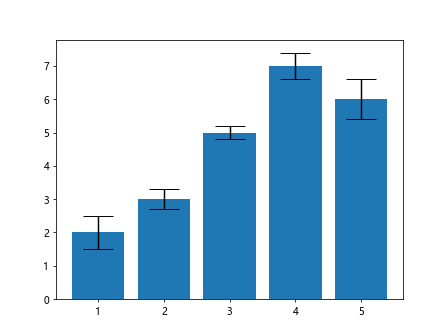
这种效果在需要强调误差范围时非常有用。
4. 小帽子效果
相反,当capsize设置为一个较小的值时,误差线的帽子将非常精细,更加朴素。比如将capsize设置为3:
import matplotlib.pyplot as plt

x = [1, 2, 3, 4, 5]
y = [2, 3, 5, 7, 6]
errors = [0.5, 0.3, 0.2, 0.4, 0.6]

plt.bar(x, y, yerr=errors, capsize=3)
plt.show()
Output:
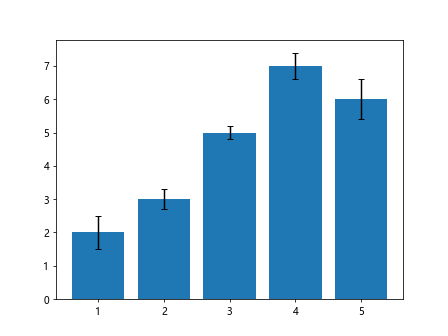
这种效果适合在图表中添加误差线的情况,但不想太过突出。
5. 隐藏帽子
如果不希望在误差线上显示帽子,可以将capsize设置为0,即隐藏帽子。下面是一个示例:
import matplotlib.pyplot as plt

x = [1, 2, 3, 4, 5]
y = [2, 3, 5, 7, 6]
errors = [0.5, 0.3, 0.2, 0.4, 0.6]

plt.bar(x, y, yerr=errors, capsize=0)
plt.show()
Output:
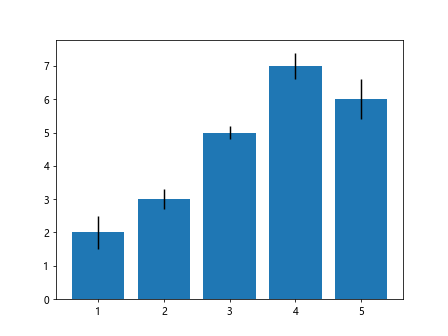
这样就可以清晰地展示误差线,而不会受到帽子的干扰。
通过调整capsize参数的数值,可以根据不同的需求来展示误差线的帽子大小,使图表更具吸引力和易读性。Matplotlib的capsize功能为我们在图表中展示数据提供了更多的灵活性。
 极客笔记
极客笔记