Matplotlib 条形图:如何旋转 X 轴标签
参考:matplotlib bar chart rotate x labels
Matplotlib 是 Python 中最流行的数据可视化库之一,它提供了丰富的绘图功能,其中条形图(Bar Chart)是一种常用的图表类型。在创建条形图时,我们经常会遇到 X 轴标签重叠或显示不完整的问题,特别是当标签较长或数据点较多时。这时,旋转 X 轴标签就成为了一个非常有用的技巧。本文将详细介绍如何在 Matplotlib 中创建条形图并旋转 X 轴标签,以提高图表的可读性和美观性。
1. Matplotlib 条形图基础
在开始旋转 X 轴标签之前,我们先来了解一下如何使用 Matplotlib 创建基本的条形图。条形图通常用于比较不同类别的数据,每个条形的高度表示该类别的数值大小。
以下是一个简单的条形图示例:
import matplotlib.pyplot as plt

categories = ['Category A', 'Category B', 'Category C', 'Category D']
values = [4, 7, 2, 5]

plt.figure(figsize=(10, 6))
plt.bar(categories, values)
plt.title('Basic Bar Chart - how2matplotlib.com')
plt.xlabel('Categories')
plt.ylabel('Values')
plt.show()
Output:
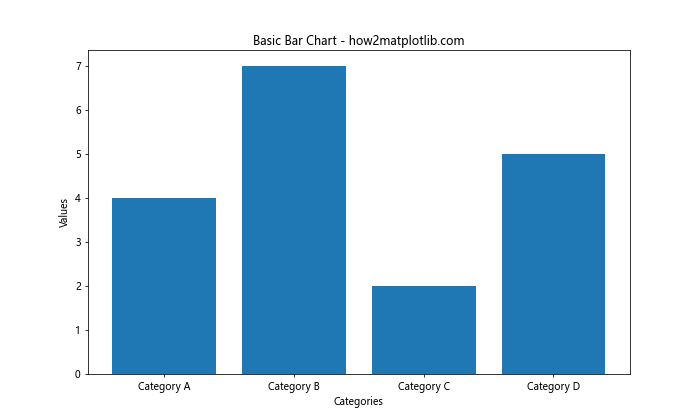
在这个例子中,我们创建了一个包含四个类别的简单条形图。plt.bar() 函数用于绘制条形图,第一个参数是类别列表,第二个参数是对应的数值列表。我们还设置了图表标题、X 轴标签和 Y 轴标签。
2. 旋转 X 轴标签的必要性
当类别标签较长或数量较多时,默认的水平标签可能会重叠或被截断,影响图表的可读性。这时,旋转 X 轴标签就变得非常有用。通过旋转标签,我们可以:
- 避免标签重叠
- 显示完整的标签文本
- 提高图表的整体美观性
- 更有效地利用图表空间
3. 使用 xticks() 旋转标签
Matplotlib 提供了 xticks() 函数,允许我们自定义 X 轴刻度的位置和标签。我们可以使用这个函数来旋转标签。
以下是一个旋转 X 轴标签的示例:
import matplotlib.pyplot as plt

categories = ['Long Category A', 'Very Long Category B', 'Extremely Long Category C', 'Another Long Category D']
values = [4, 7, 2, 5]

plt.figure(figsize=(12, 6))
plt.bar(categories, values)
plt.title('Bar Chart with Rotated Labels - how2matplotlib.com')
plt.xlabel('Categories')
plt.ylabel('Values')

plt.xticks(rotation=45, ha='right')
plt.tight_layout()
plt.show()
Output:
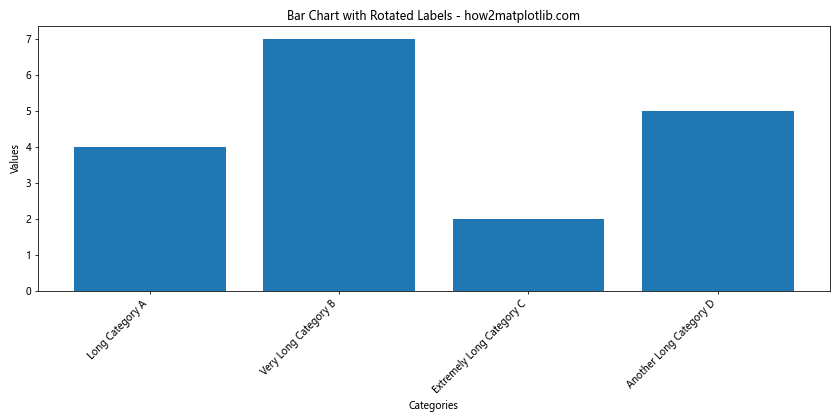
在这个例子中,我们使用 plt.xticks(rotation=45, ha='right') 将 X 轴标签旋转 45 度。rotation 参数指定旋转角度,ha='right' 设置水平对齐方式为右对齐,这样可以避免标签超出图表边界。plt.tight_layout() 函数用于自动调整子图参数,以给定的填充适应图形区域。
4. 调整标签旋转角度
我们可以根据需要调整标签的旋转角度。常用的角度包括 30 度、45 度和 90 度。以下是一个比较不同旋转角度的示例:
import matplotlib.pyplot as plt

categories = ['Category A', 'Category B', 'Category C', 'Category D', 'Category E']
values = [4, 7, 2, 5, 6]

fig, (ax1, ax2, ax3) = plt.subplots(1, 3, figsize=(18, 6))

for ax, angle in zip([ax1, ax2, ax3], [30, 45, 90]):
    ax.bar(categories, values)
    ax.set_title(f'Rotation {angle}° - how2matplotlib.com')
    ax.set_xlabel('Categories')
    ax.set_ylabel('Values')
    ax.tick_params(axis='x', rotation=angle)

plt.tight_layout()
plt.show()
Output:
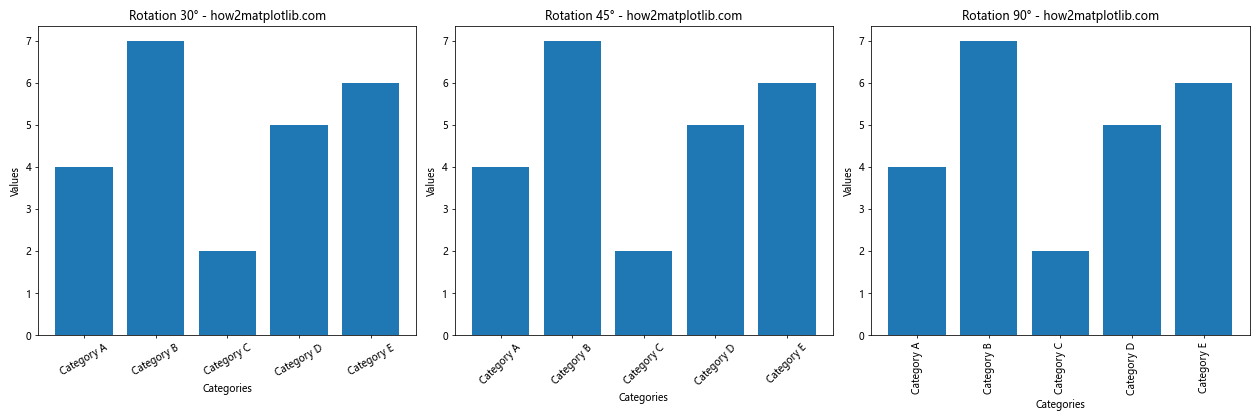
这个例子创建了三个子图,分别展示了 30 度、45 度和 90 度旋转的效果。我们使用 ax.tick_params(axis='x', rotation=angle) 来设置每个子图的 X 轴标签旋转角度。
5. 垂直条形图与标签旋转
有时,使用垂直条形图(即水平方向的条形图)可能是更好的选择,特别是当类别标签非常长时。在这种情况下,我们可以使用 barh() 函数来创建水平条形图,并相应地调整标签。
import matplotlib.pyplot as plt

categories = ['Very Long Category A', 'Extremely Long Category B', 'Another Long Category C', 'Yet Another Long Category D']
values = [4, 7, 2, 5]

plt.figure(figsize=(10, 6))
plt.barh(categories, values)
plt.title('Horizontal Bar Chart - how2matplotlib.com')
plt.xlabel('Values')
plt.ylabel('Categories')

plt.tight_layout()
plt.show()
Output:
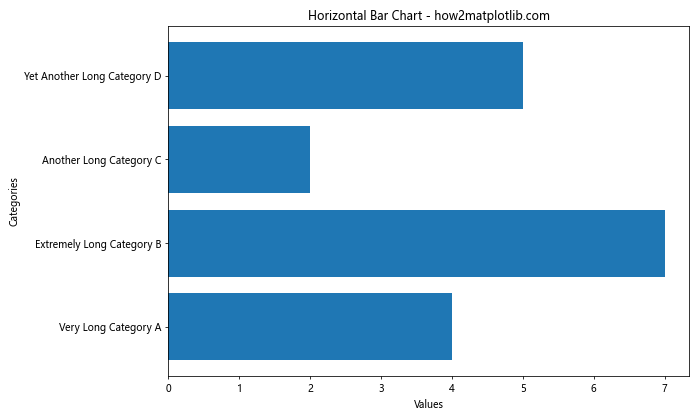
在这个例子中,我们使用 plt.barh() 创建了一个水平条形图。注意 X 轴和 Y 轴的标签已经交换,以反映图表的方向变化。
6. 自定义标签样式
除了旋转标签,我们还可以自定义标签的其他样式,如字体大小、颜色等。以下是一个更复杂的例子,展示了如何自定义标签样式:
import matplotlib.pyplot as plt

categories = ['Category A', 'Category B', 'Category C', 'Category D', 'Category E']
values = [4, 7, 2, 5, 6]

plt.figure(figsize=(12, 6))
plt.bar(categories, values)
plt.title('Bar Chart with Custom Labels - how2matplotlib.com', fontsize=16)
plt.xlabel('Categories', fontsize=14)
plt.ylabel('Values', fontsize=14)

plt.xticks(rotation=45, ha='right', fontsize=12, color='navy')
plt.yticks(fontsize=12)

plt.grid(axis='y', linestyle='--', alpha=0.7)
plt.tight_layout()
plt.show()
Output:
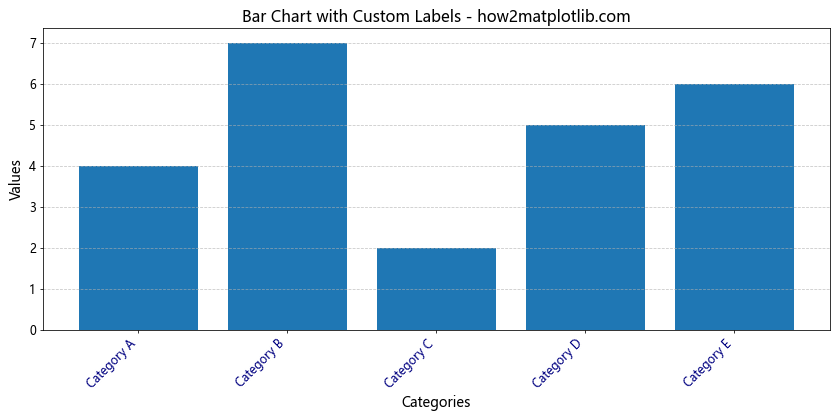
在这个例子中,我们不仅旋转了 X 轴标签,还自定义了标签的字体大小和颜色。我们还添加了 Y 轴网格线,以提高可读性。
7. 处理长标签的技巧
当标签非常长时,即使旋转也可能无法完全显示。在这种情况下,我们可以考虑以下几种策略:
- 缩短标签:使用缩写或截断长标签。
- 使用换行符:在标签中插入换行符。
- 使用小字体:减小标签字体大小。
以下是一个结合这些策略的示例:
import matplotlib.pyplot as plt

categories = ['Very Long Category A\nwith line break', 'Extremely Long Category B\nwith line break',
              'Another Long Category C\nwith line break', 'Yet Another Long Category D\nwith line break']
values = [4, 7, 2, 5]

plt.figure(figsize=(12, 6))
plt.bar(categories, values)
plt.title('Bar Chart with Long Labels - how2matplotlib.com', fontsize=16)
plt.xlabel('Categories', fontsize=14)
plt.ylabel('Values', fontsize=14)

plt.xticks(rotation=45, ha='right', fontsize=10)
plt.yticks(fontsize=12)

plt.tight_layout()
plt.show()
Output:
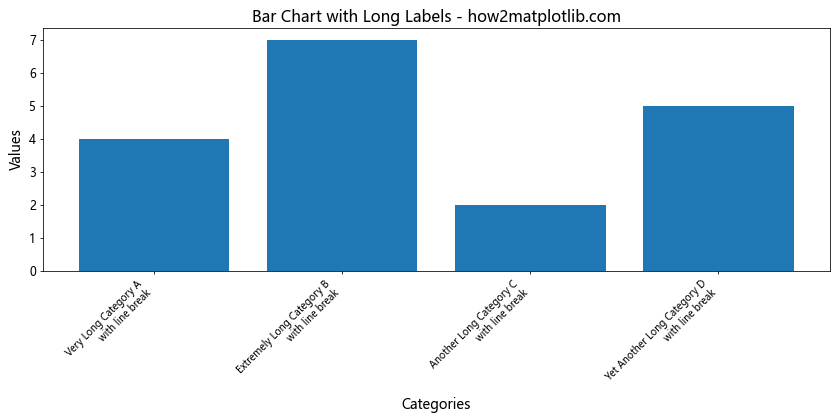
在这个例子中,我们在长标签中插入了换行符 \n,并减小了标签的字体大小,以确保所有文本都能显示。
8. 使用 seaborn 简化绘图过程
Seaborn 是基于 Matplotlib 的统计数据可视化库,它提供了一些高级接口,可以简化绘图过程。使用 Seaborn 创建条形图并旋转标签可能会更加简单。
以下是使用 Seaborn 创建条形图并旋转标签的示例:
import matplotlib.pyplot as plt
import seaborn as sns

categories = ['Category A', 'Category B', 'Category C', 'Category D', 'Category E']
values = [4, 7, 2, 5, 6]

plt.figure(figsize=(12, 6))
sns.barplot(x=categories, y=values)
plt.title('Seaborn Bar Chart - how2matplotlib.com', fontsize=16)
plt.xlabel('Categories', fontsize=14)
plt.ylabel('Values', fontsize=14)

plt.xticks(rotation=45, ha='right')
plt.tight_layout()
plt.show()
Output:
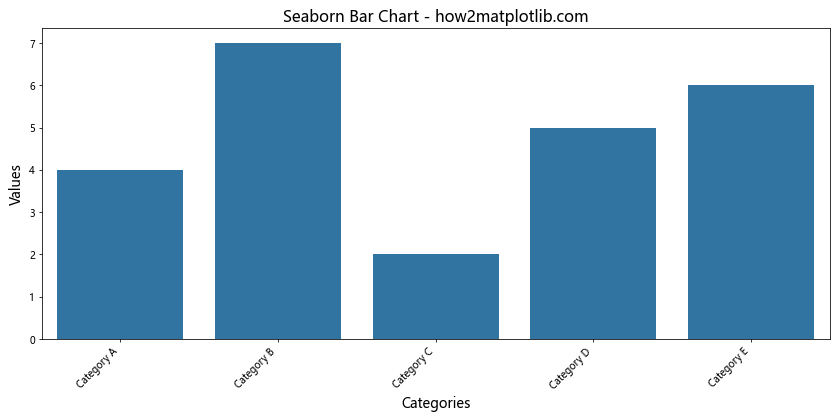
Seaborn 的 barplot() 函数自动处理了很多细节,如颜色选择和误差线。我们仍然可以使用 Matplotlib 的函数来自定义图表的其他方面,如标题和轴标签。
9. 处理大量类别
当有大量类别时,即使旋转标签也可能无法有效显示所有信息。在这种情况下,我们可以考虑以下策略:
- 只显示部分标签
- 使用交互式工具,如缩放和平移
- 将图表分成多个子图
以下是一个只显示部分标签的示例:
import matplotlib.pyplot as plt

categories = [f'Category {i}' for i in range(20)]
values = [i % 10 + 1 for i in range(20)]

plt.figure(figsize=(14, 6))
plt.bar(categories, values)
plt.title('Bar Chart with Many Categories - how2matplotlib.com', fontsize=16)
plt.xlabel('Categories', fontsize=14)
plt.ylabel('Values', fontsize=14)

plt.xticks(range(0, len(categories), 2), [categories[i] for i in range(0, len(categories), 2)], rotation=45, ha='right')
plt.tight_layout()
plt.show()
Output:
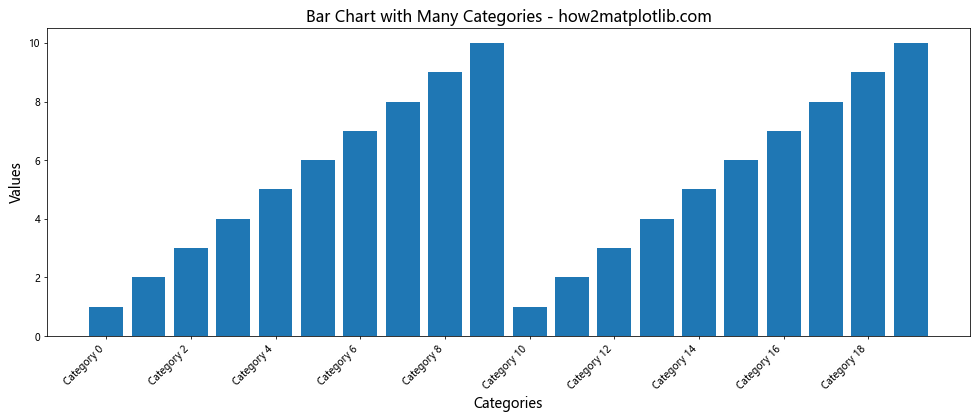
在这个例子中,我们只显示了每隔一个的标签,以减少 X 轴上的拥挤程度。
10. 添加数据标签
为了进一步提高图表的可读性,我们可以在每个条形上添加数值标签。这在某些情况下可能比旋转 X 轴标签更有效。
以下是一个添加数据标签的示例:
import matplotlib.pyplot as plt

categories = ['Category A', 'Category B', 'Category C', 'Category D', 'Category E']
values = [4, 7, 2, 5, 6]

plt.figure(figsize=(12, 6))
bars = plt.bar(categories, values)
plt.title('Bar Chart with Data Labels - how2matplotlib.com', fontsize=16)
plt.xlabel('Categories', fontsize=14)
plt.ylabel('Values', fontsize=14)

plt.xticks(rotation=45, ha='right')

for bar in bars:
    height = bar.get_height()
    plt.text(bar.get_x() + bar.get_width()/2., height,
             f'{height}',
             ha='center', va='bottom')

plt.tight_layout()
plt.show()
Output:
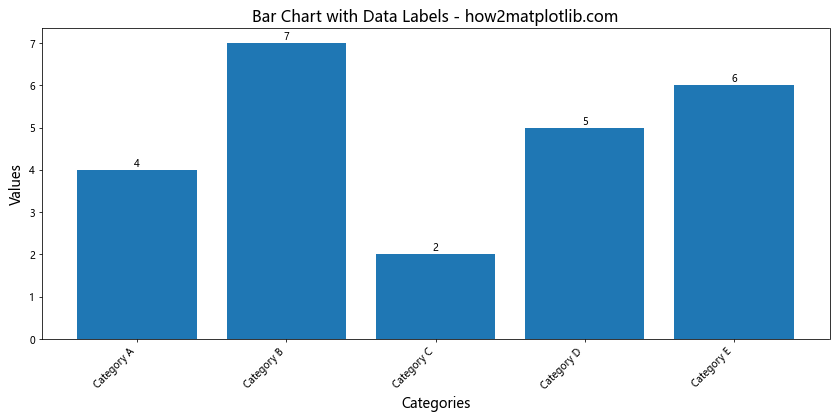
在这个例子中,我们遍历每个条形,并在其顶部添加了对应的数值标签。这种方法可以让读者直接看到每个类别的具体数值,而不需要参考 Y 轴。
11. 使用颜色编码增强可读性
当类别较多时,使用不同的颜色可以帮助区分各个类别,即使标签被旋转也能快速识别。以下是一个使用颜色编码的示例:
import matplotlib.pyplot as plt
import numpy as np

categories = [f'Category {chr(65+i)}' for i in range(10)]
values = np.random.randint(1, 10, 10)

plt.figure(figsize=(14, 6))
bars = plt.bar(categories, values, color=plt.cm.Spectral(np.linspace(0, 1, 10)))
plt.title('Color-coded Bar Chart - how2matplotlib.com', fontsize=16)
plt.xlabel('Categories', fontsize=14)
plt.ylabel('Values', fontsize=14)

plt.xticks(rotation=45, ha='right')

for bar in bars:
    height = bar.get_height()
    plt.text(bar.get_x() + bar.get_width()/2., height,
             f'{height}',
             ha='center', va='bottom')

plt.colorbar(plt.cm.ScalarMappable(cmap=plt.cm.Spectral), label='Category Color Code')
plt.tight_layout()
plt.show()
在这个例子中,我们使用了 Spectral 颜色映射来为每个条形分配不同的颜色。我们还添加了一个颜色条,以帮助读者理解颜色编码。
12. 分组条形图与标签旋转
当我们需要比较多个组之间的多个类别时,分组条形图是一个很好的选择。在这种情况下,旋转标签变得更加重要,因为标签数量会更多。
以下是一个分组条形图的示例:
import matplotlib.pyplot as plt
import numpy as np

categories = ['Category A', 'Category B', 'Category C', 'Category D']
group1 = [4, 7, 2, 5]
group2 = [3, 6, 4, 8]
group3 = [5, 2, 7, 3]

x = np.arange(len(categories))
width = 0.25

fig, ax = plt.subplots(figsize=(12, 6))
rects1 = ax.bar(x - width, group1, width, label='Group 1')
rects2 = ax.bar(x, group2, width, label='Group 2')
rects3 = ax.bar(x + width, group3, width, label='Group 3')

ax.set_title('Grouped Bar Chart - how2matplotlib.com', fontsize=16)
ax.set_xlabel('Categories', fontsize=14)
ax.set_ylabel('Values', fontsize=14)
ax.set_xticks(x)
ax.set_xticklabels(categories, rotation=45, ha='right')
ax.legend()

plt.tight_layout()
plt.show()
Output:
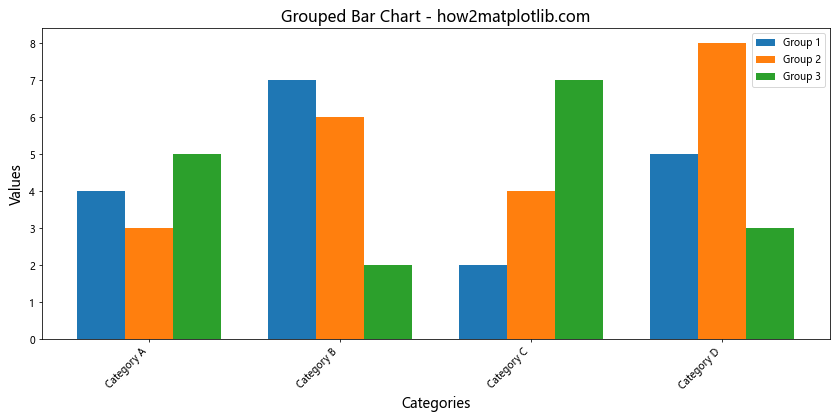
在这个例子中,我们创建了一个分组条形图,每个类别包含三个组。我们使用 ax.set_xticklabels() 函数来旋转 X 轴标签。
13. 堆叠条形图与标签旋转
堆叠条形图是另一种展示多组数据的方式,它将不同组的数据堆叠在一起。在这种图表中,旋转标签同样重要。
以下是一个堆叠条形图的示例:
import matplotlib.pyplot as plt

categories = ['Category A', 'Category B', 'Category C', 'Category D', 'Category E']
group1 = [4, 7, 2, 5, 6]
group2 = [3, 6, 4, 8, 5]
group3 = [5, 2, 7, 3, 4]

plt.figure(figsize=(12, 6))
plt.bar(categories, group1, label='Group 1')
plt.bar(categories, group2, bottom=group1, label='Group 2')
plt.bar(categories, group3, bottom=[i+j for i,j in zip(group1, group2)], label='Group 3')

plt.title('Stacked Bar Chart - how2matplotlib.com', fontsize=16)
plt.xlabel('Categories', fontsize=14)
plt.ylabel('Values', fontsize=14)

plt.xticks(rotation=45, ha='right')
plt.legend()

plt.tight_layout()
plt.show()
Output:
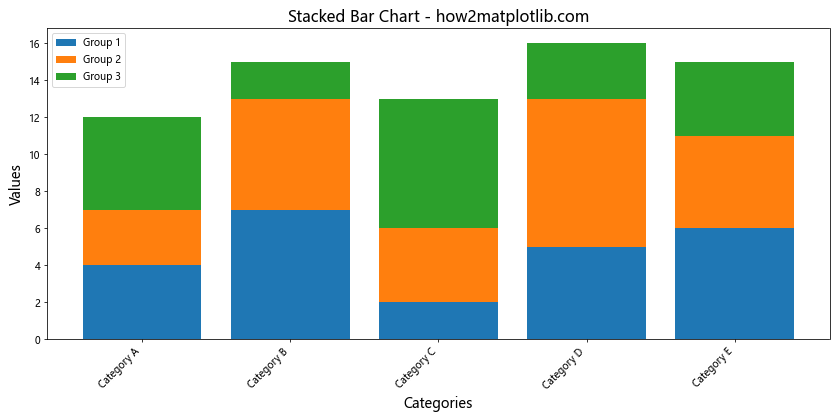
在这个例子中,我们使用 plt.bar() 函数的 bottom 参数来创建堆叠效果。标签旋转的方法与之前的例子相同。
14. 使用 GridSpec 创建复杂布局
当我们需要在一个图表中展示多个相关的条形图时,可以使用 Matplotlib 的 GridSpec 功能来创建复杂的布局。这样可以更好地利用空间,同时保持标签的可读性。
以下是一个使用 GridSpec 创建复杂布局的示例:
import matplotlib.pyplot as plt
import matplotlib.gridspec as gridspec

categories = ['Category A', 'Category B', 'Category C', 'Category D']
values1 = [4, 7, 2, 5]
values2 = [3, 6, 4, 8]

fig = plt.figure(figsize=(12, 8))
gs = gridspec.GridSpec(2, 2, height_ratios=[3, 1])

ax1 = fig.add_subplot(gs[0, :])
ax1.bar(categories, values1)
ax1.set_title('Main Bar Chart - how2matplotlib.com', fontsize=16)
ax1.set_ylabel('Values', fontsize=14)
ax1.tick_params(axis='x', rotation=45, labelsize=12)

ax2 = fig.add_subplot(gs[1, 0])
ax2.bar(categories, values2)
ax2.set_title('Secondary Bar Chart 1', fontsize=14)
ax2.tick_params(axis='x', rotation=45, labelsize=10)

ax3 = fig.add_subplot(gs[1, 1])
ax3.bar(categories, [v1/v2 for v1, v2 in zip(values1, values2)])
ax3.set_title('Secondary Bar Chart 2', fontsize=14)
ax3.tick_params(axis='x', rotation=45, labelsize=10)

plt.tight_layout()
plt.show()
Output:
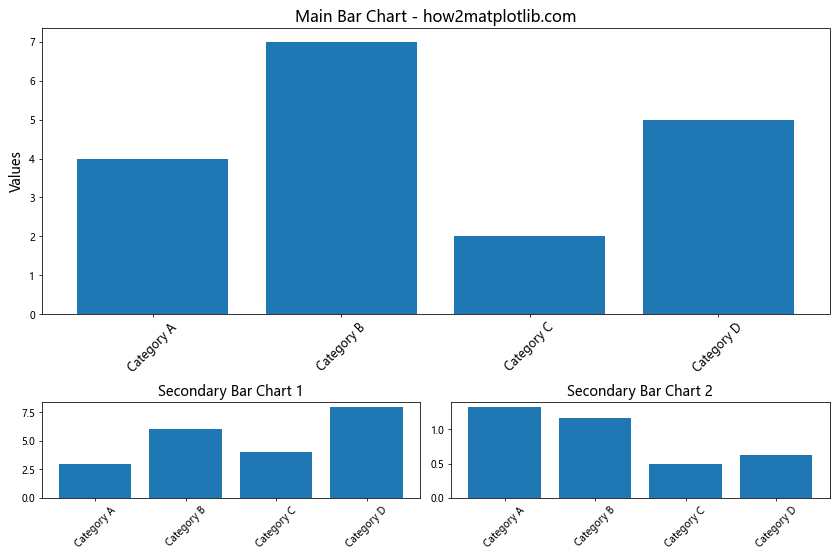
在这个例子中,我们使用 GridSpec 创建了一个 2×2 的网格,其中顶部跨越两列用于主要的条形图,底部两个小格用于次要的条形图。我们对每个子图的 X 轴标签都进行了旋转。
15. 动态调整标签旋转角度
在某些情况下,我们可能需要根据标签的长度动态调整旋转角度。以下是一个根据标签长度动态调整旋转角度的示例:
import matplotlib.pyplot as plt

categories = ['Short', 'Medium Length', 'Very Long Category', 'Extremely Long Category Name']
values = [4, 7, 2, 5]

plt.figure(figsize=(12, 6))
plt.bar(categories, values)
plt.title('Dynamic Label Rotation - how2matplotlib.com', fontsize=16)
plt.xlabel('Categories', fontsize=14)
plt.ylabel('Values', fontsize=14)

max_length = max(len(category) for category in categories)
rotation_angle = min(45, max(0, max_length - 8) * 5)  # 5 degrees per character over 8

plt.xticks(rotation=rotation_angle, ha='right' if rotation_angle > 0 else 'center')
plt.tight_layout()
plt.show()
Output:
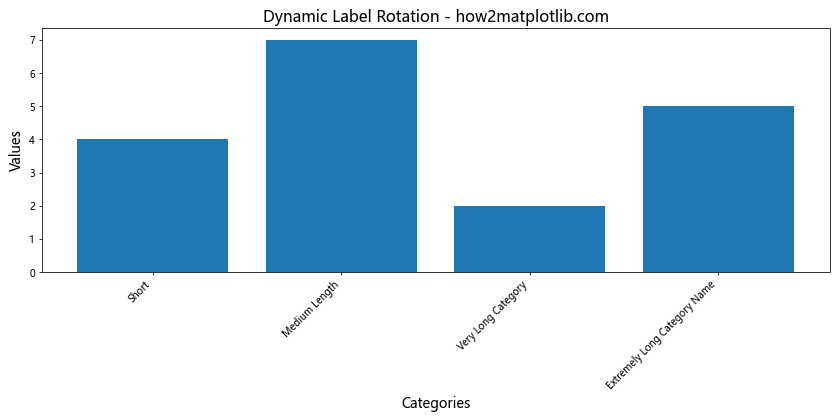
在这个例子中,我们根据最长标签的长度来计算旋转角度。如果最长标签超过 8 个字符,我们就开始旋转,每多一个字符增加 5 度,最大旋转角度为 45 度。
16. 使用 ax.text() 替代 xticks
在某些情况下,使用 ax.text() 函数来手动放置标签可能比使用 xticks() 更灵活。这种方法允许我们更精确地控制标签的位置和旋转。
以下是一个使用 ax.text() 来放置旋转标签的示例:
import matplotlib.pyplot as plt

categories = ['Category A', 'Category B', 'Category C', 'Category D', 'Category E']
values = [4, 7, 2, 5, 6]

fig, ax = plt.subplots(figsize=(12, 6))
bars = ax.bar(range(len(categories)), values)

ax.set_title('Bar Chart with Custom Label Placement - how2matplotlib.com', fontsize=16)
ax.set_xlabel('Categories', fontsize=14)
ax.set_ylabel('Values', fontsize=14)

ax.set_xticks(range(len(categories)))
ax.set_xticklabels([])  # Remove default x-axis labels

for i, (category, value) in enumerate(zip(categories, values)):
    ax.text(i, -0.5, category, rotation=45, ha='right', va='top')

plt.tight_layout()
plt.show()
Output:
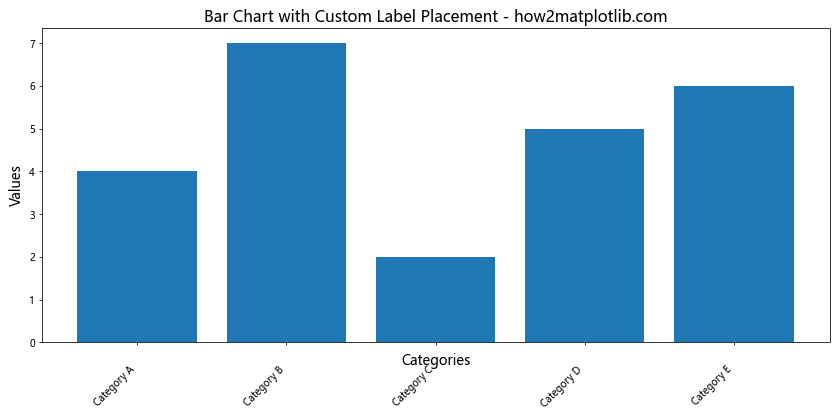
在这个例子中,我们首先移除了默认的 X 轴标签,然后使用 ax.text() 函数为每个类别手动添加旋转的标签。这种方法给了我们更多的控制权,可以精确地调整标签的位置和角度。
17. 使用 FuncFormatter 自定义标签格式
有时,我们可能需要对标签进行更复杂的格式化。Matplotlib 的 FuncFormatter 允许我们使用自定义函数来格式化标签。
以下是一个使用 FuncFormatter 来自定义标签格式的示例:
import matplotlib.pyplot as plt
from matplotlib.ticker import FuncFormatter

def format_label(x, pos):
    categories = ['Category A', 'Category B', 'Category C', 'Category D', 'Category E']
    if x < len(categories):
        return f'{categories[int(x)]}\n({x+1})'
    return ''

categories = ['Category A', 'Category B', 'Category C', 'Category D', 'Category E']
values = [4, 7, 2, 5, 6]

fig, ax = plt.subplots(figsize=(12, 6))
ax.bar(range(len(categories)), values)

ax.set_title('Bar Chart with Custom Formatted Labels - how2matplotlib.com', fontsize=16)
ax.set_xlabel('Categories', fontsize=14)
ax.set_ylabel('Values', fontsize=14)

ax.xaxis.set_major_formatter(FuncFormatter(format_label))
plt.xticks(range(len(categories)), rotation=45, ha='right')

plt.tight_layout()
plt.show()
Output:
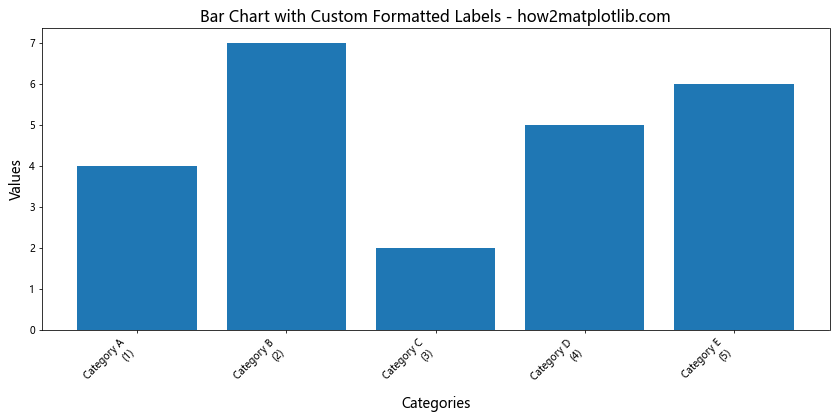
在这个例子中,我们定义了一个 format_label 函数,它不仅返回类别名称,还添加了类别的索引号。我们使用 FuncFormatter 将这个函数应用到 X 轴的标签上。
18. 处理日期标签
当 X 轴表示日期时,旋转标签变得尤为重要,因为日期字符串通常较长。以下是一个处理日期标签的示例:
import matplotlib.pyplot as plt
import matplotlib.dates as mdates
from datetime import datetime, timedelta

start_date = datetime(2023, 1, 1)
dates = [start_date + timedelta(days=i) for i in range(10)]
values = [4, 7, 2, 5, 6, 8, 3, 9, 5, 7]

plt.figure(figsize=(12, 6))
plt.bar(dates, values)

plt.title('Bar Chart with Date Labels - how2matplotlib.com', fontsize=16)
plt.xlabel('Dates', fontsize=14)
plt.ylabel('Values', fontsize=14)

plt.gca().xaxis.set_major_formatter(mdates.DateFormatter('%Y-%m-%d'))
plt.gca().xaxis.set_major_locator(mdates.DayLocator(interval=1))

plt.gcf().autofmt_xdate()  # Rotation and alignment of tick labels

plt.tight_layout()
plt.show()
Output:
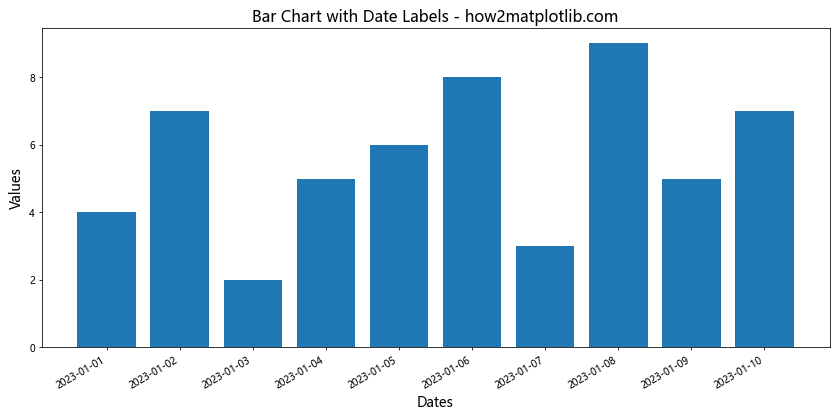
在这个例子中,我们使用 matplotlib.dates 模块来格式化日期标签。autofmt_xdate() 函数自动旋转和对齐日期标签,使其更易读。
19. 使用 plt.subplots_adjust() 微调布局
有时,即使使用 tight_layout(),我们可能还是需要对图表布局进行更精细的调整,特别是当标签被旋转时。plt.subplots_adjust() 函数允许我们手动调整子图的位置。
以下是一个使用 plt.subplots_adjust() 微调布局的示例:
import matplotlib.pyplot as plt

categories = ['Very Long Category A', 'Extremely Long Category B', 'Another Long Category C', 'Yet Another Long Category D']
values = [4, 7, 2, 5]

plt.figure(figsize=(12, 6))
plt.bar(categories, values)
plt.title('Bar Chart with Adjusted Layout - how2matplotlib.com', fontsize=16)
plt.xlabel('Categories', fontsize=14)
plt.ylabel('Values', fontsize=14)

plt.xticks(rotation=45, ha='right')

plt.subplots_adjust(bottom=0.2)  # Increase bottom margin

plt.show()
Output:
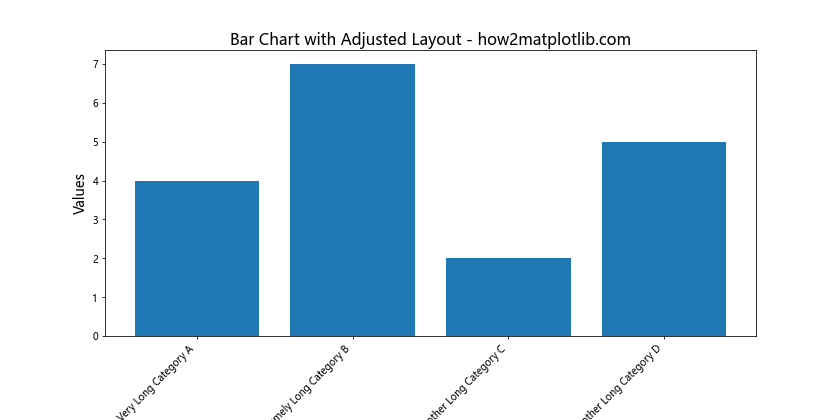
在这个例子中,我们使用 plt.subplots_adjust(bottom=0.2) 来增加图表底部的边距,为旋转的标签留出更多空间。
20. 结合多种技巧创建复杂图表
最后,让我们结合本文介绍的多种技巧,创建一个更复杂、信息更丰富的图表:
import matplotlib.pyplot as plt
import numpy as np

categories = ['Category A', 'Category B', 'Category C', 'Category D', 'Category E']
values1 = [4, 7, 2, 5, 6]
values2 = [3, 6, 4, 8, 5]

fig, (ax1, ax2) = plt.subplots(2, 1, figsize=(12, 10), height_ratios=[2, 1])

# Upper subplot: Grouped bar chart
x = np.arange(len(categories))
width = 0.35

rects1 = ax1.bar(x - width/2, values1, width, label='Group 1', color='skyblue')
rects2 = ax1.bar(x + width/2, values2, width, label='Group 2', color='lightgreen')

ax1.set_title('Grouped Bar Chart - how2matplotlib.com', fontsize=16)
ax1.set_ylabel('Values', fontsize=14)
ax1.set_xticks(x)
ax1.set_xticklabels(categories, rotation=45, ha='right')
ax1.legend()

# Add value labels on bars
for rects in [rects1, rects2]:
    for rect in rects:
        height = rect.get_height()
        ax1.annotate(f'{height}',
                     xy=(rect.get_x() + rect.get_width() / 2, height),
                     xytext=(0, 3),  # 3 points vertical offset
                     textcoords="offset points",
                     ha='center', va='bottom')

# Lower subplot: Horizontal bar chart of differences
differences = [v1 - v2 for v1, v2 in zip(values1, values2)]
colors = ['red' if d < 0 else 'green' for d in differences]

ax2.barh(categories, differences, color=colors)
ax2.set_title('Difference between Group 1 and Group 2', fontsize=14)
ax2.set_xlabel('Difference', fontsize=12)

# Add value labels on bars
for i, v in enumerate(differences):
    ax2.text(v, i, f' {v:+}', va='center')

# Adjust layout and display
plt.tight_layout()
plt.show()
Output:
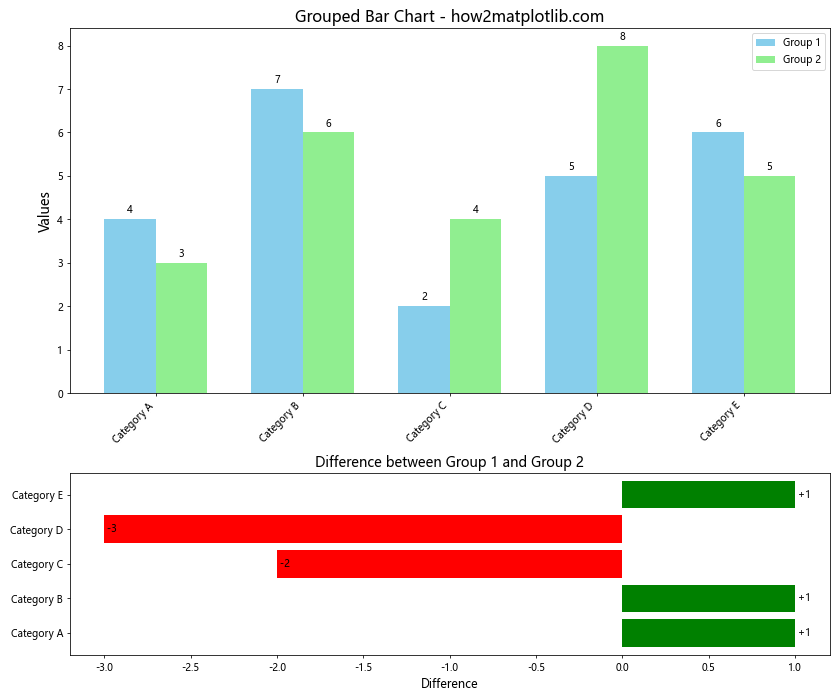
这个例子结合了多种技巧:
1. 创建了一个包含两个子图的复杂图表
2. 上半部分是一个分组条形图,展示了两组数据的对比
33. 使用了不同的颜色来区分两组数据
4. 在每个条形上添加了数值标签
5. 旋转了 X 轴标签以避免重叠
6. 下半部分是一个水平条形图,展示了两组数据之间的差异
7. 使用了颜色编码来表示差异的正负
8. 在水平条形图上添加了带符号的差值标签
这个复杂的图表展示了如何将多种技巧结合起来,创建一个信息丰富、易于理解的可视化。
总结
在本文中,我们详细探讨了如何在 Matplotlib 中创建条形图并旋转 X 轴标签。我们介绍了多种技巧和方法,包括:
- 基本的条形图创建和标签旋转
- 调整标签旋转角度
- 处理长标签和大量类别
- 使用垂直条形图
- 自定义标签样式
- 添加数据标签
- 使用颜色编码增强可读性
- 创建分组和堆叠条形图
- 使用 GridSpec 创建复杂布局
- 动态调整标签旋转角度
- 使用 ax.text() 替代 xticks
- 使用 FuncFormatter 自定义标签格式
- 处理日期标签
- 使用 plt.subplots_adjust() 微调布局
这些技巧可以帮助你创建更加清晰、信息丰富的条形图,有效地解决标签重叠和可读性问题。根据具体的数据和需求,你可以选择最适合的方法或将多种方法结合使用。
在实际应用中,创建有效的数据可视化不仅需要技术知识,还需要对数据有深入的理解,以及对设计原则的把握。通过不断实践和尝试,你可以逐步提高自己创建引人注目且富有洞察力的图表的能力。
记住,好的数据可视化应该能够清晰、准确、高效地传达信息,同时还要考虑到美观性和受众的需求。旋转 X 轴标签只是众多可视化技巧中的一种,它的目的是提高图表的可读性和理解性。在使用这些技巧时,始终要以提高数据传达效果为目标。
 极客笔记
极客笔记