Matplotlib柱状图颜色设置:全面指南与实用技巧
Matplotlib是Python中最流行的数据可视化库之一,它提供了强大而灵活的工具来创建各种类型的图表,包括柱状图。在创建柱状图时,颜色设置是一个重要的方面,它不仅能增强图表的视觉吸引力,还能有效地传达数据信息。本文将深入探讨如何在Matplotlib中设置和自定义柱状图的颜色,涵盖从基础到高级的各种技巧和方法。
1. 基础柱状图颜色设置
在Matplotlib中创建基础柱状图时,我们可以通过简单的参数设置来改变柱子的颜色。最常用的方法是使用color参数。
1.1 单一颜色设置
以下是一个设置单一颜色的简单示例:
import matplotlib.pyplot as plt

categories = ['A', 'B', 'C', 'D']
values = [4, 7, 2, 5]

plt.figure(figsize=(8, 6))
plt.bar(categories, values, color='skyblue')
plt.title('How2matplotlib.com: Basic Bar Chart')
plt.xlabel('Categories')
plt.ylabel('Values')
plt.show()
Output:
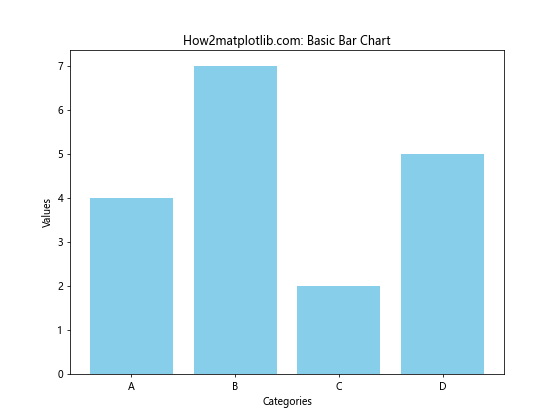
在这个例子中,我们使用color='skyblue'来将所有柱子设置为天蓝色。Matplotlib支持多种颜色名称,如’red’、’green’、’blue’等,也支持十六进制颜色代码。
1.2 使用RGB和RGBA值
除了使用颜色名称,我们还可以使用RGB或RGBA值来精确定义颜色:
import matplotlib.pyplot as plt

categories = ['A', 'B', 'C', 'D']
values = [4, 7, 2, 5]

plt.figure(figsize=(8, 6))
plt.bar(categories, values, color=(0.2, 0.4, 0.6, 0.8))
plt.title('How2matplotlib.com: Bar Chart with RGBA Color')
plt.xlabel('Categories')
plt.ylabel('Values')
plt.show()
Output:
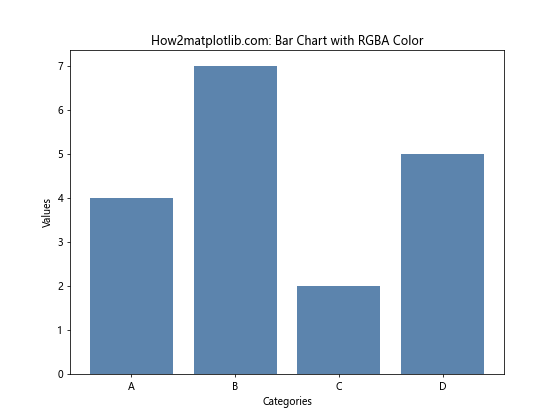
这里,我们使用RGBA值(0.2, 0.4, 0.6, 0.8)来设置柱子的颜色。RGB值范围从0到1,A表示透明度,也是从0(完全透明)到1(完全不透明)。
2. 多色柱状图
有时,我们可能希望在同一个图表中使用不同的颜色来区分不同的类别或强调某些特定的数据点。
2.1 为每个柱子设置不同颜色
我们可以通过传递一个颜色列表来为每个柱子单独设置颜色:
import matplotlib.pyplot as plt

categories = ['A', 'B', 'C', 'D']
values = [4, 7, 2, 5]
colors = ['red', 'green', 'blue', 'yellow']

plt.figure(figsize=(8, 6))
plt.bar(categories, values, color=colors)
plt.title('How2matplotlib.com: Multi-color Bar Chart')
plt.xlabel('Categories')
plt.ylabel('Values')
plt.show()
Output:
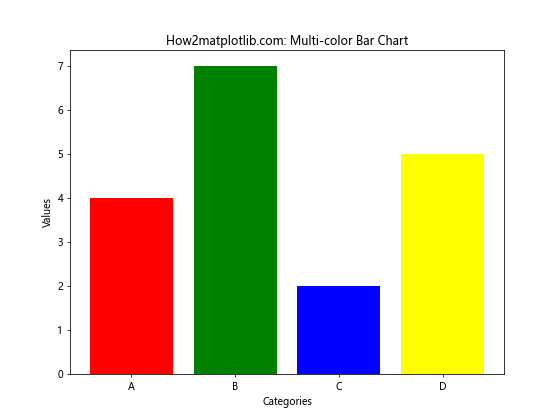
在这个例子中,每个柱子都被赋予了不同的颜色,使得它们更容易区分。
2.2 使用颜色映射(Colormap)
颜色映射是一种更高级的方法,可以根据数据值自动分配颜色:
import matplotlib.pyplot as plt
import numpy as np

categories = ['A', 'B', 'C', 'D', 'E']
values = [4, 7, 2, 5, 8]

plt.figure(figsize=(8, 6))
bars = plt.bar(categories, values)
plt.colorbar(plt.cm.ScalarMappable(cmap='viridis', norm=plt.Normalize(vmin=min(values), vmax=max(values))))

for bar in bars:
    bar.set_color(plt.cm.viridis(bar.get_height() / max(values)))

plt.title('How2matplotlib.com: Bar Chart with Colormap')
plt.xlabel('Categories')
plt.ylabel('Values')
plt.show()
这个例子使用了’viridis’颜色映射,根据柱子的高度自动分配颜色。颜色条(colorbar)显示了颜色与数值的对应关系。
3. 堆叠柱状图的颜色设置
堆叠柱状图是展示多个相关数据系列的有效方式,每个系列可以用不同的颜色表示。
3.1 基础堆叠柱状图
以下是一个简单的堆叠柱状图示例:
import matplotlib.pyplot as plt

categories = ['A', 'B', 'C', 'D']
values1 = [1, 2, 3, 4]
values2 = [2, 3, 4, 5]
values3 = [3, 4, 5, 6]

plt.figure(figsize=(8, 6))
plt.bar(categories, values1, label='Series 1', color='red')
plt.bar(categories, values2, bottom=values1, label='Series 2', color='green')
plt.bar(categories, values3, bottom=[i+j for i,j in zip(values1, values2)], label='Series 3', color='blue')

plt.title('How2matplotlib.com: Stacked Bar Chart')
plt.xlabel('Categories')
plt.ylabel('Values')
plt.legend()
plt.show()
Output:
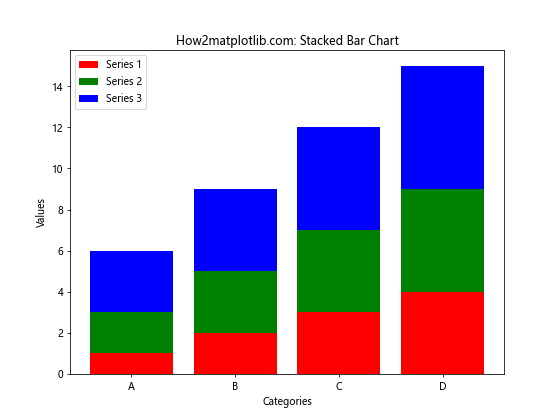
在这个例子中,我们使用bottom参数来堆叠柱子,并为每个系列设置不同的颜色。
3.2 使用自定义颜色方案
为了使堆叠柱状图更具视觉吸引力,我们可以使用自定义的颜色方案:
import matplotlib.pyplot as plt
import seaborn as sns

categories = ['A', 'B', 'C', 'D']
values1 = [1, 2, 3, 4]
values2 = [2, 3, 4, 5]
values3 = [3, 4, 5, 6]

colors = sns.color_palette("pastel")

plt.figure(figsize=(8, 6))
plt.bar(categories, values1, label='Series 1', color=colors[0])
plt.bar(categories, values2, bottom=values1, label='Series 2', color=colors[1])
plt.bar(categories, values3, bottom=[i+j for i,j in zip(values1, values2)], label='Series 3', color=colors[2])

plt.title('How2matplotlib.com: Stacked Bar Chart with Custom Colors')
plt.xlabel('Categories')
plt.ylabel('Values')
plt.legend()
plt.show()
Output:
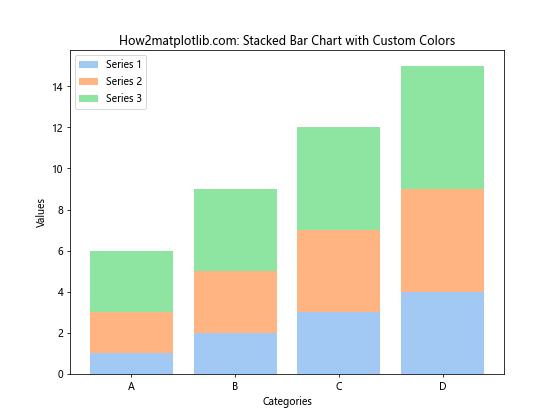
这里我们使用了Seaborn库的color_palette函数来生成一组协调的柔和色彩。
4. 分组柱状图的颜色设置
分组柱状图用于比较多个类别中的不同组。每个组可以用不同的颜色表示。
4.1 基础分组柱状图
以下是一个简单的分组柱状图示例:
import matplotlib.pyplot as plt
import numpy as np

categories = ['A', 'B', 'C', 'D']
values1 = [1, 2, 3, 4]
values2 = [2, 3, 4, 5]
values3 = [3, 4, 5, 6]

x = np.arange(len(categories))
width = 0.25

plt.figure(figsize=(10, 6))
plt.bar(x - width, values1, width, label='Series 1', color='red')
plt.bar(x, values2, width, label='Series 2', color='green')
plt.bar(x + width, values3, width, label='Series 3', color='blue')

plt.title('How2matplotlib.com: Grouped Bar Chart')
plt.xlabel('Categories')
plt.ylabel('Values')
plt.xticks(x, categories)
plt.legend()
plt.show()
Output:
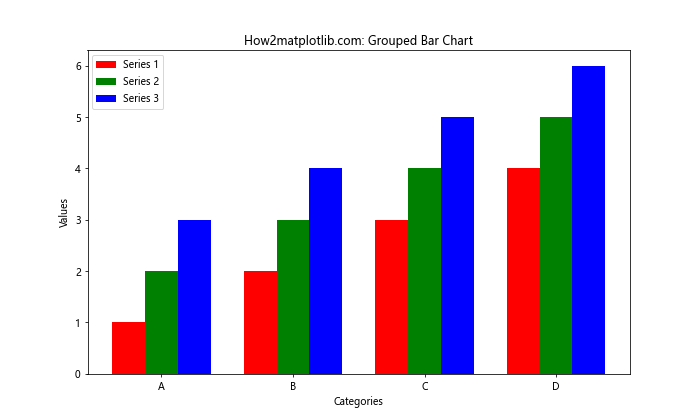
在这个例子中,我们使用width参数来控制柱子的宽度,并通过调整x坐标来并排放置柱子。
4.2 使用颜色循环
为了避免手动指定每个系列的颜色,我们可以使用Matplotlib的颜色循环:
import matplotlib.pyplot as plt
import numpy as np

categories = ['A', 'B', 'C', 'D']
values1 = [1, 2, 3, 4]
values2 = [2, 3, 4, 5]
values3 = [3, 4, 5, 6]

x = np.arange(len(categories))
width = 0.25

plt.figure(figsize=(10, 6))
plt.bar(x - width, values1, width, label='Series 1')
plt.bar(x, values2, width, label='Series 2')
plt.bar(x + width, values3, width, label='Series 3')

plt.title('How2matplotlib.com: Grouped Bar Chart with Color Cycle')
plt.xlabel('Categories')
plt.ylabel('Values')
plt.xticks(x, categories)
plt.legend()
plt.show()
Output:
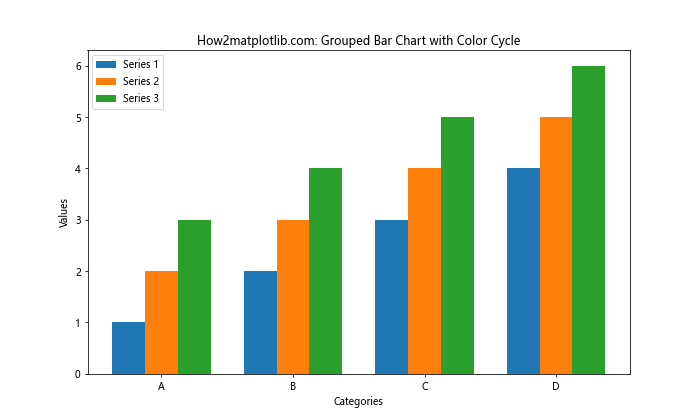
这个例子中,我们没有明确指定颜色,Matplotlib会自动使用其默认的颜色循环。
5. 高级颜色技巧
除了基本的颜色设置,Matplotlib还提供了一些高级技巧来增强柱状图的视觉效果。
5.1 渐变色填充
我们可以使用渐变色来填充柱子,这样可以创造出更有深度的视觉效果:
import matplotlib.pyplot as plt
import numpy as np

categories = ['A', 'B', 'C', 'D']
values = [4, 7, 2, 5]

plt.figure(figsize=(8, 6))
bars = plt.bar(categories, values)

for bar in bars:
    bar.set_facecolor('none')
    x, y = bar.get_xy()
    w, h = bar.get_width(), bar.get_height()
    grad = plt.imshow(np.arange(h).reshape(h,1), cmap='Blues', extent=[x,x+w,y,y+h], aspect='auto', zorder=0, alpha=0.8)
    grad.set_clip_path(bar.get_path(), transform=plt.gca().transData)

plt.title('How2matplotlib.com: Bar Chart with Gradient Fill')
plt.xlabel('Categories')
plt.ylabel('Values')
plt.show()
Output:
这个例子使用了imshow函数来创建渐变效果,并将其裁剪到柱子的形状内。
5.2 边缘高亮
我们可以为柱子添加边缘高亮效果,使其更加突出:
import matplotlib.pyplot as plt

categories = ['A', 'B', 'C', 'D']
values = [4, 7, 2, 5]

plt.figure(figsize=(8, 6))
bars = plt.bar(categories, values, color='skyblue', edgecolor='navy', linewidth=2)

for bar in bars:
    height = bar.get_height()
    plt.text(bar.get_x() + bar.get_width()/2., height,
             f'{height}',
             ha='center', va='bottom')

plt.title('How2matplotlib.com: Bar Chart with Edge Highlight')
plt.xlabel('Categories')
plt.ylabel('Values')
plt.show()
Output:
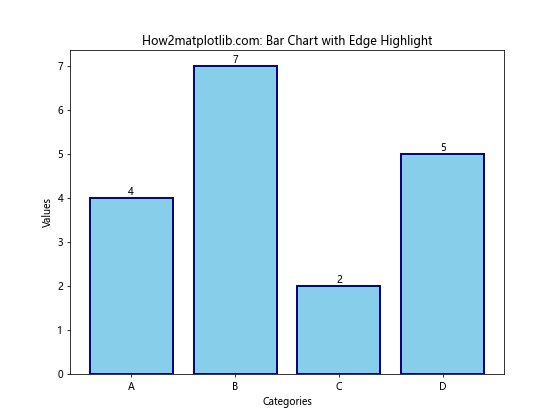
这个例子中,我们使用edgecolor参数来设置边缘颜色,linewidth参数来设置边缘宽度。
5.3 颜色映射与数据关联
我们可以根据数据值来动态设置柱子的颜色:
import matplotlib.pyplot as plt
import numpy as np

categories = ['A', 'B', 'C', 'D', 'E']
values = [4, 7, 2, 5, 8]

plt.figure(figsize=(8, 6))
colors = plt.cm.viridis(np.linspace(0, 1, len(values)))
bars = plt.bar(categories, values, color=colors)

plt.colorbar(plt.cm.ScalarMappable(cmap='viridis', norm=plt.Normalize(vmin=min(values), vmax=max(values))))

plt.title('How2matplotlib.com: Bar Chart with Color Mapping')
plt.xlabel('Categories')
plt.ylabel('Values')
plt.show()
这个例子使用viridis颜色映射来根据数值大小设置柱子颜色,并添加了颜色条来显示颜色与数值的对应关系。
6. 自定义颜色方案
创建自定义颜色方案可以使你的图表更加独特和专业。
6.1 使用自定义颜色列表
你可以定义自己的颜色列表来创建独特的配色方案:
import matplotlib.pyplot as plt

categories = ['A', 'B', 'C', 'D', 'E']
values = [4, 7, 2, 5, 8]

custom_colors = ['#FF9999', '#66B2FF', '#99FF99', '#FFCC99', '#FF99CC']

plt.figure(figsize=(8, 6))
plt.bar(categories, values, color=custom_colors)

plt.title('How2matplotlib.com: Bar Chart with Custom Color Scheme')
plt.xlabel('Categories')
plt.ylabel('Values')
plt.show()
Output:
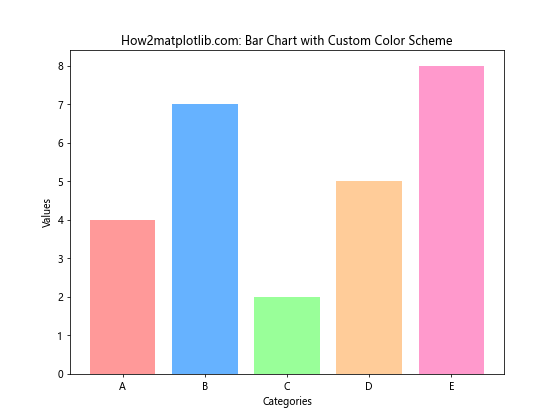
这个例子使用了自定义的十六进制颜色代码列表来为每个柱子设置不同的颜色。
6.2 使用颜色库
你可以使用如Seaborn这样的颜色库来生成协调的颜色方案:
import matplotlib.pyplot as plt
import seaborn as sns

categories = ['A', 'B', 'C', 'D', 'E']
values = [4, 7, 2, 5, 8]

colors = sns.color_palette("husl", 5)

plt.figure(figsize=(8, 6))
plt.bar(categories, values, color=colors)

plt.title('How2matplotlib.com: Bar Chart with Seaborn Color Palette')
plt.xlabel('Categories')
plt.ylabel('Values')
plt.show()
Output:
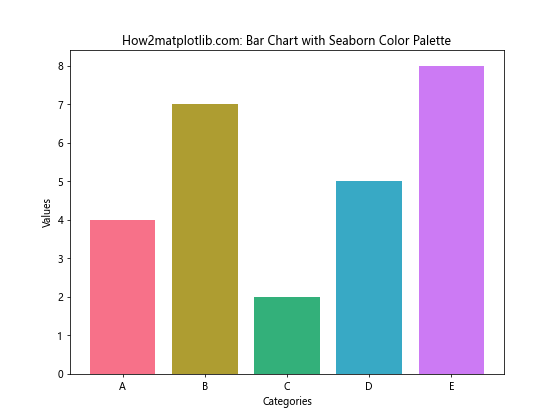
这个例子使用了Seaborn的color_palette函数来生成一组和谐的颜色。
7. 颜色与数据关系的可视化
颜色不仅可以用来美化图表,还可以用来传达额外的数据信息。
7.1 使用颜色表示数据范围
我们可以使用颜色来表示数据的不同范围:
import matplotlib.pyplot as plt
import numpy as np

categories = ['A', 'B', 'C', 'D', 'E']
values = [4, 7, 2, 5, 8]

plt.figure(figsize=(8, 6))
bars = plt.bar(categories, values)

for bar in bars:
    if bar.get_height() < 5:
        bar.set_color('lightblue')
    elif 5 <= bar.get_height() < 7:
        bar.set_color('skyblue')
    else:
        bar.set_color('navy')

plt.title('How2matplotlib.com: Bar Chart with Color-Coded Ranges')
plt.xlabel('Categories')
plt.ylabel('Values')
plt.show()
Output:
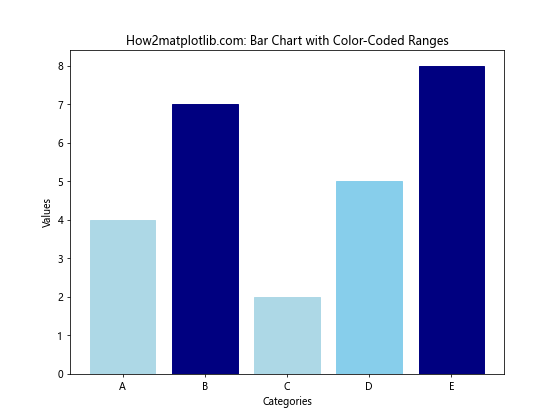
这个例子根据数值的大小将柱子分为三个颜色范围,直观地展示了数据的分布情况。
7.2 使用颜色强调特定数据
我们可以使用颜色来强调某些特定的数据点:
import matplotlib.pyplot as plt

categories = ['A', 'B', 'C', 'D', 'E']
values = [4, 7, 2, 5, 8]

plt.figure(figsize=(8, 6))
bars = plt.bar(categories, values, color='lightgray')

# 强调最大值和最小值
max_value = max(values)
min_value = min(values)

for bar in bars:
    if bar.get_height() == max_value:
        bar.set_color('red')
    elif bar.get_height() == min_value:
        bar.set_color('blue')

plt.title('How2matplotlib.com: Bar Chart with Emphasized Data Points')
plt.xlabel('Categories')
plt.ylabel('Values')
plt.show()
Output:
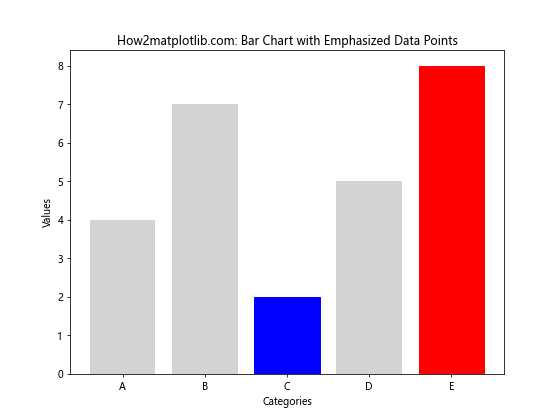
这个例子使用红色和蓝色分别强调了最大值和最小值,使它们在图表中更加突出。
8. 动态颜色设置
在某些情况下,我们可能需要根据数据的变化动态设置颜色。
8.1 基于阈值的动态颜色设置
我们可以根据预设的阈值动态设置柱子的颜色:
import matplotlib.pyplot as plt
import numpy as np

categories = ['A', 'B', 'C', 'D', 'E']
values = [4, 7, 2, 5, 8]

plt.figure(figsize=(8, 6))
bars = plt.bar(categories, values)

threshold = np.mean(values)

for bar in bars:
    if bar.get_height() >= threshold:
        bar.set_color('green')
    else:
        bar.set_color('red')

plt.axhline(y=threshold, color='black', linestyle='--', label='Threshold')

plt.title('How2matplotlib.com: Bar Chart with Dynamic Colors Based on Threshold')
plt.xlabel('Categories')
plt.ylabel('Values')
plt.legend()
plt.show()
Output:
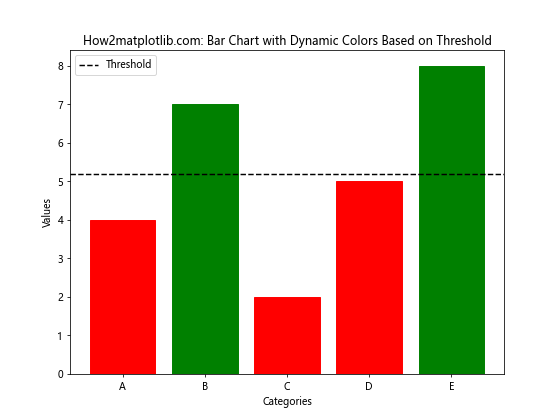
这个例子根据数值是否超过平均值来动态设置柱子的颜色,并添加了一条表示阈值的虚线。
8.2 使用颜色映射进行动态着色
我们可以使用颜色映射来根据数值大小动态设置颜色:
import matplotlib.pyplot as plt
import numpy as np

categories = ['A', 'B', 'C', 'D', 'E']
values = [4, 7, 2, 5, 8]

plt.figure(figsize=(8, 6))
cmap = plt.cm.get_cmap('RdYlGn')
colors = cmap(np.array(values) / max(values))

bars = plt.bar(categories, values, color=colors)

sm = plt.cm.ScalarMappable(cmap=cmap, norm=plt.Normalize(vmin=min(values), vmax=max(values)))
sm.set_array([])
cbar = plt.colorbar(sm)

plt.title('How2matplotlib.com: Bar Chart with Dynamic Color Mapping')
plt.xlabel('Categories')
plt.ylabel('Values')
plt.show()
这个例子使用了’RdYlGn’颜色映射,根据数值的大小动态设置柱子的颜色,从红色(低值)到绿色(高值)。
9. 颜色与图表主题的协调
选择合适的颜色不仅要考虑数据的表现,还要考虑整体图表主题的协调性。
9.1 使用暗色主题
有时我们可能需要创建暗色主题的图表,这需要相应地调整颜色选择:
import matplotlib.pyplot as plt

plt.style.use('dark_background')

categories = ['A', 'B', 'C', 'D', 'E']
values = [4, 7, 2, 5, 8]

plt.figure(figsize=(8, 6))
plt.bar(categories, values, color='lightblue', edgecolor='white')

plt.title('How2matplotlib.com: Bar Chart with Dark Theme', color='white')
plt.xlabel('Categories', color='white')
plt.ylabel('Values', color='white')
plt.tick_params(colors='white')
plt.show()
Output:
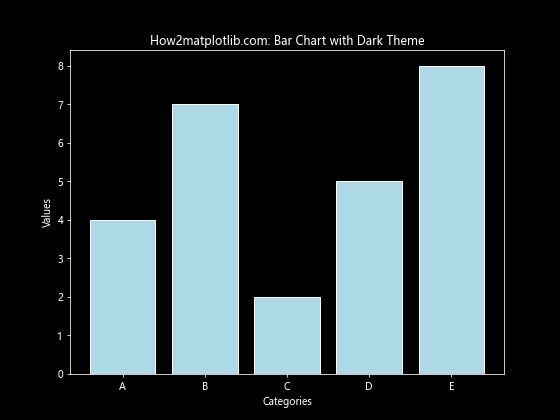
这个例子使用了Matplotlib的暗色背景样式,并相应地调整了柱子和文本的颜色,以确保良好的可读性。
9.2 使用品牌色彩
如果你正在为特定品牌创建图表,可能需要使用品牌专属的颜色:
import matplotlib.pyplot as plt

categories = ['A', 'B', 'C', 'D', 'E']
values = [4, 7, 2, 5, 8]

# 假设这是品牌的主色和辅助色
brand_primary = '#1E88E5'
brand_secondary = '#FFC107'

plt.figure(figsize=(8, 6))
bars = plt.bar(categories, values, color=brand_primary)

# 突出显示最高值
max_value = max(values)
for bar in bars:
    if bar.get_height() == max_value:
        bar.set_color(brand_secondary)

plt.title('How2matplotlib.com: Bar Chart with Brand Colors', color=brand_primary)
plt.xlabel('Categories', color=brand_primary)
plt.ylabel('Values', color=brand_primary)
plt.tick_params(colors=brand_primary)
plt.show()
Output:
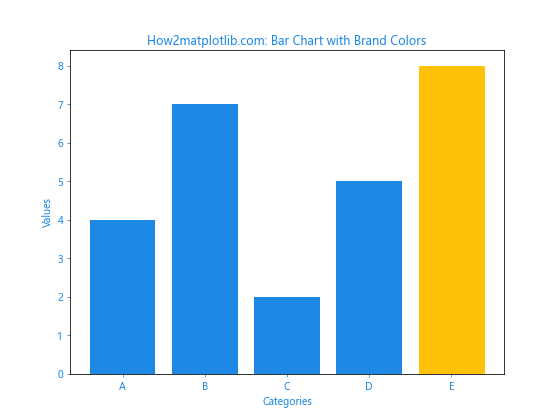
这个例子使用了假设的品牌主色和辅助色来创建一个与品牌一致的图表风格。
10. 颜色无障碍性考虑
在设计图表时,考虑颜色无障碍性是很重要的,以确保所有人都能正确理解你的数据可视化。
10.1 使用色盲友好的颜色方案
我们可以使用专门设计的色盲友好颜色方案:
import matplotlib.pyplot as plt
import seaborn as sns

categories = ['A', 'B', 'C', 'D', 'E']
values = [4, 7, 2, 5, 8]

# 使用色盲友好的调色板
colors = sns.color_palette("colorblind")

plt.figure(figsize=(8, 6))
plt.bar(categories, values, color=colors)

plt.title('How2matplotlib.com: Bar Chart with Colorblind-friendly Colors')
plt.xlabel('Categories')
plt.ylabel('Values')
plt.show()
Output:
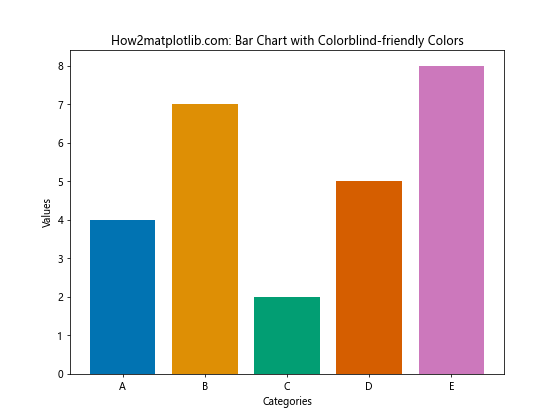
这个例子使用了Seaborn的色盲友好调色板,确保图表对色盲观众也同样清晰可读。
10.2 使用图案填充代替颜色
对于需要高度区分的情况,我们可以使用图案填充来代替或补充颜色:
import matplotlib.pyplot as plt
import numpy as np

categories = ['A', 'B', 'C', 'D', 'E']
values = [4, 7, 2, 5, 8]

plt.figure(figsize=(8, 6))
bars = plt.bar(categories, values)

patterns = ['/', '\\', '|', '-', '+']
for bar, pattern in zip(bars, patterns):
    bar.set_hatch(pattern)
    bar.set_facecolor('white')
    bar.set_edgecolor('black')

plt.title('How2matplotlib.com: Bar Chart with Pattern Fills')
plt.xlabel('Categories')
plt.ylabel('Values')
plt.show()
Output:
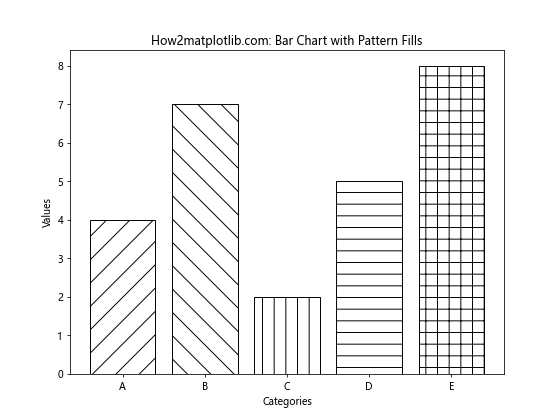
这个例子使用了不同的填充图案来区分各个柱子,这种方法在黑白打印时特别有用。
结论
通过本文的详细探讨,我们了解了Matplotlib中柱状图颜色设置的多种方法和技巧。从基础的单色设置到高级的动态颜色映射,从堆叠和分组柱状图的颜色处理到考虑颜色无障碍性,我们涵盖了广泛的主题。这些技巧不仅可以增强图表的视觉吸引力,还能更有效地传达数据信息。
在实际应用中,选择合适的颜色方案需要考虑多个因素,包括数据的性质、目标受众、展示环境等。通过灵活运用这些颜色设置技巧,你可以创建出既美观又富有信息量的柱状图,使你的数据可视化更加专业和有效。
记住,好的数据可视化不仅仅是about美观,更重要的是能够清晰、准确地传达信息。因此,在使用这些颜色技巧时,始终要把数据的清晰表达放在首位。通过实践和经验的积累,你将能够在Matplotlib中创建出既美观又富有洞察力的柱状图。
 极客笔记
极客笔记