Matplotlib中的axis.Tick.set_sketch_params()函数详解与应用
参考:Matplotlib.axis.Tick.set_sketch_params() function in Python
Matplotlib是Python中最流行的数据可视化库之一,它提供了丰富的绘图功能和自定义选项。在Matplotlib中,axis.Tick.set_sketch_params()函数是一个强大的工具,用于设置坐标轴刻度的草图效果。本文将深入探讨这个函数的用法、参数和应用场景,帮助您更好地理解和使用它来增强您的数据可视化效果。
1. 什么是axis.Tick.set_sketch_params()函数?
axis.Tick.set_sketch_params()函数是Matplotlib库中axis.Tick类的一个方法。它允许用户为坐标轴的刻度设置草图效果,使得刻度线看起来更像手绘的效果。这个函数可以为您的图表添加一种独特的视觉风格,特别适合用于创建具有手绘感或草图风格的图表。
基本语法
import matplotlib.pyplot as plt

fig, ax = plt.subplots()
for tick in ax.xaxis.get_major_ticks():
    tick.set_sketch_params(scale=1, length=100, randomness=0.1)

plt.title("How2matplotlib.com - Basic Sketch Params")
plt.show()
Output:
在这个基本示例中,我们遍历x轴的主要刻度,并为每个刻度设置草图参数。scale参数控制草图效果的整体大小,length控制线条的长度,randomness控制线条的随机性。
2. 函数参数详解
set_sketch_params()函数接受以下参数:
scale:控制草图效果的整体大小。默认值为1。length:控制草图线条的长度。默认值为None。randomness:控制线条的随机性。默认值为None。
这些参数可以单独使用,也可以组合使用,以创建不同的视觉效果。
示例:调整scale参数
import matplotlib.pyplot as plt

fig, ax = plt.subplots()
for tick in ax.xaxis.get_major_ticks():
    tick.set_sketch_params(scale=2)

plt.title("How2matplotlib.com - Adjusting Scale")
plt.show()
Output:
在这个例子中,我们将scale参数设置为2,这会使草图效果变得更大。
示例:调整length参数
import matplotlib.pyplot as plt

fig, ax = plt.subplots()
for tick in ax.xaxis.get_major_ticks():
    tick.set_sketch_params(length=50)

plt.title("How2matplotlib.com - Adjusting Length")
plt.show()
Output:
这里我们设置length参数为50,这会影响草图线条的长度。
示例:调整randomness参数
import matplotlib.pyplot as plt

fig, ax = plt.subplots()
for tick in ax.xaxis.get_major_ticks():
    tick.set_sketch_params(randomness=0.5)

plt.title("How2matplotlib.com - Adjusting Randomness")
plt.show()
Output:
通过将randomness设置为0.5,我们增加了线条的随机性,使其看起来更像手绘。
3. 应用场景
set_sketch_params()函数在多种场景下都能发挥作用,特别是当您想要创建具有独特视觉风格的图表时。以下是一些常见的应用场景:
3.1 创建手绘风格的图表
import matplotlib.pyplot as plt
import numpy as np

x = np.linspace(0, 10, 100)
y = np.sin(x)

fig, ax = plt.subplots()
ax.plot(x, y)

for tick in ax.xaxis.get_major_ticks() + ax.yaxis.get_major_ticks():
    tick.set_sketch_params(scale=1, length=100, randomness=0.2)

ax.set_title("How2matplotlib.com - Hand-drawn Style Chart")
plt.show()
Output:
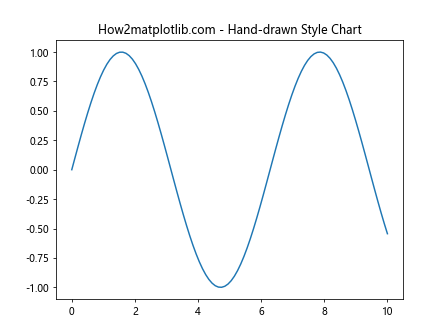
这个例子展示了如何创建一个看起来像手绘的正弦波图。我们对x轴和y轴的刻度都应用了草图效果。
3.2 强调特定刻度
import matplotlib.pyplot as plt
import numpy as np

fig, ax = plt.subplots()
x = np.arange(0, 5, 0.5)
y = np.random.randn(len(x))
ax.bar(x, y)

for tick in ax.xaxis.get_major_ticks()[::2]:  # 每隔一个刻度
    tick.set_sketch_params(scale=2, length=50, randomness=0.1)

ax.set_title("How2matplotlib.com - Emphasizing Specific Ticks")
plt.show()
Output:
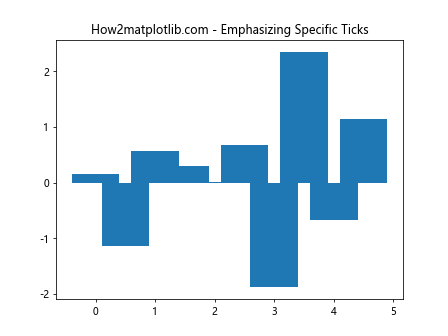
在这个柱状图中,我们只对x轴的偶数刻度应用了草图效果,从而强调了这些特定的刻度。
3.3 创建艺术风格的图表
import matplotlib.pyplot as plt
import numpy as np

fig, ax = plt.subplots()
x = np.linspace(0, 10, 100)
y1 = np.sin(x)
y2 = np.cos(x)

ax.plot(x, y1, label='sin')
ax.plot(x, y2, label='cos')

for tick in ax.xaxis.get_major_ticks() + ax.yaxis.get_major_ticks():
    tick.set_sketch_params(scale=1.5, length=80, randomness=0.3)

ax.legend()
ax.set_title("How2matplotlib.com - Artistic Style Chart")
plt.show()
Output:
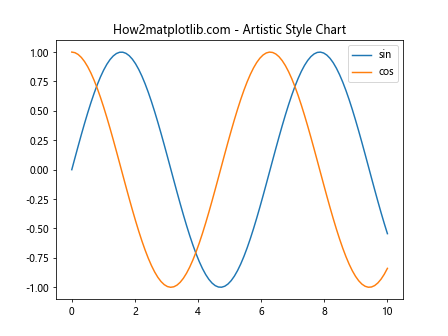
这个例子展示了如何创建一个具有艺术风格的正弦和余弦函数图。通过对所有刻度应用草图效果,整个图表呈现出一种独特的艺术感。
4. 高级技巧
4.1 结合其他刻度设置
set_sketch_params()函数可以与其他刻度设置方法结合使用,以创建更复杂的视觉效果。
import matplotlib.pyplot as plt
import numpy as np

fig, ax = plt.subplots()
x = np.linspace(0, 10, 100)
y = np.sin(x)
ax.plot(x, y)

for tick in ax.xaxis.get_major_ticks():
    tick.set_sketch_params(scale=1.5, length=60, randomness=0.2)
    tick.label.set_fontsize(14)
    tick.label.set_rotation(45)

ax.set_title("How2matplotlib.com - Advanced Tick Styling")
plt.show()
在这个例子中,我们不仅应用了草图效果,还调整了刻度标签的字体大小和旋转角度。
4.2 动态调整草图参数
您可以根据数据或其他条件动态调整草图参数。
import matplotlib.pyplot as plt
import numpy as np

fig, ax = plt.subplots()
x = np.arange(0, 10, 1)
y = np.random.randn(10)
ax.bar(x, y)

for i, tick in enumerate(ax.xaxis.get_major_ticks()):
    randomness = i / 10  # 随着刻度增加,随机性增加
    tick.set_sketch_params(scale=1, length=50, randomness=randomness)

ax.set_title("How2matplotlib.com - Dynamic Sketch Params")
plt.show()
Output:
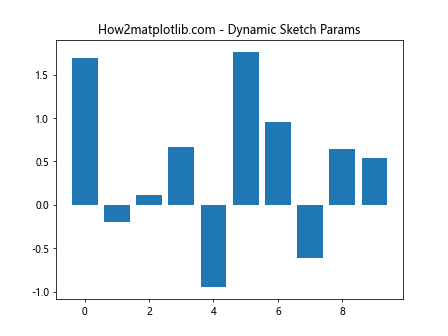
这个例子展示了如何根据刻度的位置动态调整随机性参数。
4.3 应用于子图
当使用子图时,您可以为每个子图单独设置草图参数。
import matplotlib.pyplot as plt
import numpy as np

fig, (ax1, ax2) = plt.subplots(1, 2, figsize=(12, 5))

x = np.linspace(0, 10, 100)
ax1.plot(x, np.sin(x))
ax2.plot(x, np.cos(x))

for tick in ax1.xaxis.get_major_ticks():
    tick.set_sketch_params(scale=1, length=50, randomness=0.1)

for tick in ax2.xaxis.get_major_ticks():
    tick.set_sketch_params(scale=1.5, length=70, randomness=0.2)

fig.suptitle("How2matplotlib.com - Sketch Params in Subplots")
plt.show()
Output:
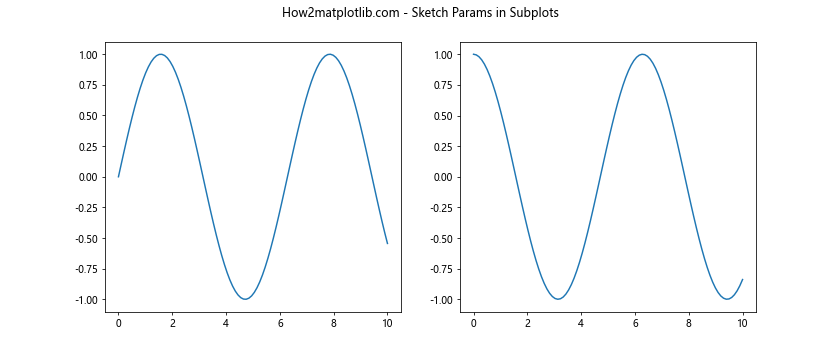
这个例子展示了如何为两个不同的子图设置不同的草图参数。
5. 注意事项和最佳实践
在使用set_sketch_params()函数时,有一些注意事项和最佳实践需要考虑:
- 适度使用:过度使用草图效果可能会使图表变得混乱或难以阅读。请适度使用,确保不影响数据的清晰呈现。
-
考虑图表类型:某些类型的图表(如散点图或线图)可能比其他类型(如饼图或热图)更适合使用草图效果。
-
与整体风格协调:确保草图效果与图表的整体风格和主题相协调。
-
性能考虑:在处理大量数据或复杂图表时,添加草图效果可能会影响渲染性能。在这种情况下,可以考虑只对部分重要的刻度应用效果。
-
保持一致性:如果在一个项目或报告中使用多个图表,请保持草图效果的一致性,以维持整体的视觉连贯性。
示例:平衡使用草图效果
import matplotlib.pyplot as plt
import numpy as np

fig, ax = plt.subplots(figsize=(10, 6))

x = np.linspace(0, 10, 100)
y1 = np.sin(x)
y2 = np.cos(x)

ax.plot(x, y1, label='sin')
ax.plot(x, y2, label='cos')

# 只对x轴应用草图效果
for tick in ax.xaxis.get_major_ticks():
    tick.set_sketch_params(scale=1, length=50, randomness=0.1)

ax.legend()
ax.set_title("How2matplotlib.com - Balanced Use of Sketch Effect")
plt.show()
Output:
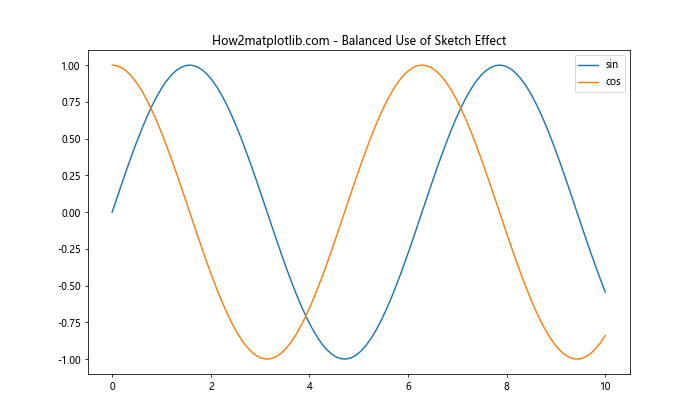
这个例子展示了如何平衡使用草图效果。我们只对x轴应用了草图效果,保持y轴的清晰度,从而在视觉吸引力和数据清晰度之间取得平衡。
6. 高级应用:结合其他Matplotlib功能
set_sketch_params()函数可以与Matplotlib的其他高级功能结合使用,创造出更加复杂和吸引人的可视化效果。
6.1 结合自定义刻度定位器
import matplotlib.pyplot as plt
import numpy as np
from matplotlib.ticker import MultipleLocator

fig, ax = plt.subplots(figsize=(10, 6))

x = np.linspace(0, 10, 100)
y = np.sin(x)

ax.plot(x, y)

# 设置自定义刻度定位器
ax.xaxis.set_major_locator(MultipleLocator(base=1.0))
ax.yaxis.set_major_locator(MultipleLocator(base=0.5))

# 应用草图效果
for tick in ax.xaxis.get_major_ticks() + ax.yaxis.get_major_ticks():
    tick.set_sketch_params(scale=1, length=50, randomness=0.2)

ax.set_title("How2matplotlib.com - Custom Tick Locator with Sketch Effect")
plt.show()
Output:
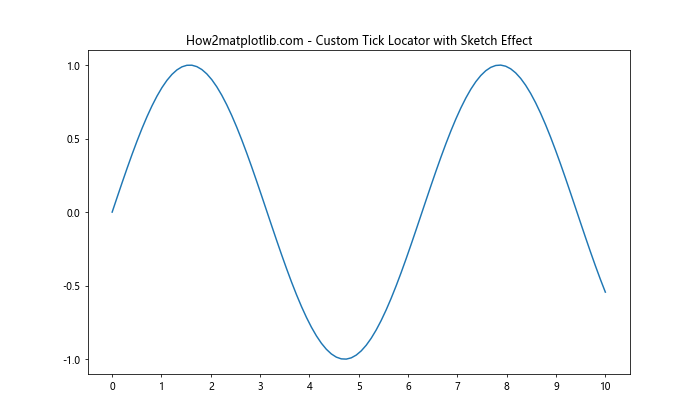
这个例子展示了如何结合自定义刻度定位器和草图效果。我们使用MultipleLocator来设置刻度间隔,然后对这些自定义刻度应用草图效果。
6.2 动画效果中的草图参数
import matplotlib.pyplot as plt
import numpy as np
from matplotlib.animation import FuncAnimation

fig, ax = plt.subplots()

x = np.linspace(0, 2*np.pi, 100)
line, = ax.plot(x, np.sin(x))

def animate(i):
    line.set_ydata(np.sin(x + i/10))
    for tick in ax.xaxis.get_major_ticks():
        tick.set_sketch_params(scale=1, length=50, randomness=np.random.random()*0.3)
    return line,

ani = FuncAnimation(fig, animate, frames=100, blit=True)

ax.set_title("How2matplotlib.com - Animated Sketch Effect")
plt.show()
Output:
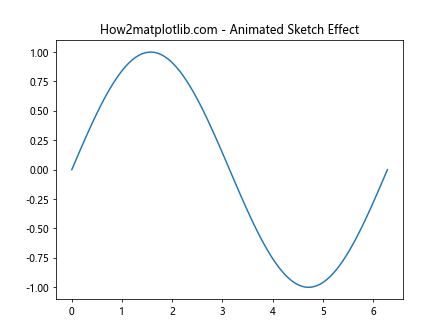
这个例子展示了如何在动画中使用草图效果。每一帧都会更新草图参数,创造出动态变化的视觉效果。
6.3 结合颜色映射
import matplotlib.pyplot as plt
import numpy as np

fig, ax = plt.subplots(figsize=(10, 6))

x = np.linspace(0, 10, 20)
y = np.random.rand(20)
colors = plt.cm.viridis(y)

scatter = ax.scatter(x, y, c=colors)

for tick in ax.xaxis.get_major_ticks() + ax.yaxis.get_major_ticks():
    tick.set_sketch_params(scale=1, length=50, randomness=0.2)

plt.colorbar(scatter)
ax.set_title("How2matplotlib.com - Sketch Effect with Color Mapping")
plt.show()
Output:
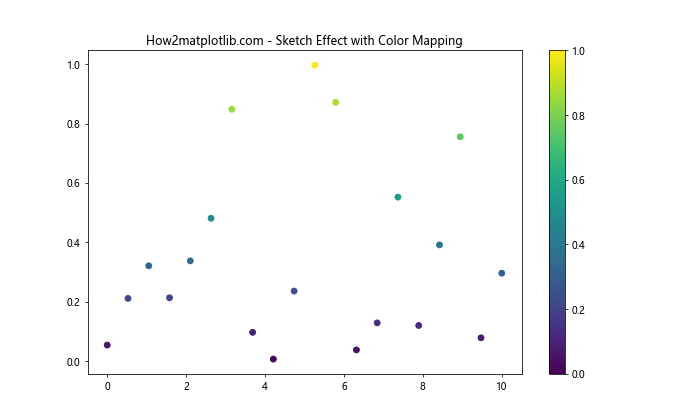
这个例子展示了如何将草图效果与颜色映射结合使用。我们创建了一个散点图,使用颜色映射来表示数据值,同时对坐标轴刻度应用草图效果。
7. 常见问题和解决方案
在使用set_sketch_params()函数时,您可能会遇到一些常见问题。以下是一些问题及其解决方案:
7.1 草图效果不明显
如果您发现草图效果不够明显,可以尝试以下解决方案:
import matplotlib.pyplot as plt
import numpy as np

fig, ax = plt.subplots(figsize=(10, 6))

x = np.linspace(0, 10, 100)
y = np.sin(x)
ax.plot(x, y)

for tick in ax.xaxis.get_major_ticks() + ax.yaxis.get_major_ticks():
    tick.set_sketch_params(scale=2, length=100, randomness=0.5)

ax.set_title("How2matplotlib.com - Enhanced Sketch Effect")
plt.show()
Output:
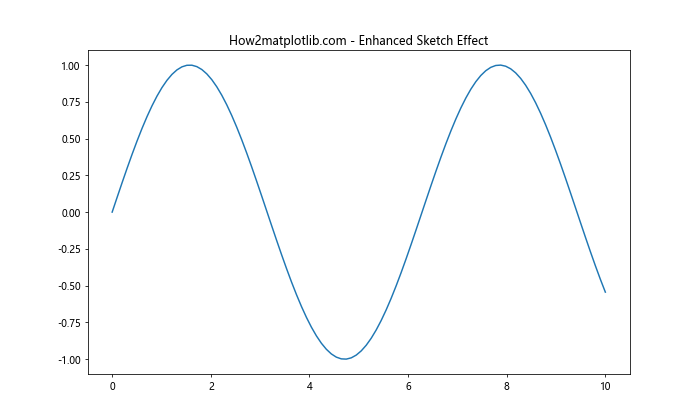
在这个例子中,我们增加了scale、length和randomness参数的值,使草图效果更加明显。
7.2 草图效果影响图表可读性
如果草图效果影响了图表的可读性,可以尝试以下方法:
import matplotlib.pyplot as plt
import numpy as np

fig, ax = plt.subplots(figsize=(10, 6))

x = np.linspace(0, 10, 100)
y = np.sin(x)
ax.plot(x, y)

for tick in ax.xaxis.get_major_ticks():
    tick.set_sketch_params(scale=0.5, length=30, randomness=0.1)

ax.set_title("How2matplotlib.com - Subtle Sketch Effect")
plt.show()
Output:
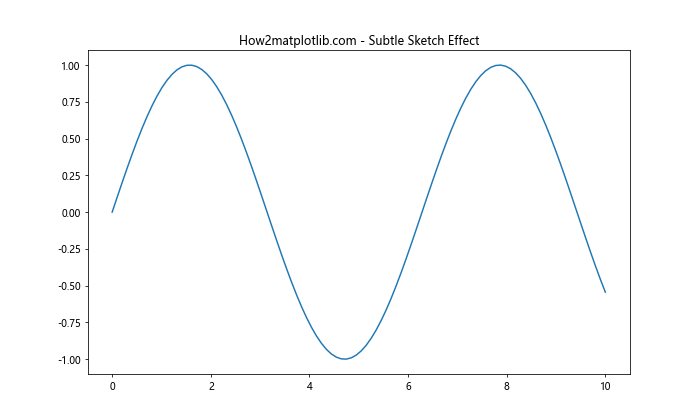
这个例子展示了如何使用较小的参数值来创建更微妙的草图效果,从而不影响图表的整体可读性。
7.3 草图效果不一致
如果您发现不同刻度的草图效果不一致,可以使用循环来确保一致性:
import matplotlib.pyplot as plt
import numpy as np

fig, ax = plt.subplots(figsize=(10, 6))

x = np.linspace(0, 10, 100)
y = np.sin(x)
ax.plot(x, y)

np.random.seed(42)  # 设置随机种子以确保一致性
for tick in ax.xaxis.get_major_ticks() + ax.yaxis.get_major_ticks():
    tick.set_sketch_params(scale=1, length=50, randomness=np.random.random()*0.2)

ax.set_title("How2matplotlib.com - Consistent Sketch Effect")
plt.show()
Output:
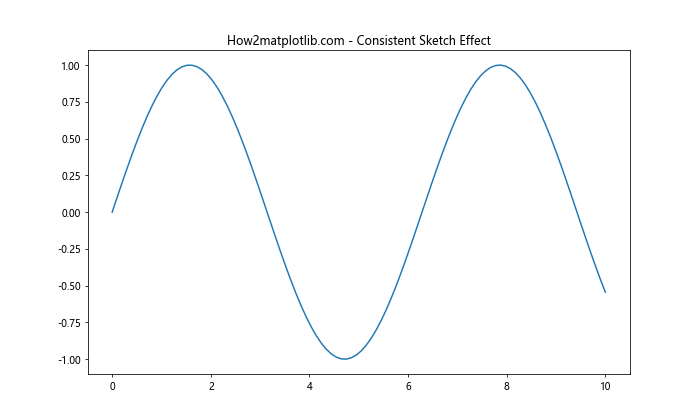
通过设置随机种子和使用相同的随机范围,我们可以确保草图效果在不同刻度之间保持一致。
8. 高级定制:创建自定义草图样式
您可以创建自定义的草图样式函数,以实现更加个性化的效果:
import matplotlib.pyplot as plt
import numpy as np

def custom_sketch_style(scale=1, length=50, randomness=0.1):
    def sketch(x, y, w, h, mutation_scale):
        np.random.seed(int(x * 100 + y * 100))
        dx = w * scale * np.random.normal(0, randomness, size=2)
        dy = h * scale * np.random.normal(0, randomness, size=2)
        path = [
            (x, y),
            (x + dx[0], y + dy[0]),
            (x + w, y + h),
            (x + w + dx[1], y + h + dy[1])
        ]
        return path

    return sketch

fig, ax = plt.subplots(figsize=(10, 6))

x = np.linspace(0, 10, 100)
y = np.sin(x)
ax.plot(x, y)

custom_style = custom_sketch_style(scale=1.5, length=70, randomness=0.2)
for tick in ax.xaxis.get_major_ticks() + ax.yaxis.get_major_ticks():
    tick.set_sketch_params(path_effects=[plt.PathEffects.withSketch(custom_style)])

ax.set_title("How2matplotlib.com - Custom Sketch Style")
plt.show()
这个例子展示了如何创建和应用自定义的草图样式。通过定义自己的草图函数,您可以实现更加独特和复杂的视觉效果。
9. 在不同类型的图表中应用草图效果
set_sketch_params()函数可以应用于各种类型的图表。以下是一些在不同图表类型中应用草图效果的例子:
9.1 柱状图
import matplotlib.pyplot as plt
import numpy as np

fig, ax = plt.subplots(figsize=(10, 6))

x = np.arange(5)
y = np.random.rand(5)

ax.bar(x, y)

for tick in ax.xaxis.get_major_ticks() + ax.yaxis.get_major_ticks():
    tick.set_sketch_params(scale=1, length=50, randomness=0.2)

ax.set_title("How2matplotlib.com - Bar Chart with Sketch Effect")
plt.show()
Output:
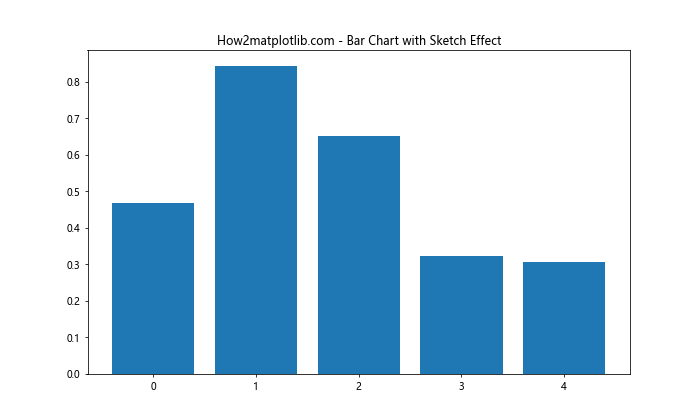
这个例子展示了如何在柱状图中应用草图效果,为简单的数据可视化添加艺术感。
9.2 散点图
import matplotlib.pyplot as plt
import numpy as np

fig, ax = plt.subplots(figsize=(10, 6))

x = np.random.rand(50)
y = np.random.rand(50)

ax.scatter(x, y)

for tick in ax.xaxis.get_major_ticks() + ax.yaxis.get_major_ticks():
    tick.set_sketch_params(scale=1, length=40, randomness=0.3)

ax.set_title("How2matplotlib.com - Scatter Plot with Sketch Effect")
plt.show()
Output:
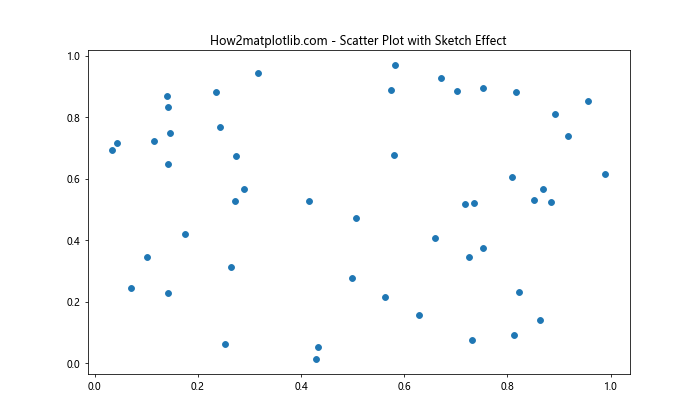
在这个散点图例子中,草图效果为数据点之间的关系添加了一种手绘的质感。
9.3 饼图
import matplotlib.pyplot as plt

fig, ax = plt.subplots(figsize=(10, 6))

sizes = [30, 20, 25, 15, 10]
labels = ['A', 'B', 'C', 'D', 'E']

ax.pie(sizes, labels=labels, autopct='%1.1f%%', startangle=90)

for text in ax.texts:
    text.set_sketch_params(scale=1, length=30, randomness=0.1)

ax.set_title("How2matplotlib.com - Pie Chart with Sketch Effect")
plt.show()
Output:
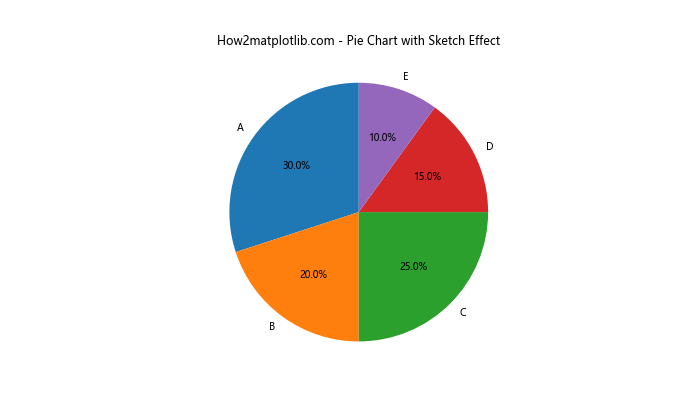
这个例子展示了如何在饼图中对文本标签应用草图效果,为传统的饼图添加一些艺术风格。
10. 结合其他可视化库
虽然set_sketch_params()是Matplotlib的特有功能,但您可以将其与其他可视化库结合使用,以创建更加丰富的可视化效果。
10.1 结合Seaborn
import matplotlib.pyplot as plt
import seaborn as sns
import numpy as np

sns.set_style("whitegrid")
fig, ax = plt.subplots(figsize=(10, 6))

x = np.linspace(0, 10, 100)
y = np.sin(x) + np.random.normal(0, 0.1, 100)

sns.lineplot(x=x, y=y, ax=ax)

for tick in ax.xaxis.get_major_ticks() + ax.yaxis.get_major_ticks():
    tick.set_sketch_params(scale=1, length=50, randomness=0.2)

ax.set_title("How2matplotlib.com - Seaborn Plot with Matplotlib Sketch Effect")
plt.show()
Output:
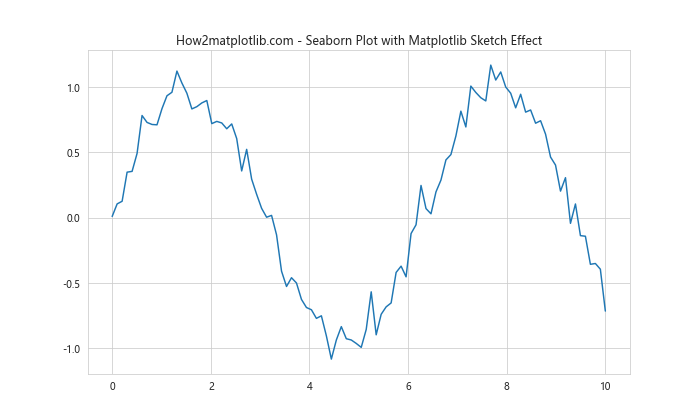
这个例子展示了如何在Seaborn创建的图表上应用Matplotlib的草图效果,结合了两个库的优点。
结论
axis.Tick.set_sketch_params()函数是Matplotlib中一个强大而灵活的工具,可以为您的数据可视化添加独特的艺术风格。通过调整scale、length和randomness参数,您可以创建各种手绘效果,从微妙的质感到明显的草图风格。这个函数不仅可以应用于简单的线图和散点图,还可以用于复杂的统计图表和自定义可视化。
在使用这个函数时,重要的是要平衡视觉吸引力和数据清晰度。适度使用草图效果可以增强图表的美感,但过度使用可能会影响数据的可读性。通过实践和实验,您可以找到最适合您的数据和目标受众的平衡点。
最后,记住set_sketch_params()只是Matplotlib众多自定义选项中的一个。将它与其他绘图技巧和样式选项结合使用,可以创建出真正独特和引人注目的数据可视化。无论您是在创建科学报告、数据新闻还是艺术作品,掌握这个函数都将为您的可视化工具箱增添一个有价值的工具。
 极客笔记
极客笔记