Matplotlib中的Axis.get_transform()函数:坐标变换的关键
参考:Matplotlib.axis.Axis.get_transform() function in Python
Matplotlib是Python中最流行的数据可视化库之一,它提供了丰富的绘图功能和灵活的自定义选项。在Matplotlib中,坐标变换是一个非常重要的概念,它允许我们在不同的坐标系统之间进行转换,从而实现更复杂的绘图效果。本文将深入探讨Matplotlib中的Axis.get_transform()函数,这是实现坐标变换的关键方法之一。
1. 什么是Axis.get_transform()函数?
Axis.get_transform()是Matplotlib库中axis.Axis类的一个方法。这个函数的主要作用是获取与特定坐标轴相关联的坐标变换对象。这个变换对象包含了从数据坐标到显示坐标的映射信息,是实现各种绘图效果的基础。
让我们通过一个简单的例子来了解get_transform()函数的基本用法:
import matplotlib.pyplot as plt
import numpy as np

fig, ax = plt.subplots()
x = np.linspace(0, 10, 100)
y = np.sin(x)
ax.plot(x, y, label='how2matplotlib.com')

# 获取x轴的变换对象
x_transform = ax.xaxis.get_transform()
print(type(x_transform))

plt.legend()
plt.title('Basic usage of get_transform()')
plt.show()
Output:
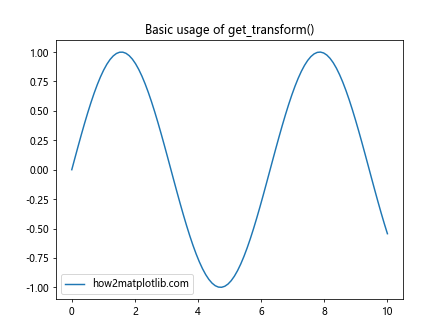
在这个例子中,我们首先创建了一个简单的正弦曲线图。然后,我们使用ax.xaxis.get_transform()获取了x轴的变换对象。通过打印这个对象的类型,我们可以看到它是一个matplotlib.transforms.CompositeGenericTransform对象。
2. 坐标变换的基本概念
在深入了解get_transform()函数之前,我们需要先理解Matplotlib中坐标变换的基本概念。
2.1 数据坐标系
数据坐标系是我们最常用的坐标系,它直接对应于我们的数据值。例如,当我们绘制一个点(3, 4)时,我们使用的就是数据坐标系。
2.2 轴坐标系
轴坐标系是相对于坐标轴的坐标系。在这个系统中,坐标值范围通常是0到1,其中0表示轴的起点,1表示轴的终点。
2.3 图形坐标系
图形坐标系是相对于整个图形的坐标系。同样,它的坐标值也通常在0到1之间,其中(0, 0)表示图形的左下角,(1, 1)表示图形的右上角。
2.4 显示坐标系
显示坐标系是最终用于在屏幕上渲染图形的坐标系。它使用像素作为单位,原点通常在图形的左上角。
让我们通过一个例子来说明这些坐标系:
import matplotlib.pyplot as plt
import numpy as np

fig, ax = plt.subplots(figsize=(8, 6))

# 数据坐标系
x_data = np.linspace(0, 10, 100)
y_data = np.sin(x_data)
ax.plot(x_data, y_data, label='Data in how2matplotlib.com')

# 轴坐标系
ax.axhline(y=0.5, color='r', linestyle='--', label='Axis coords')

# 图形坐标系
fig.text(0.5, 0.95, 'Figure coords', ha='center')

plt.legend()
plt.title('Different coordinate systems')
plt.show()
Output:
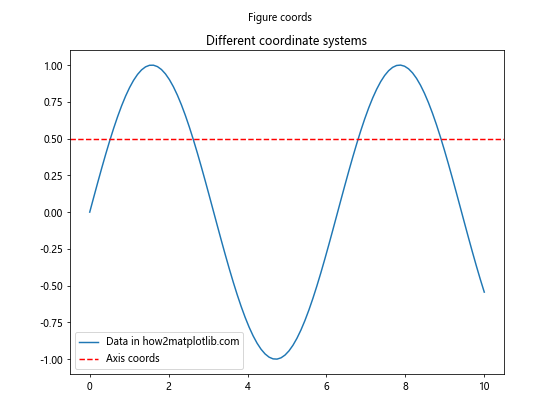
在这个例子中,我们展示了三种不同的坐标系:
1. 数据坐标系:用于绘制正弦曲线
2. 轴坐标系:用于绘制水平虚线(y=0.5)
3. 图形坐标系:用于添加文本(位于图形顶部中央)
3. get_transform()函数的返回值
get_transform()函数返回一个变换对象,这个对象包含了从数据坐标到显示坐标的映射信息。返回的具体类型可能是以下几种之一:
matplotlib.transforms.CompositeGenericTransformmatplotlib.transforms.BlendedGenericTransformmatplotlib.transforms.IdentityTransform
这些变换对象都继承自matplotlib.transforms.Transform基类,它们提供了一系列方法来进行坐标变换。
让我们看一个例子,展示如何使用get_transform()获取变换对象并查看其属性:
import matplotlib.pyplot as plt
import numpy as np

fig, ax = plt.subplots()
x = np.linspace(0, 10, 100)
y = np.sin(x)
ax.plot(x, y, label='how2matplotlib.com')

# 获取x轴的变换对象
x_transform = ax.xaxis.get_transform()

print(f"Transform type: {type(x_transform)}")
print(f"Is separable: {x_transform.is_separable}")
print(f"Has inverse: {x_transform.has_inverse}")

plt.legend()
plt.title('Properties of get_transform() return value')
plt.show()
Output:
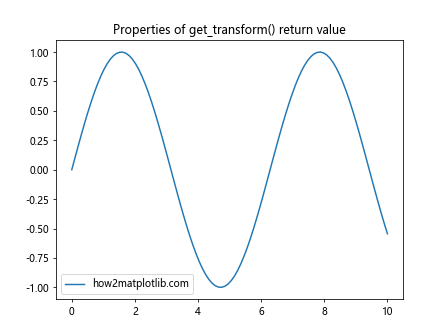
在这个例子中,我们获取了x轴的变换对象,并打印了它的一些属性。is_separable属性表示这个变换是否可以分离为x和y方向的独立变换,has_inverse属性表示这个变换是否有逆变换。
4. 使用get_transform()进行坐标变换
get_transform()函数最常见的用途是进行坐标变换。我们可以使用它来将数据坐标转换为显示坐标,或者反过来。
4.1 从数据坐标到显示坐标
让我们看一个例子,展示如何使用get_transform()将数据坐标转换为显示坐标:
import matplotlib.pyplot as plt
import numpy as np

fig, ax = plt.subplots()
x = np.linspace(0, 10, 100)
y = np.sin(x)
ax.plot(x, y, label='how2matplotlib.com')

# 获取变换对象
transform = ax.transData

# 选择一个数据点
data_point = (5, np.sin(5))

# 转换为显示坐标
display_point = transform.transform(data_point)

print(f"Data point: {data_point}")
print(f"Display point: {display_point}")

# 在图上标记这个点
ax.plot(data_point[0], data_point[1], 'ro')
ax.annotate(f'({data_point[0]:.2f}, {data_point[1]:.2f})',
            xy=data_point, xytext=(10, 10),
            textcoords='offset points')

plt.legend()
plt.title('Coordinate transformation with get_transform()')
plt.show()
Output:
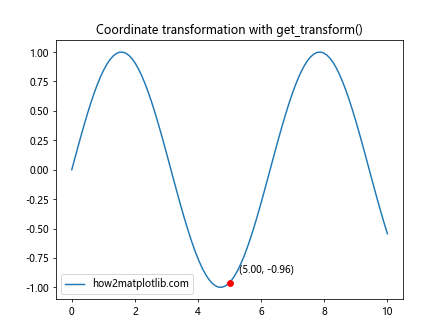
在这个例子中,我们首先获取了数据到显示坐标的变换对象(ax.transData)。然后,我们选择了一个数据点(5, sin(5)),并使用transform.transform()方法将其转换为显示坐标。最后,我们在图上标记了这个点,并添加了注释。
4.2 从显示坐标到数据坐标
我们也可以进行反向变换,从显示坐标转换回数据坐标。这在处理鼠标事件或者自定义交互功能时特别有用。
import matplotlib.pyplot as plt
import numpy as np

fig, ax = plt.subplots()
x = np.linspace(0, 10, 100)
y = np.sin(x)
ax.plot(x, y, label='how2matplotlib.com')

# 获取变换对象
transform = ax.transData

# 选择一个显示坐标点
display_point = (200, 200)

# 转换为数据坐标
data_point = transform.inverted().transform(display_point)

print(f"Display point: {display_point}")
print(f"Data point: {data_point}")

# 在图上标记这个点
ax.plot(data_point[0], data_point[1], 'ro')
ax.annotate(f'({data_point[0]:.2f}, {data_point[1]:.2f})',
            xy=data_point, xytext=(10, 10),
            textcoords='offset points')

plt.legend()
plt.title('Inverse coordinate transformation')
plt.show()
Output:
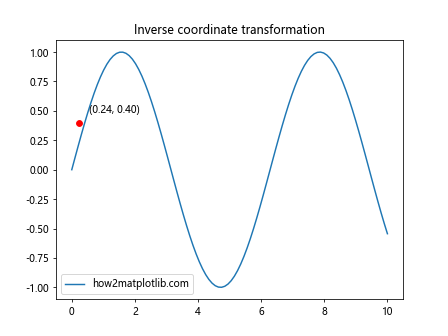
在这个例子中,我们首先选择了一个显示坐标点(200, 200)。然后,我们使用transform.inverted().transform()方法将其转换回数据坐标。最后,我们在图上标记了这个点,并添加了注释。
5. get_transform()在自定义变换中的应用
get_transform()函数不仅可以用于获取默认的坐标变换,还可以用于创建自定义的坐标变换。这在创建特殊的绘图效果时非常有用。
5.1 创建复合变换
我们可以将多个变换组合在一起,创建一个复合变换。例如,我们可以将数据坐标先转换为轴坐标,然后再转换为图形坐标。
import matplotlib.pyplot as plt
import numpy as np
from matplotlib.transforms import blended_transform_factory

fig, ax = plt.subplots()
x = np.linspace(0, 10, 100)
y = np.sin(x)
ax.plot(x, y, label='how2matplotlib.com')

# 创建复合变换
data_to_axes = ax.transData + ax.transAxes.inverted()
axes_to_fig = ax.transAxes + fig.transFigure.inverted()
data_to_fig = data_to_axes + axes_to_fig

# 选择一个数据点
data_point = (5, np.sin(5))

# 转换为图形坐标
fig_point = data_to_fig.transform(data_point)

print(f"Data point: {data_point}")
print(f"Figure point: {fig_point}")

# 在图形坐标系中添加文本
fig.text(fig_point[0], fig_point[1], 'Custom transform',
         ha='center', va='center', bbox=dict(facecolor='white', alpha=0.7))

plt.legend()
plt.title('Custom composite transform')
plt.show()
Output:
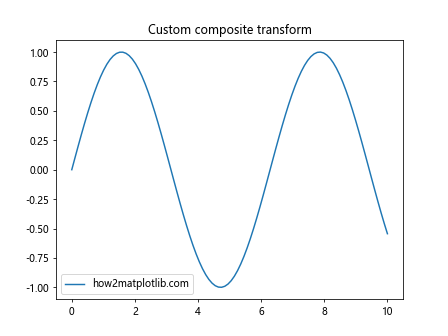
在这个例子中,我们创建了一个从数据坐标到图形坐标的复合变换。我们首先将数据坐标转换为轴坐标,然后再转换为图形坐标。最后,我们使用这个复合变换将一个数据点转换为图形坐标,并在该位置添加了文本。
5.2 创建混合变换
混合变换允许我们对x轴和y轴使用不同的变换。这在创建某些特殊的绘图效果时非常有用。
import matplotlib.pyplot as plt
import numpy as np
from matplotlib.transforms import blended_transform_factory

fig, ax = plt.subplots()
x = np.linspace(0, 10, 100)
y = np.sin(x)
ax.plot(x, y, label='how2matplotlib.com')

# 创建混合变换
transform = blended_transform_factory(ax.transData, ax.transAxes)

# 添加垂直线
ax.axvline(x=5, transform=transform, color='r', linestyle='--', label='Blended transform')

# 添加文本
ax.text(5, 0.5, 'Blended transform', transform=transform,
        rotation=90, va='center', ha='right')

plt.legend()
plt.title('Blended transform example')
plt.show()
在这个例子中,我们创建了一个混合变换,x轴使用数据坐标,y轴使用轴坐标。我们使用这个变换添加了一条垂直线和一个文本标签。垂直线的x坐标在数据坐标系中是5,而y坐标在轴坐标系中从0延伸到1。
6. get_transform()在动画中的应用
get_transform()函数在创建动画时也非常有用,特别是当我们需要在动画过程中改变坐标系或者进行坐标变换时。
import matplotlib.pyplot as plt
import numpy as np
from matplotlib.animation import FuncAnimation

fig, ax = plt.subplots()
line, = ax.plot([], [], lw=2)
ax.set_xlim(-2, 2)
ax.set_ylim(-2, 2)

def init():
    line.set_data([], [])
    return line,

def animate(i):
    t = np.linspace(0, 2*np.pi, 100)
    x = np.cos(t)
    y = np.sin(t)

    # 创建旋转变换
    transform = ax.get_transform().rotate_deg(i)

    # 应用变换
    points = transform.transform(np.column_stack((x, y)))
    line.set_data(points[:, 0], points[:, 1])

    ax.set_title(f'Rotation: {i}° - how2matplotlib.com')
    return line,

anim = FuncAnimation(fig, animate, init_func=init, frames=360, interval=20, blit=True)
plt.show()
Output:
在这个例子中,我们创建了一个动画,展示了一个旋转的圆。我们使用get_transform()获取当前的变换对象,然后使用rotate_deg()方法创建一个旋转变换。在每一帧中,我们都应用这个旋转变换来更新圆的位置。## 7. get_transform()在3D绘图中的应用
虽然get_transform()主要用于2D绘图,但它在3D绘图中也有应用。在3D绘图中,我们需要处理更复杂的坐标变换,get_transform()可以帮助我们理解和操作这些变换。
import matplotlib.pyplot as plt
import numpy as np
from mpl_toolkits.mplot3d import Axes3D

fig = plt.figure()
ax = fig.add_subplot(111, projection='3d')

# 创建一些3D数据
x = np.linspace(-5, 5, 100)
y = np.linspace(-5, 5, 100)
X, Y = np.meshgrid(x, y)
Z = np.sin(np.sqrt(X**2 + Y**2))

# 绘制3D表面
surf = ax.plot_surface(X, Y, Z, cmap='viridis')

# 获取3D变换
transform = ax.get_transform()

# 选择一个3D点
point_3d = (2, 2, np.sin(np.sqrt(2**2 + 2**2)))

# 转换为2D显示坐标
point_2d = transform.transform(point_3d)

print(f"3D point: {point_3d}")
print(f"2D display point: {point_2d}")

# 在3D图上标记这个点
ax.scatter(*point_3d, color='red', s=50)

ax.set_title('3D transform with get_transform() - how2matplotlib.com')
plt.show()
Output:
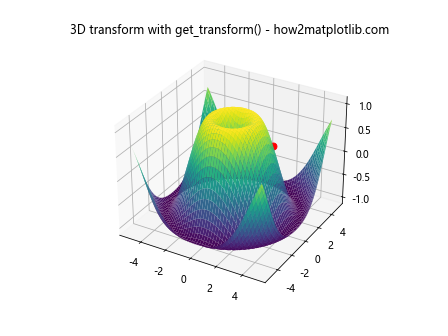
在这个例子中,我们创建了一个3D表面图。然后,我们使用get_transform()获取3D变换对象,并用它将一个3D点转换为2D显示坐标。这对于理解3D图形如何在2D屏幕上显示非常有帮助。
8. get_transform()在极坐标系中的应用
get_transform()函数在处理极坐标系时也非常有用。极坐标系是一种非笛卡尔坐标系,它使用距离和角度来表示点的位置。
import matplotlib.pyplot as plt
import numpy as np

fig, ax = plt.subplots(subplot_kw=dict(projection='polar'))

# 创建极坐标数据
r = np.linspace(0, 2, 100)
theta = 4 * np.pi * r

# 绘制极坐标图
ax.plot(theta, r, label='how2matplotlib.com')

# 获取极坐标变换
transform = ax.get_transform()

# 选择一个极坐标点
polar_point = (np.pi/2, 1)  # 90度,半径为1

# 转换为显示坐标
display_point = transform.transform(polar_point)

print(f"Polar point: {polar_point}")
print(f"Display point: {display_point}")

# 在图上标记这个点
ax.plot(polar_point[0], polar_point[1], 'ro')
ax.annotate(f'({polar_point[0]:.2f}, {polar_point[1]:.2f})',
            xy=polar_point, xytext=(0.2, 0.2),
            textcoords='axes fraction',
            arrowprops=dict(arrowstyle="->", connectionstyle="arc3"))

plt.legend()
plt.title('Polar coordinate transform')
plt.show()
Output:
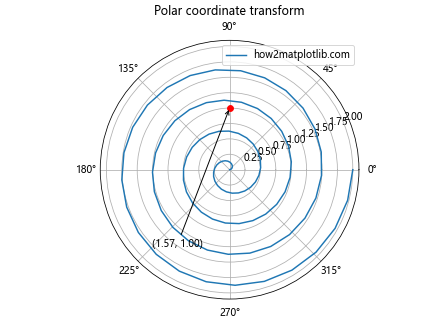
在这个例子中,我们创建了一个极坐标图。我们使用get_transform()获取极坐标变换对象,并用它将一个极坐标点转换为显示坐标。这对于在极坐标图上精确定位标注和其他元素非常有用。
9. get_transform()在处理对数坐标轴时的应用
当我们使用对数坐标轴时,get_transform()函数可以帮助我们理解和操作对数变换。
import matplotlib.pyplot as plt
import numpy as np

fig, ax = plt.subplots()

# 创建对数坐标数据
x = np.logspace(0, 3, 100)
y = x**2

# 绘制对数-对数图
ax.loglog(x, y, label='how2matplotlib.com')

# 获取对数变换
transform = ax.get_transform()

# 选择一个点
log_point = (100, 10000)

# 转换为显示坐标
display_point = transform.transform(log_point)

print(f"Log point: {log_point}")
print(f"Display point: {display_point}")

# 在图上标记这个点
ax.plot(log_point[0], log_point[1], 'ro')
ax.annotate(f'({log_point[0]}, {log_point[1]})',
            xy=log_point, xytext=(1.1, 1.1),
            textcoords='axes fraction',
            arrowprops=dict(arrowstyle="->", connectionstyle="arc3"))

plt.legend()
plt.title('Logarithmic coordinate transform')
plt.show()
Output:
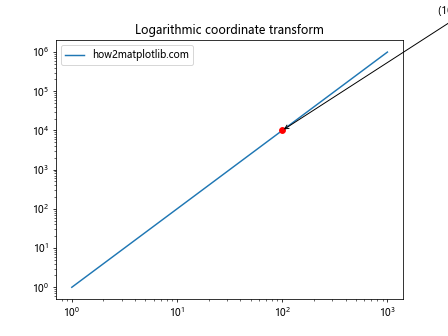
在这个例子中,我们创建了一个对数-对数图。我们使用get_transform()获取对数变换对象,并用它将一个对数坐标点转换为显示坐标。这对于理解对数坐标系如何映射到显示空间非常有帮助。
10. get_transform()在处理不同单位的数据时的应用
当我们需要在同一个图上绘制具有不同单位或量级的数据时,get_transform()函数可以帮助我们创建双轴图。
import matplotlib.pyplot as plt
import numpy as np

fig, ax1 = plt.subplots()

# 创建第一组数据
x = np.linspace(0, 10, 100)
y1 = np.sin(x)

# 绘制第一组数据
ax1.plot(x, y1, 'b-', label='sin(x) - how2matplotlib.com')
ax1.set_xlabel('x')
ax1.set_ylabel('sin(x)', color='b')
ax1.tick_params(axis='y', labelcolor='b')

# 创建第二个y轴
ax2 = ax1.twinx()

# 创建第二组数据
y2 = np.exp(x)

# 绘制第二组数据
ax2.plot(x, y2, 'r-', label='exp(x)')
ax2.set_ylabel('exp(x)', color='r')
ax2.tick_params(axis='y', labelcolor='r')

# 获取两个轴的变换
transform1 = ax1.get_transform()
transform2 = ax2.get_transform()

# 选择一个点
point = (5, np.sin(5))

# 转换为显示坐标
display_point1 = transform1.transform(point)
display_point2 = transform2.transform((point[0], np.exp(point[0])))

print(f"Data point: {point}")
print(f"Display point (left axis): {display_point1}")
print(f"Display point (right axis): {display_point2}")

plt.title('Dual axis plot with different transforms')
fig.tight_layout()
plt.show()
Output:
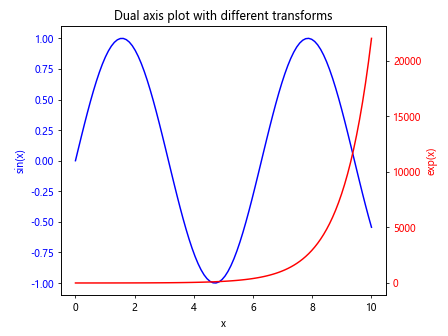
在这个例子中,我们创建了一个双轴图,左轴显示sin(x),右轴显示exp(x)。我们使用get_transform()获取两个轴的变换对象,并用它们将同一个x坐标点转换为不同的显示坐标。这展示了如何处理具有不同单位或量级的数据。
11. get_transform()在自定义投影中的应用
Matplotlib支持多种地图投影,get_transform()函数在处理这些自定义投影时非常有用。
import matplotlib.pyplot as plt
import cartopy.crs as ccrs

fig = plt.figure(figsize=(10, 5))
ax = fig.add_subplot(1, 1, 1, projection=ccrs.Robinson())

# 绘制地图
ax.stock_img()

# 获取投影变换
transform = ax.get_transform()

# 选择一个经纬度点(伦敦)
lon, lat = -0.1276, 51.5074

# 转换为显示坐标
display_point = transform.transform((lon, lat))

print(f"Longitude, Latitude: ({lon}, {lat})")
print(f"Display point: {display_point}")

# 在地图上标记这个点
ax.plot(lon, lat, 'ro', transform=ccrs.PlateCarree())
ax.text(lon, lat, 'London', transform=ccrs.PlateCarree())

plt.title('Custom projection transform - how2matplotlib.com')
plt.show()
Output:
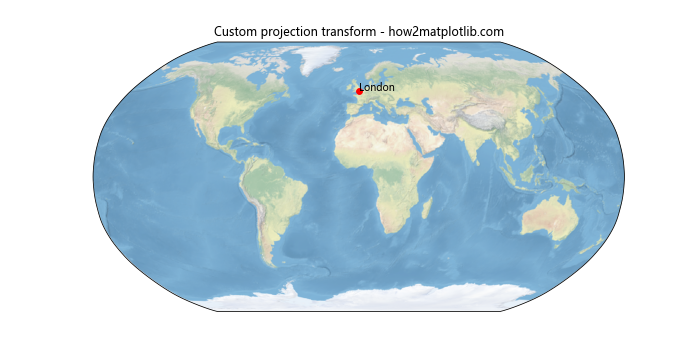
在这个例子中,我们使用Cartopy库创建了一个Robinson投影的世界地图。我们使用get_transform()获取投影变换对象,并用它将经纬度坐标转换为显示坐标。这对于在自定义投影的地图上精确定位标记和标注非常有用。
12. get_transform()在处理图像数据时的应用
当我们在Matplotlib中处理图像数据时,get_transform()函数可以帮助我们理解和操作图像坐标系。
import matplotlib.pyplot as plt
import numpy as np

# 创建一个简单的图像
image = np.random.rand(10, 10)

fig, ax = plt.subplots()
im = ax.imshow(image, extent=[0, 10, 0, 10])

# 获取图像变换
transform = ax.get_transform()

# 选择一个图像坐标点
image_point = (5, 5)

# 转换为显示坐标
display_point = transform.transform(image_point)

print(f"Image point: {image_point}")
print(f"Display point: {display_point}")

# 在图像上标记这个点
ax.plot(image_point[0], image_point[1], 'ro')
ax.annotate(f'({image_point[0]}, {image_point[1]})',
            xy=image_point, xytext=(7, 7),
            arrowprops=dict(arrowstyle="->", connectionstyle="arc3"))

plt.colorbar(im)
plt.title('Image coordinate transform - how2matplotlib.com')
plt.show()
Output:
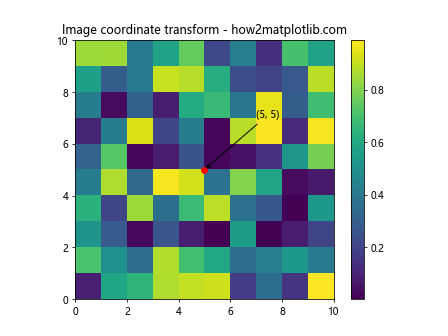
在这个例子中,我们创建了一个简单的随机图像。我们使用get_transform()获取图像变换对象,并用它将图像坐标转换为显示坐标。这对于在图像上精确定位和添加注释非常有用。
总结
通过本文,我们深入探讨了Matplotlib中Axis.get_transform()函数的各种应用。我们了解了这个函数在不同类型的图表中的使用方法,包括2D图表、3D图表、极坐标图、对数坐标图、双轴图、地图投影和图像处理等。
get_transform()函数是Matplotlib中坐标变换的核心,它为我们提供了强大的工具来处理不同坐标系之间的转换。通过使用这个函数,我们可以:
- 在数据坐标和显示坐标之间进行转换
- 创建复合变换和混合变换
- 处理特殊的坐标系,如极坐标和对数坐标
- 在3D图形中进行坐标变换
- 处理地图投影和图像坐标
掌握get_transform()函数的使用可以让我们更灵活地控制图形的绘制,创建更复杂和精确的可视化效果。无论是进行数据分析、科学研究还是创建数据可视化产品,深入理解和灵活运用get_transform()函数都将大大提升我们使用Matplotlib的能力。
希望这篇文章能够帮助你更好地理解和使用Matplotlib中的Axis.get_transform()函数。随着你在数据可视化领域的不断探索,你会发现这个函数在许多复杂场景中都能发挥重要作用。继续实践和探索,你将能够创建出更加精美和富有洞察力的数据可视化作品。
 极客笔记
极客笔记